 Michael O. Akinseloyin
 Carter Hall
 Emily M. Stallbaumer-Cyr
 Jordan A. Morrow
 Melanie M. Derby
- Alan Levin Department of Mechanical and Nuclear Engineering, Kansas State University, Manhattan, KS, United States
Introduction: To reduce greenhouse gases, the Kigali Amendment to the Montreal Protocol seeks a phasedown of hydrofluorocarbons. R134a alternatives were analyzed for use in a water-cooled chiller: R450A, R513A, R516A, R1234ze (E), R515A, and R515B.
Methods: A thermodynamic model of the chiller was employed to calculate compressor power, an input to the life cycle climate performance (LCCP) framework to estimate total equivalent carbon dioxide emissions, CO2eq. Emissions were calculated for an 809 kW [230 Tons of refrigeration (RT) nameplate] water-cooled centrifugal chiller at constant cooling capacity using five power sources (i.e., coal, distillate fuel oil, natural gas, nuclear, and wind) for a median chiller lifetime of 27 years. Two chiller operating profiles were considered: one using operational data from a university campus and a second from literature based on the Atlantic Fleet operation.
Results and discussion: When powered via fossil fuels, over 90% of emissions were due to the indirect emissions from energy; therefore, the global warming potential (GWP) of the refrigerant was not the primary contributor to the total CO2eq emissions. With natural gas, total LCCP emissions were reduced for R450A (7.8%), R513A (4.7%), R516A (9.4%), R1234ze (E) (10%), R515A (8.4%), and R515B (6.4%) compared to R134a for the university campus load profile. For the round-the-clock Atlantic Fleet profile, there were emission reductions for R450A (3.6%), R513A (0.25%), R516A (2.3%), R1234ze (E) (2.4%), R515A (1.5%) and R515B (2.4%) compared to R134a. When coupled with renewable energy, the indirect emissions from the chillers substantially decreased, and GWP-dependent leakage emissions accounted for up to 74% or 40% of emissions from R134a alternatives powered by wind and nuclear, respectively. For operation using the load profile from the university campus chillers, R450A had the highest coefficient of performance (COP) of 5.802, while R513A had the lowest COP (5.606). Tradeoffs between alternative refrigerants exist in terms of operation, temperature glide, size of heat exchangers, system design, flammability, cost, availability, and material compatibility. In terms of flammability, R134a, R513A, R450A, R515B and R515A are A1 (nonflammable) fluids. R450A and R516A also have temperature glides of 0.4 K and 0.056 K, respectively, which can affect condenser design. In terms of equipment modification (sizing), R513A require fewer modifications.
1 Introduction
The 2016 Kigali Amendment—the most recent addition to the Montreal Protocol—aims to reduce hydrofluorocarbons (HFC) production and consumption (Heath, 2017), and in 2021, the White House proposed a 50%–52% reduction in green gas emissions from 2005 levels by the year 2030 (WhiteHouse, 2021). These policies support achieving net zero emissions (i.e., carbon neutrality) by 2050 and limiting average global temperature rises to 1.5°C (UN, 2023). Approaches to reducing CO2 emissions from heating, ventilation, air conditioning, and refrigeration (HVAC&R) systems vary by region; for example, the European Union’s F-gas regulations set a fluid’s global warming potential (GWP) limit to 150 for specific HVAC&R applications. Thus, there is significant interest in replacing the hydrofluorocarbon R134a in HVAC&R systems (Heredia-Aricapa et al., 2020) with alternative, lower GWP refrigerants for drop-in replacements, such as hydrofluoroolefins [R1234ze (E)] and their blends [e.g., R513A, R450A, R516A (Brown et al., 2014; Nair, 2021)], although boiling and condensing heat transfer coefficients for these alternative fluids can be lower than R134a under specific flow conditions (Jacob et al., 2019; Nair, 2021; Morrow and Derby, 2022). Mildly flammable (i.e., ASHRAE-designated A2L), hydrofluoroolefin (HFO) refrigerants must comply with additional ventilation, detection, and safety standards (ASHRAE, 2019), as there are also other safety requirements for systems exceeding charges of 10 kg in commercial occupancies.
Policies, such as the F-gas regulations, tend to focus on the refrigerant’s GWP to measure its environmental impacts, but quantifying total equivalent CO2 emissions, CO2eq, is a more holistic approach (Andersen, 1999). The life cycle climate performance (LCCP) framework, developed by the United Nations Environmental Program (Hwang et al., 2015; Lee et al., 2016), builds upon the Total Equivalent Warming model developed by Oak Ridge National Laboratory (Makhnatch and Khodabandeh, 2014; Mota-Babiloni et al., 2020; Wan et al., 2021), by incorporating a “cradle-to-grave” mindset. LCCP calculations quantify indirect greenhouse gas emissions from power generation and embodied emissions (e.g., manufacturing, emissions embodied in manufacturing the system) in addition to quantifying direct CO2 emissions as a result of the fluid’s GWP (e.g., leaking, accidental release during servicing, end-of-life disposal, etc.,) (Mota-Babiloni et al., 2020; Wan et al., 2021).
Indirect emissions from electricity generation were significant for vapor compression cycle heat pumps (Li, 2015; Lee et al., 2016; Yang et al., 2021). For example, energy emissions from R410A alternatives were approximately 97%–98% of total LCCP emissions for the Chicago climate for a residential heat pump (Lee et al., 2016), and Wan et al. (2021) determined 70%–80% of emissions were from indirect emissions for commercial and residential air conditioning systems. LCCP analyses conducted for industrial chiller systems are limited; Li (2021) utilized the LCCP framework for centrifugal chillers with low GWP R134a alternatives in China and South Korea and noted that total LCCP emissions could decrease by up to 28% based on the fluid and region. Altering system configurations can increase performance, thereby reducing lifetime emissions. In life cycle analyses for five Chinese cities, transcritical CO2 heat pump systems were integrated with direct dedicated mechanical subcooling to reduce primary energy consumption, and hence CO2 emissions by up to 17%, 33%, and 69% compared with baseline CO2 heat pumps, coal-fired boilers, and direct electric heating, respectively (Dai et al., 2019). Based on life cycle analyses for heating applications, high temperature heat pumps with ejectors and two-stage compression reduced emissions up to 76% compared to fossil fuel-fired boilers (Dai et al., 2023). Another approach to reducing indirect emissions is to use high temperature power systems for cogeneration and multigeneration purposes (Rahbari et al., 2023).
Alternative fluids can affect cycle performance, including the coefficient of performance (COP) and capacity. Yi et al. (2022) performed numerical simulations of a drop-in test of R1234yf and R1234ze (E) in an R134a centrifugal compressor system. Performance curves from working conditions were generated; using R1234yf produced a higher cooling capacity and COP reduction of about 12.5% compared to R134a. The cooling capacity of R1234ze (E) was reduced under partial working conditions with COP reduced by 7.0% compared to R134a (Yi et al., 2022). Schultz et al. (2016) noted reduced COPs at equivalent capacities with R513A in an 809 kW (230RT) water-cooled chiller due in part to lower refrigerant-side heat transfer coefficients in the evaporator and condenser; however, R513A had favorable material compatibility and chemical stability. The COP with R513A was 5% lower than R134a; they attributed half of this difference to R513A’s thermophysical properties and half to condenser design.
The research objectives of this paper are to analyze the carbon dioxide emissions from water-cooled, centrifugal chillers using the life cycle climate performance framework for R134a and its lower global warming potential alternatives [i.e., R1234ze (E), R450A, R513A, R516A, R515A, and R515B]. A thermodynamic model is employed to model the chillers with a nameplate capacity of 809 kW (230RT) and the model is validated based on experimental data obtained by the Air-Conditioning, Heating and Refrigeration Institute (Amrane, 2015). Two chiller operational profiles are analyzed and the use of real, operational chiller data is a novel part of this study; one is based on university operations in the Midwest of the United States, and the second is a round-the-clock profile with operation every hour of the year [i.e., Atlantic fleet profile (Helmick, 1987)]. This study takes a holistic view of carbon dioxide emissions generated by water-cooled chillers by using the LCCP framework, thereby analyzing other sources of carbon dioxide emissions in addition to leakage emissions from the GWP of the fluids.
2 Modeling
This paper discusses the chiller model and its validation in Section 2.1.1; Section 2.1.2, chiller operating profiles in Section 2.1.3, and the LCCP framework in Section 2.2.
2.1 Chiller model
The primary objective of chiller modeling is to determine the compressor power required to operate an 809 kW (230 RT) water-cooled chiller with R134a and its alternatives. The chiller model is based on the system presented in AHRI data sheets (Amrane, 2015). The major components in the chiller are the evaporator, compressor, condenser, and expansion valve (Figure 1). Refrigerant is assumed to be at the suction pressure, Ps, on the low-pressure side. At the evaporator exit, state 1, the refrigerant was superheated and then further superheated with compressor suction superheat at state 2 to T2 to protect the compressor. The refrigerant exits the compressor at the discharge pressure Pd, and at compressor discharge temperature Tcd. It enters the condenser at Temperature T3 and at the condenser exit, the refrigerant exits at the discharge pressure. An expansion valve, assumed to be isenthalpic (i.e., same enthalpy across the valve), separates the low-pressure and high-pressure sides.
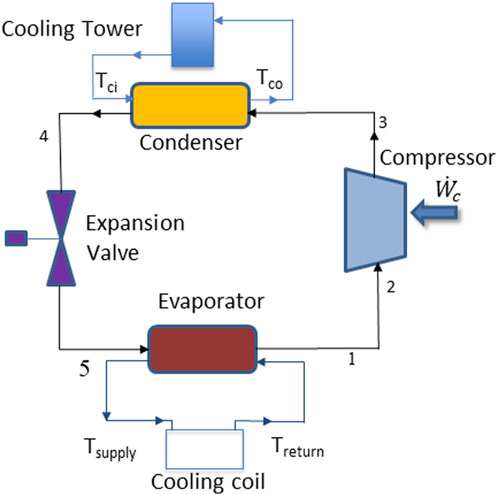
FIGURE 1. Schematic of a water-cooled chiller, including the refrigerant loop, chilled water at the evaporator, and cooling water loop at the condenser.
The chiller’s capacity (i.e., the heat transfer to the evaporator from the chilled water loop) is a critical consideration for alternative refrigerants. In the chilled water loop, Treturn is the temperature of the chilled water entering the chiller, which rejects heat to the refrigerant and leaves at the supply temperature Tsupply; the chilled water entering temperature is assumed to be the mean evaporator temperature. The condenser rejects heat to a water-based cooling loop (e.g., a cooling tower). The high temperature and pressure refrigerant from the compressor transfers heat at a mean condenser temperature to cooling water entering at temperature Tci, and the refrigerant is subcooled to a temperature T4 at state 4. The cooling water exits the condenser at temperature Tco and rejects heat to the atmosphere.
2.1.1 Thermodynamic model
A thermodynamic model was used to compute the COP and compressor power for each refrigerant, which were inputs to the LCCP analysis. The model was validated using AHRI data in Section 2.1.2 (Amrane, 2015). The assumptions for this analysis include a compressor isentropic efficiency of 70%; no suction pressure losses or pressure drops in the discharge, suction, and liquid lines; limited to centrifugal compressors without side flow, and negligible differences in kinetic energies of refrigerants at suction and discharge. The compressor power is,
where
And heat rejection through the condenser is also computed as
Where the numbered states correspond to Figure 1.
The COP is the ratio of the evaporator cooling capacity to the compressor power,
The model created in Engineering Equation Solver (EES) requires the following inputs: condenser sub-cooler outlet temperature, T4; evaporator outlet temperature, T1; compressor inlet temperature, T2; discharge pressure Pd; suction pressure Ps; and refrigerant type. Figure 2A illustrates the process for validation with AHRI data and Figure 2B is the process to compute compressor power for the LCCP model. These values were computed from the thermodynamic cycle conditions for each alternative refrigerant candidate reported by Amrane (Amrane, 2015): mean evaporator temperature, mean condenser temperature, evaporator outlet superheat, compressor suction superheat, compressor discharge superheat, volumetric capacity, temperature glides of condenser and evaporator. After computing T4 (i.e., condenser temperature—subcooling); T1 (i.e., evaporator mean temperature + evaporator superheat); and T2 (i.e., T1 + compressor suction superheat) using the subcooling, SC, and superheat, SH, temperatures, respectively, thermodynamic properties were calculated, including the compressor discharge temperature Tcd. Temperature T3 corresponds to the compressor discharge temperature minus the compressor discharge superheat. Since each case utilized the same capacity as R134a, this model also outputs the refrigerant mass flow rate,
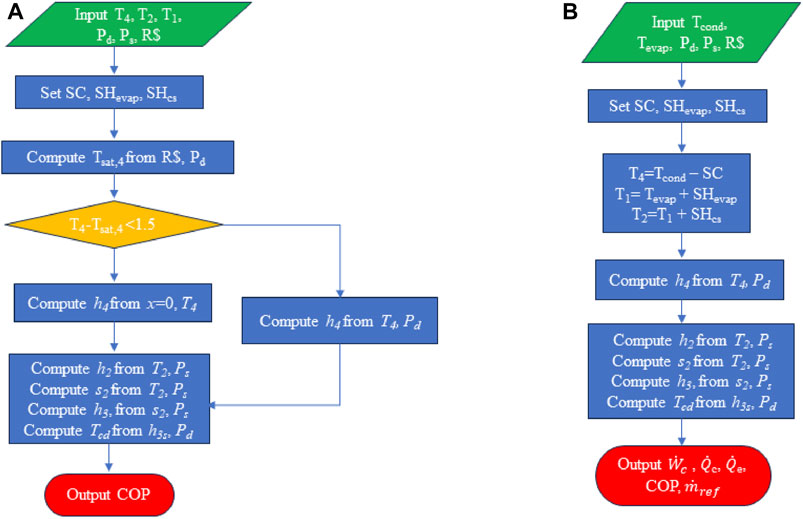
FIGURE 2. The flowchart of the process used to (A) validate AHRI data, and (B) compute compressor power needed for annual energy consumption based on chiller load profiles from the university campus and Helmick (1987).
2.1.2 Validation of the thermodynamic model
The model for COP, and, therefore, compressor power was validated using five experimental data points for the baseline refrigerant (R134a) and alternative refrigerants included in the experimental data sheet R450A, R513A, R516A, and R1234ze (E) (Amrane, 2015). The five experimental data points spanned a range of operating conditions: mean evaporator temperature ranges from −32°C–7.2°C, mean condenser temperature from 37.8°C to 54.4°C, evaporator outlet superheat of 5.6°C, compressor suction superheat from 5.6°C to 22.2°C and subcooling from 0°C to 8.3°C. There was good agreement between the model, as described in Figure 2A, and experimental data from AHRI, shown in Figure 3. For R134a, R450A, R513A, R516A, and R1234ze (E), the mean absolute percentage error, MAPE, for the five experimental data points are 3.99%, 4.53%, 5.08%, 7.08%, and 5.32% respectively. The largest deviations corresponded to conditions with the lowest evaporator temperature and COP (i.e., mean evaporator temperature, mean condenser temperature, and compressor suction superheat of −31.7°C, 40.6°C, and 22.2°C, respectively).
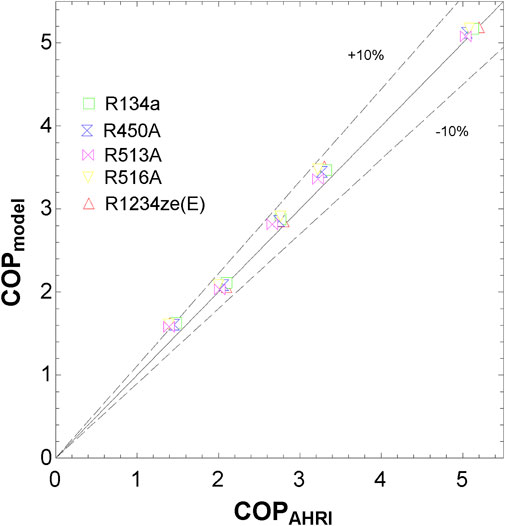
FIGURE 3. Validation of the thermodynamic model against experimental chiller data reported by Amrane (Amrane, 2015).
2.1.3 Chiller operating profiles
For chillers, energy consumption is significantly influenced by the prevailing operating conditions and cooling capacity (Yu and Chan, 2007). Chiller load profiles in literature for the actual operation of centrifugal chillers are limited. The load profiles used for this study are from 1) a university campus, shared by Kansas State University (KSU) facilities for the year 2022, and 2) the Atlantic Fleet profile (Helmick, 1987). For both operating profiles, all refrigerants were set to have the same capacity as R134a; thus, the refrigerant mass flow rate varied between different refrigerants.
The university campus’ system analyzed consisted of two R134a chillers, Chiller 1 and Chiller 2, in a chiller plant built in 2016 (KSU, 2015) with individual capacities of 10,375 kW (2950RT) and a chiller efficiency (i.e., energy consumption in kW per heat removed in RT at rated conditions) of approximately 0.7 kW/RT. Table 1 shows data from Chiller 1 and 2. Due to design redundancies, building occupancy, and weather conditions, the chillers did not run daily; Chiller 1 ran for 100 days, while Chiller 2 operated for 123 days in the year 2022. Despite seasonal temperature differences, chilled water temperatures were often within ± 1°C, and cooling water temperatures were often within ± 3°C. Figure 4A shows the number of hours operated at a range of percentage of full load. Due to the data collection methods, if the chillers were documented as running for the day, it was assumed to have a 24-h operational time. The evaporator cooling capacity and the percentage of full load for every operating condition were computed using the compressor power and the chiller efficiency. The profile focused on the percentage of total chiller load and operational time to scale this down to an 809 kW (230RT) system.
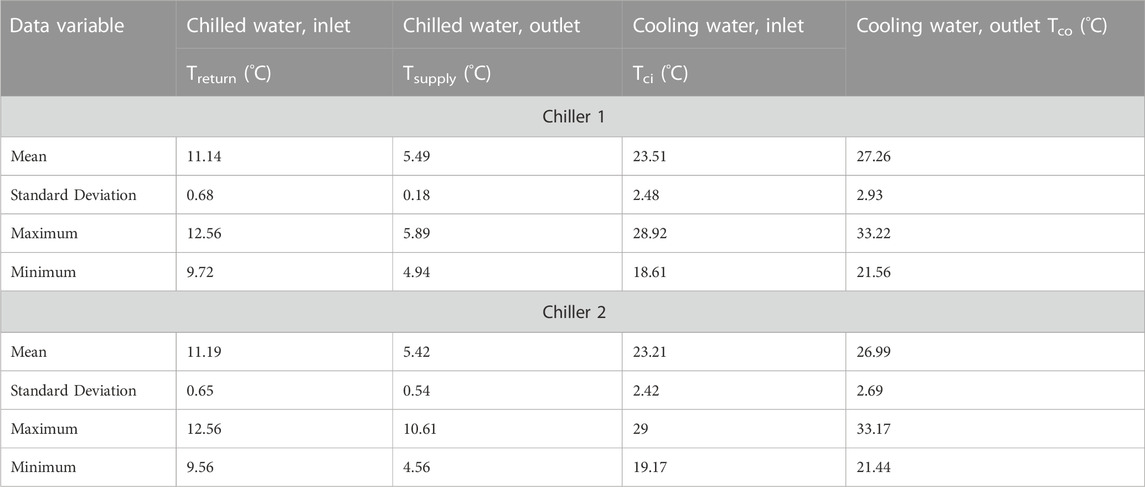
TABLE 1. University campus chiller data for the year 2022.
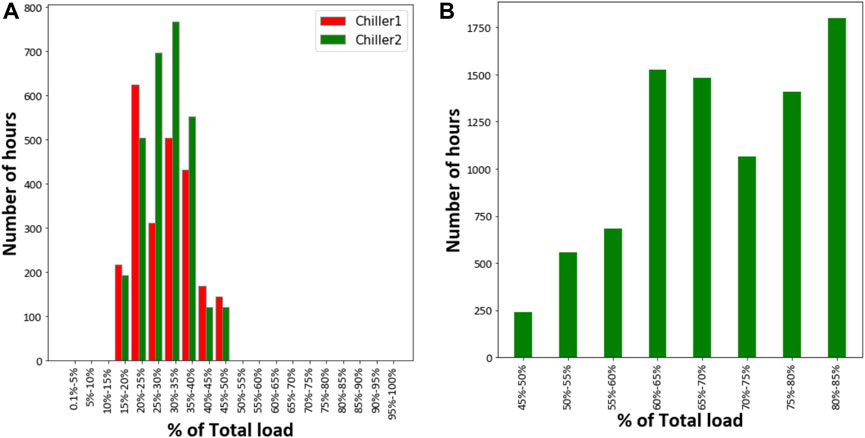
FIGURE 4. Chiller operating profiles for (A) university campus and (B) Atlantic Fleet load profiles (Helmick, 1987).
Figure 2B shows the procedure used to calculate the compressor power for each refrigerant using the university chiller data. From the university campus data, the cooling water return temperature was assumed to be equal to the mean condenser temperature, Tcond, and the chilled water entering temperature equal to the mean evaporator temperature, Tevap. Condenser subcooler outlet temperature, T4, evaporator outlet temperature, T1, and compressor inlet temperature, T2, were computed using subcooling temperature, evaporator superheat, and compressor suction superheat of 5.56°C. Other values for each state and the mass flow rate were calculated for each refrigerant to meet the 809 kW (230RT) capacity. The compressor power was multiplied by the hours operated and summed for all operating conditions.
The Atlantic Fleet air conditioning load profile used an R114 chiller with 703.4 kW (200RT) capacity (Helmick, 1987). It considered a year-round operation, which was categorized based on the air conditioning usage. The hours of operation varied from 33 h when used for battle to 1,347 h at anchor and shore (Figure 4B). In both the Atlantic Fleet and university campus operating profiles, the system was never operated at its maximum nameplate capacity, perhaps due to design redundancy. Using the compressor model and the operating temperatures given (Helmick, 1987), the 200RT was scaled to the profile of 809 kW (230 RT) centrifugal chiller operating with R134a, and the compressor work for the alternative refrigerants was then computed.
2.2 LCCP modeling
The LCCP method (Hwang et al., 2015; Wan et al., 2021) separates emissions into five categories: leakage, Eleak; energy, Eenergy; material, Emat; manufacturing, Eref, man; and disposal, Eref, dis,
Direct emissions are from leakage,
where C is the refrigerant charge in kg; L is the lifespan of the system; ALR is the annual leakage rate, as a percent of refrigerant charge; EOL is end-of-life refrigerant leakage as a result of servicing and refrigerant removal, as a percent of refrigerant charge; GWP is the Global Warming Potential of the refrigerant (kgCO2eq/kgref); and ADP.GWP is the GWP of Atmospheric Degradation Products of the refrigerant (kgCO2eq/kg). GWP values from IPCC AR6 (Smith et al., 2021). Charge values were sourced from the AHRI data sheets; the refrigerant charge used was double the values supplied in the datasheet since the chiller had two operating circuits (Schultz and Kujak, 2013). Drop-in experiments reported that the cooling capacity of R1234ze (E) and R450A reduced by 25% and 15% respectively compared to R134a (Schultz and Kujak, 2013). Poggi et al. (2008) established that 50% of the refrigerant charge in a system can be found in the heat exchangers; since the heat exchangers volume will increase to meet this capacity, in the LCCP model, the charge was increased by 12.5% and 7.5% for R1234ze (E) and R450A, respectively, to augment the capacity reductions observed in their experiments (Schultz and Kujak, 2013).
Indirect CO2 emissions associated with the energy consumption of the system during operation are calculated,
Where AEC is the total annual electrical energy consumption in kWh, EM is the energy emissions factor in kgCO2eq/kWh, and n is the % runtime over the system’s lifetime. The annual energy consumption (AEC) is the linkage between the thermodynamic and LCCP models. It was calculated from the compressor model,
where h3,i and h2,i are the enthalpies across the compressor calculated from the compressor model, and ti is the total time of chiller operation, in hours.
The power source for a system is an important parameter in overall emissions contribution. Energy emission factors for five different power sources (i.e., coal, distillate fuel oil, natural gas, nuclear, and wind) were aggregated using the EPA eGRID plant and generation data (EPA, 2020), as shown in Table 2.
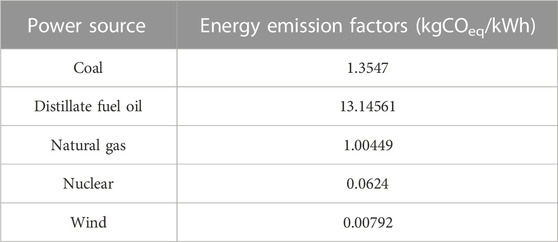
TABLE 2. Energy emission factors for fuel sources from eGRID (EPA, 2020).
Further indirect emissions are associated with the materials needed to construct the system,
where mv is the mass of new or virgin materials, mr is the mass of recycled materials, MMv is the emission factor associated with the virgin materials, and MMr is the emission factor for recycled materials and indirect emissions from refrigerant manufacturing and disposal,
where RFM is the refrigerant manufacturing emissions factor (kgCO2/kgref), and RFD is the refrigerant disposal emissions factor (kgCO2/kgref).
All materials used to construct the chiller were assumed to be virgin as a conservative estimate, with the emission factors for virgin and recycled materials (Hwang et al., 2015) provided in Table 3. Although emission factors for the materials are lower for 100% recycled materials, the impacts on the LCCP emissions are minimal. As the weight of the chiller was not reported in the data sheets, the weights of similar chillers were compared to obtain a chiller weight of approximately 2,600 kg (Techwell, 2022). Material percentages for the chiller were estimated as 10% steel, 55% aluminum, 30% copper, and 5% plastic (Wan et al., 2021); it should be noted that the final LCCP model was not sensitive to the material composition. Refrigerant manufacturing and disposal emissions for alternative refrigerants have not yet been reported for all alternatives; thus, the values for R134a manufacturing [i.e., 15.9 kgCO2eq/kgref (Wang et al., 2022)] and disposal [i.e., 5 kgCO2eq/kgref (Wan et al., 2021)] were used for all refrigerants.
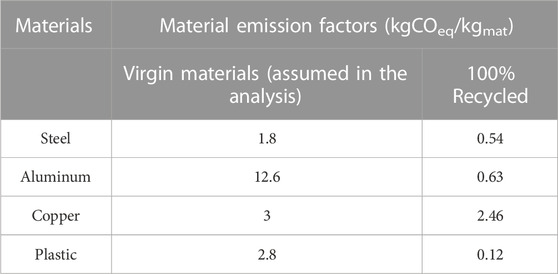
TABLE 3. Material manufacturing emission factors (Hwang et al., 2015).
3 Results and discussion
3.1 Annual energy consumption for constant cooling capacity
At a fixed capacity of 809 kW (230 RT), refrigerants with lower latent heats than R134a, such as R515A, R515B, R1234ze (E), and R513A, required higher refrigerant mass flow rates than R134a, thereby affecting compressor power (Figure 5). The resulting annual energy consumption was comparable between R134a and its alternatives (Table 4).
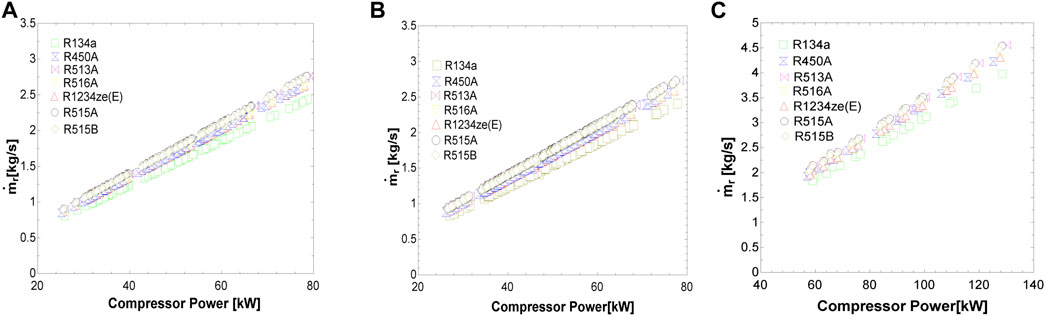
FIGURE 5. Refrigerant mass flow rate for different compressor power using (A,B) university campus and (C) Atlantic Fleet load profiles.
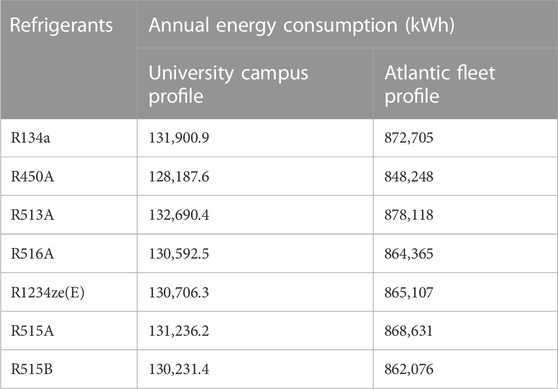
TABLE 4. Annual Energy Consumption for the university campus and Atlantic Fleet load profiles (Helmick, 1987).
3.2 LCCP results for the university campus and Atlantic Fleet load profiles
The LCCP analysis uses the average annual energy consumption computed from the compressor model, and calculations assume a 27-year lifetime, the median chiller life in an ASHRAE survey (Abramson et al., 2006). Leakage rates of 5% (annual) and 15% (end-of-life servicing) were based on Wan et al. (2021), although it is critical to note that the LCCP model is not sensitive to the leakage rate for industrial-scale chillers due to the sizable loads and hours of operations (i.e., the importance of indirect emissions to the total CO2eq emissions). For the university campus load profile, for all fossil fuel sources, over 90% equivalent carbon dioxide emissions are due to the energy required to run the chiller. For the Atlantic fleet profile, over 98% of emissions are from the indirect emissions from energy when powered by fossil fuels. When operating using fossil fuels, the global warming potential (GWP) of the refrigerant was not a significant contributor to the total CO2eq emissions, which is noteworthy as many regulations focus on the GWP of alternative refrigerants. The direct emissions (i.e., from the refrigerant’s GWP) are less than 10% for distillate fuel oil, natural gas, and coal using the university campus load profile. For the university campus profile, with low indirect energy emissions, leakage emissions dominate when powered by wind [R134a (86.96%), R450A (74.72%), R513A (74.54%), R516A (39.55%), R1234Aze (E) (0.64%), R515A (67.18%), R515B (60.45%)]—except for R1234ze (E) (0.64%) which has a very low GWP—and, thus, fluid’s GWP is important for operation with renewable energy. This indicates that the power source has the strongest impact on emissions (Figure 6), even stronger than the choice of refrigerant, which is significant due to the focus of some regulations on the fluid’s GWP. The Atlantic Fleet’s total emissions are higher overall compared to the campus building profile due to longer hours of operation. Renewable wind energy exhibited the lowest total emissions for both load profiles due to the very low emissions factor.
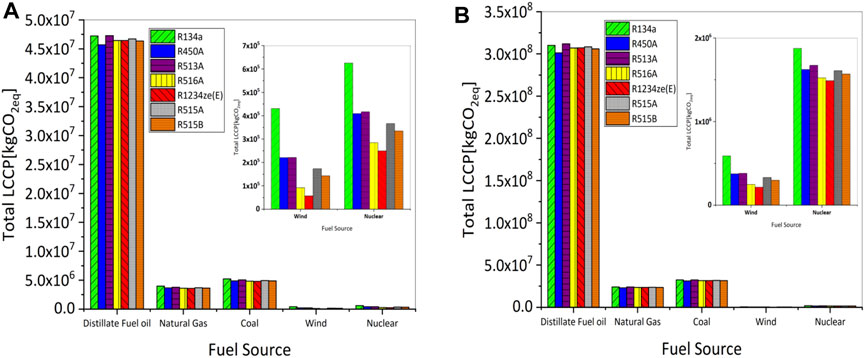
FIGURE 6. Total LCCP emissions for (A) university campus and (B) Atlantic Fleet load profiles.
With natural gas as a fuel source (Table 5), and using R134a emissions as a baseline, total LCCP emissions were reduced for R450A (7.81%), R513A (4.72%), R516A (9.39%), R1234ze (E) (10.20%), R515A (8.36%), and R515B (6.39%) for the university campus load profiles. For the Atlantic Fleet profile and using natural gas as a fuel source (Table 5), there were emission reductions for R450A (3.61%), R513A (0.25%), R516A (2.33%), R1234ze (E) (2.41%), R515A (1.54%) and R515B (2.37%) compared to R134a. The emissions reduction for the Atlantic Fleet profile was more modest compared to the university campus load profile due to the operating conditions: condenser exit temperature, T4, varied between 4°C and 30°C (Helmick, 1987); due to a lack of temperature distribution information, constant values of 10.56°C and 16.11°C for the evaporator exit, T1, and compressor inlet, T2, were used to compute the compressor power. Therefore, the annual energy consumption is nearly equal for all refrigerants, which in turn reduces the variation observed for the total emissions. R1234ze (E) had the highest emission reduction for the campus load profile and the second highest for the Atlantic ship due to its low GWP (1.37) and low suction vapor density. Among the A1 alternatives, R515B’s emission reduction of 8.36% and 2.37% for the campus building and Atlantic Fleet profile, respectively, was due to its low discharge temperature that reduced the compressor work.
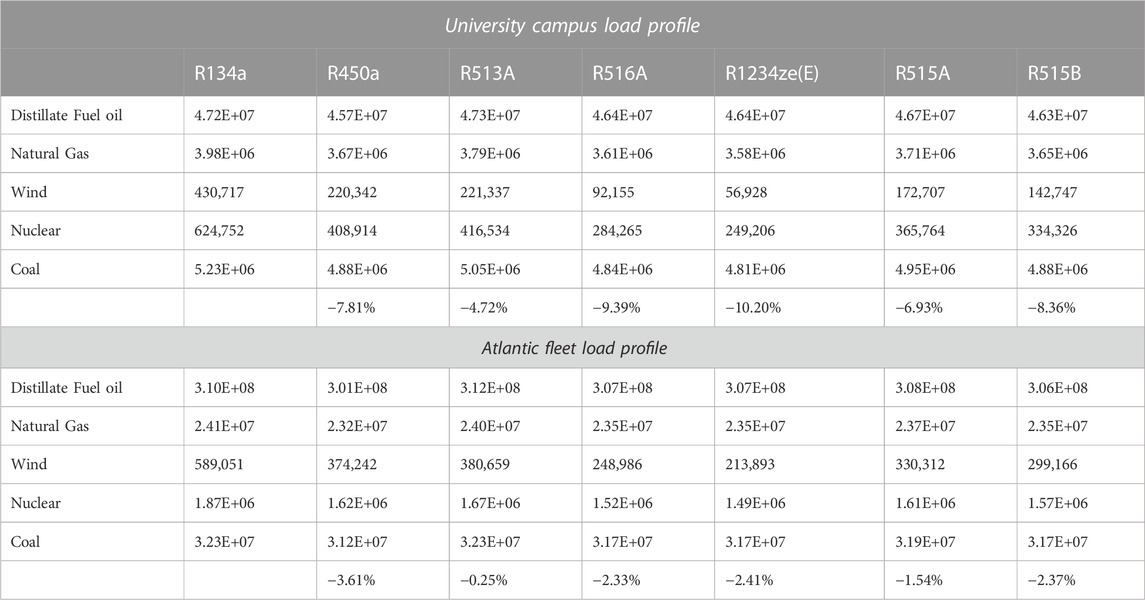
TABLE 5. Total emissions compared to R134a for the University campus load profile using natural gas as a fuel source.
3.3 The behavior of alternative refrigerants
The alternative refrigerants considered have lower GWPs compared to R134a, are medium pressure refrigerants, and their GWP relates to the emission contributions from refrigerant leakage. Apart from R1234ze (E), all the alternative refrigerants are blends of single-component HFCs (R134a, R32, and R152) and HFOs (R1234ze (E), R1234yf). Among the refrigerants considered, R1234ze (E) and R516A are the only A2Ls, while the others are A1, according to their ASHRAE safety designations. All refrigerants are non-azeotropic (i.e., they have constant boiling and condensing temperature at a particular pressure), except R450A and R516A, with temperature glides of 0.4 K and 0.056 K, respectively. Temperature glides can impact heat exchanger designs; temperature glide of HFC mixtures may increase COP in a counterflow heat exchanger (Li et al., 2002). In terms of material compatibility, R450A, R515B, R513A, and R1234ze (E), and R134a are compatible with commonly used materials except acrylic and kalrez6375 (Honeywell, 2021; Mota-Babiloni et al., 2016) and they typically use polyolester oil as the lubricant. R515B can be used in all equipment designed for R1234ze (E) (Mateu-Royo et al., 2021), but there may be difficulties replacing R134a without changing the operating conditions of the components. All refrigerants considered have relatively low boiling points at ambient temperature (Table 6). Table 6 gives a comprehensive list of the different alternative refrigerants and their properties at the average evaporation temperature of 5.42°C. As temperature increases in the evaporator, there is an increase in the vapor densities of the refrigerants, hence increasing compressor capacity. R513A has the highest vapor density of 20.76 kg/m3; compared to R134a, there is an increase in compressor power (Table 7). At the evaporation temperature, R134a has the highest latent heat, and thus the lowest mass flow rate of the fluids (Figure 5).
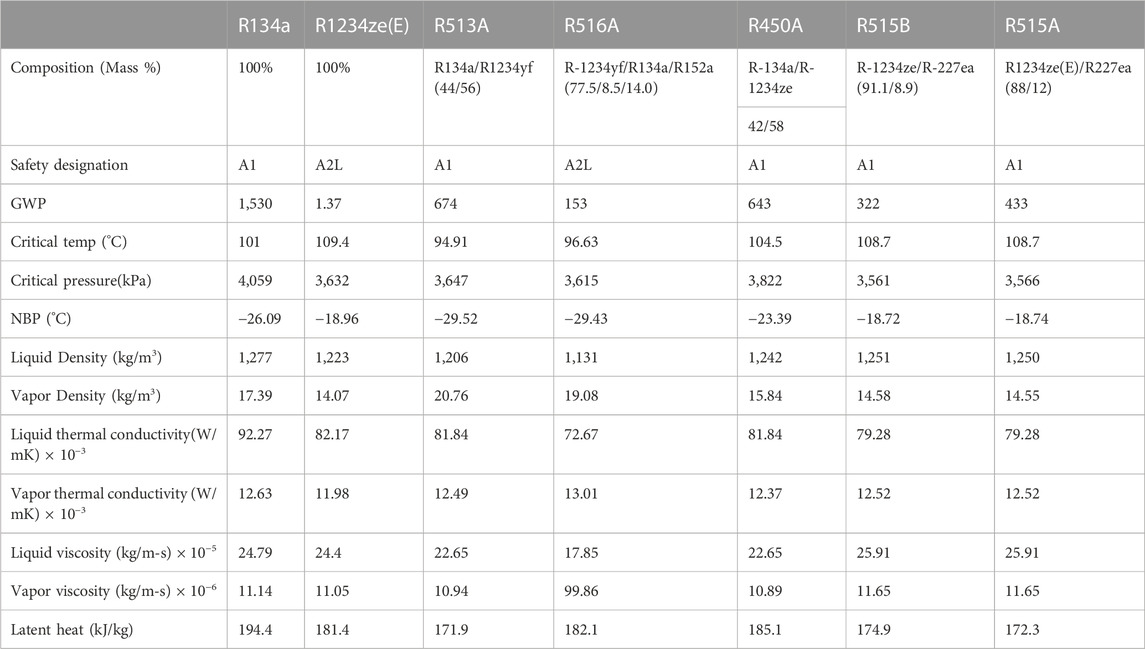
TABLE 6. Thermodynamic properties of R134a and its alternatives at the evaporator temperature; thermodynamic properties from Engineering Equation Solver at 5.42°C, compositions and safety designations from ASHRAE (ASHRAE, 2019), and GWP values from IPCC AR6 (Smith et al., 2021).
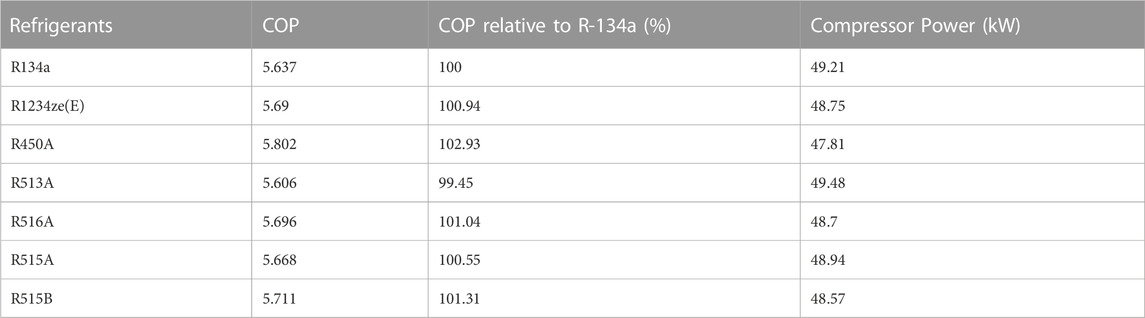
TABLE 7. COP and compressor power comparison for all refrigerants using the university campus load profile.
3.4 Sensitivity analysis for COP
A sensitivity analysis was performed to observe how changing key refrigerant parameters affected the COP of the system. Changing the value of evaporator outlet temperature, T1, at a particular condenser subcooler outlet temperature, T4, has a negligible change on the COP (Figure 7). With a constant subcooler outlet temperature, T4, and varying evaporator outlet temperature, T1, by 0.94°C, the refrigeration capacity reduces, and the compressor power increases, which reduces the COP, but these resulting changes in COP are minimal. The university campus chiller data indicates that over a range of weather conditions, operating temperatures have low variance; chilled water temperature standard deviations are less than ±1°C, and cooling water temperature standard deviations are less than ± 3°C (Table 1). Additionally, as subcooler outlet temperature increases from 16°C to 28°C, the condenser temperature is increased by a constant subcooling temperature (5.56°C). As the condenser temperature increases, the ability of the condenser to remove heat reduces, which increases the compressor power (Al-Hassani and Al-Badri, 2021). Decreasing the subcooler outlet temperature reduces the condenser refrigerant pressure, thereby reducing the work done by the compressor. Using the university campus data, the increase almost cancels out; thus, there was no sharp drop in COP (Figure 7). Results of compressor power based on condenser outlet temperature are plotted in Figure 8. There are minimal differences between alternative refrigerants.
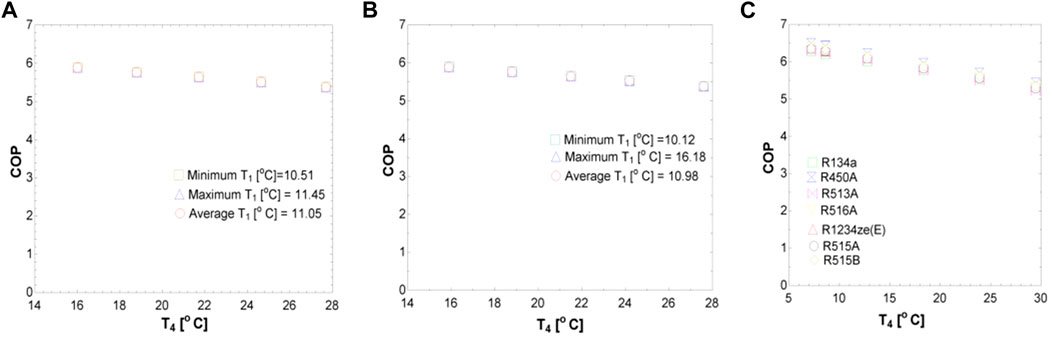
FIGURE 7. Sensitivity analysis for changing evaporator outlet values at constant condenser sub cooler outlet temperature, for the university campus, (A) Chiller 1 and (B) Chiller 2, and (C) Atlantic Fleet load profile.
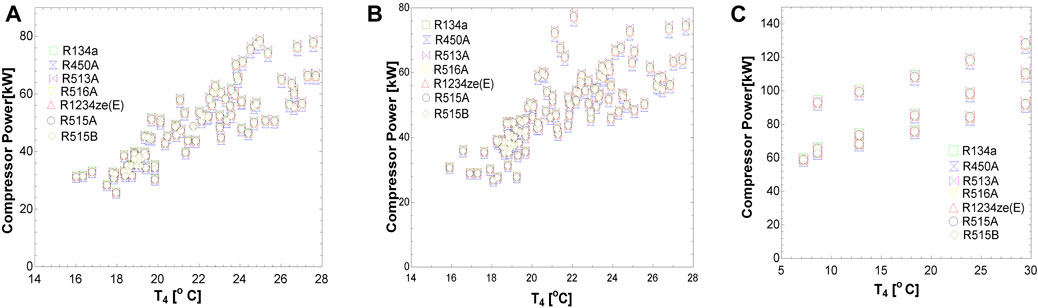
FIGURE 8. Compressor power for all refrigerants for different values of subcooler outlet temperature, for the university campus, (A) Chiller 1 (B) Chiller 2, and (C) Atlantic Fleet profiles.
3.5 Impacts of GWP on leakage emissions
Leakage emissions increase linearly based on the annual leak rate but do not depend on power source or runtime (Figure 9); hermetically-sealed systems can decrease the direct CO2eq emissions from chiller operation. Energy emissions are linear with percentage of runtime for the two load profiles (Figures 9, 10) and are approximately an order of magnitude higher than leakage emissions using natural gas as a fuel source. Utilizing renewable or low-carbon energy, reducing the chiller operating time when it is not needed, and using variable frequency drive compressors and controls for partial loads are approaches to reduce the dominant source of emissions (i.e., the indirect emissions associated with energy to run the chiller). Increasing the chilled water temperature increases the suction pressure, Ps, which reduces the pressure ratio and the work done by the compressor to attain the discharge pressure. The LCCP model is not very sensitive to one-time emissions (e.g., refrigerant manufacturing and disposal, and emissions associated with building the material), partly because these contributions to the lifetime emissions are small compared to yearly emissions.
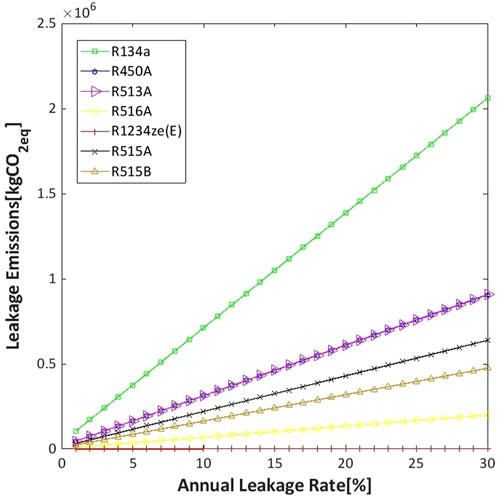
FIGURE 9. Impacts of annual leakage rate on leakage emissions; leakage emissions are affected by the fluid’s GWP.
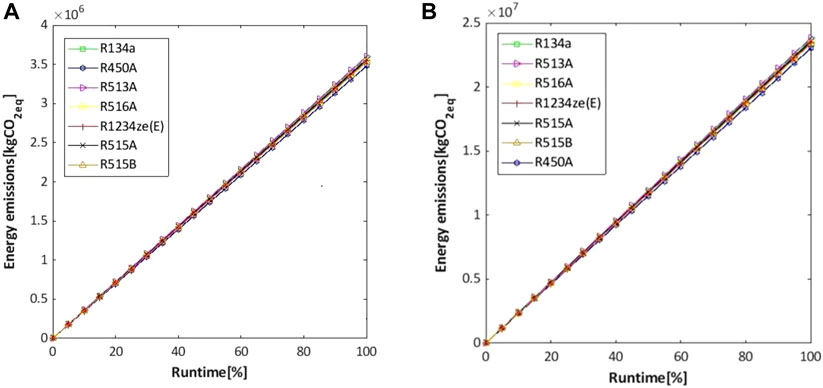
FIGURE 10. Energy emissions for the (A) university campus and (B) Atlantic Fleet load profiles using natural gas as the energy source.
3.6 Heat exchanger comparison of alternative refrigerants
Due to the different properties of alternative refrigerants and concerns about capacities, condenser and evaporator bundle models provided in the Supplementary Material were used to estimate changes in area with alternative refrigerants with equivalent cooling capacity,
4 Conclusion
A thermodynamic model and life cycle climate performance analysis were conducted for an 809 kW (230RT) water-cooled centrifugal chiller using two operating profiles—a university campus and the Atlantic Fleet ship load profiles (Helmick, 1987)—with R134a and its alternative refrigerants R1234ze(E), R450A, R513A, R516A, R515, and R515B for a 27-year lifetime. A constant nameplate capacity of 230RT (808.9 kW) was modeled for all refrigerants using coal, distillate fuel oil, natural gas, nuclear, and wind as power sources. Data from the university chillers is provided and, despite seasonal temperature differences, chilled water temperatures were often within ± 1°C and cooling water temperatures were often within ± 3°C. A sensitivity analysis demonstrated that changes in subcooler outlet temperature, while keeping evaporator outlet temperature constant, do not substantially change the COP. Each refrigerant was set to produce the same cooling capacity as R134a, which increased refrigerant mass flow rate and compressor work for all alternative refrigerants and load profiles, with R134a having the lowest mass flow rate and R515A the highest refrigerant mass flow rate.
Regarding the LCCP, for the university campus load profile, for fossil fuels, over 90% of the lifetime CO2eq emissions are due to indirect emissions (i.e., power to run the chiller). The direct emissions (i.e., from the refrigerant’s GWP) are less than 10% of the total lifetime emissions for distillate fuel oil, natural gas and coal using the university campus load profile. For the university campus profile, leakage emissions dominate when powered by wind [R134a (86.96%), R450A (74.72%), R513A (74.54%), R516A (39.55%), R1234ze (E) (0.64%), R515A (67.18%), R515B (60.45%)], except for R1234ze (E) (0.64%). Thus, the working fluid’s GWP is more important when powering a chiller with renewable energy.
In terms of total emissions, for a natural gas fuel source, there are modest emission reductions for all alternative refrigerants for the university campus load profile. R1234ze (E) has the highest reductions with 10.20% and R513A the lowest of 4.72%. For the Atlantic Fleet profile, R450A has the highest reduction of 3.61% with R513A the lowest reduction of 0.25%, compared to R134a. In general, reductions in total emissions were comparable for alternative refrigerants; no alternative refrigerant is a one-size-fit-all in terms of high latent heat, flammability, low GWP, availability, ability as a drop-in replacement, materials compatibility, and performance.
Engineers and designers may take a more holistic view of carbon dioxide emissions and consider LCCP emissions in their designs, in addition to the global warming potential of the working fluid. Due to the significant contributions of indirect energy emissions (i.e., >90%) to the total life cycle emissions when powered via fossil fuels, opportunities for future work may involve reducing the indirect emissions due to energy. Other opportunities for reducing emissions include system modifications (e.g., variable speed drives), reducing demand, incorporating lower-carbon power sources, and carbon capture systems (Rahbari et al., 2023).
Data availability statement
The original contributions presented in the study are included in the article/Supplementary Material, further inquiries can be directed to the corresponding author.
Author contributions
MA: Formal Analysis, Investigation, Writing–original draft. CH: Formal Analysis, Investigation, Writing–original draft. ES-C: Conceptualization, Formal Analysis, Investigation, Writing–review and editing. JM: Conceptualization, Methodology, Writing–review and editing. MD: Conceptualization, Funding acquisition, Supervision, Writing–review and editing.
Funding
The author(s) declare financial support was received for the research, authorship, and/or publication of this article. The work was supported by the Office for Naval Research (project N00014-22-1-2328).
Acknowledgments
The authors gratefully acknowledge and thank the KSU Facilities staff for their partnership and sharing of chiller operating data, particularly Tim Brunner.
Conflict of interest
The authors declare that the research was conducted in the absence of any commercial or financial relationships that could be construed as a potential conflict of interest.
Publisher’s note
All claims expressed in this article are solely those of the authors and do not necessarily represent those of their affiliated organizations, or those of the publisher, the editors and the reviewers. Any product that may be evaluated in this article, or claim that may be made by its manufacturer, is not guaranteed or endorsed by the publisher.
Supplementary material
The Supplementary Material for this article can be found online at: https://www.frontiersin.org/articles/10.3389/fenrg.2023.1293993/full#supplementary-material
References
Abramson, B., Wong, L.-S., and Herman, D. L. (2006). Service life data from an interactive web-based owning and operating cost database. ASHRAE Trans. 112.
Al-Hassani, A. H., and Al-Badri, A. R. (2021). Effects of evaporator and condenser temperatures on the performance of a chiller system with a variable speed compressor. Eng. Technol. J. 39, 45–55. doi:10.30684/etj.v39i1a.1647
Amrane, K. (2015). Participants handbook: ARHI low-GWP alternative refrigerants evaluation program (Low-GWP AREP).
Andersen, S. (1999). The implications to the Montreal Protocol of the inclusion of HFCs and PFCs in the kyoto Protocol. Report of the TEAP HFC and PFC Task Force.
Brown, J. S., Zilio, C., Brignoli, R., and Cavallini, A. (2014). Thermophysical properties and heat transfer and pressure drop performance potentials of hydrofluoro-olefins, hydrochlorofluoro-olefins, and their blends. HVAC&R Res. 20, 203–220. doi:10.1080/10789669.2013.854146
Dai, B., Qi, H., Liu, S., Zhong, Z., Li, H., Song, M., et al. (2019). Environmental and economical analyses of transcritical CO2 heat pump combined with direct dedicated mechanical subcooling (DMS) for space heating in China. Energy Convers. Manag. 198, 111317. doi:10.1016/j.enconman.2019.01.119
Dai, B., Wang, Q., Liu, S., Wang, D., Yu, L., Li, X., et al. (2023). Novel configuration of dual-temperature condensation and dual-temperature evaporation high-temperature heat pump system: carbon footprint, energy consumption, and financial assessment. Energy Convers. Manag. 292, 117360. doi:10.1016/j.enconman.2023.117360
Epa (2020). United States environmental protection agency:emission and generation resource integrated database(eGRID). Available: https://www.epa.gov/egrid (Accessed September 8, 2022).
Heath, E. A. (2017). Amendment to the Montreal protocol on substances that deplete the ozone layer (Kigali amendment). Int. Leg. Mater. 56, 193–205. doi:10.1017/ilm.2016.2
Helmick, R. L., Unkel, B. G., Cromis, R. A., and Hershey, A. L. (1987). Devel opment of an advanced air conditioning plant for DDG-51 class ships. Nav. Eng. J. 99, 112–123. doi:10.1111/j.1559-3584.1987.tb02123.x
Heredia-Aricapa, Y., Belman-Flores, J., Mota-Babiloni, A., Serrano-Arellano, J., and García-Pabón, J. J. (2020). Overview of low GWP mixtures for the replacement of HFC refrigerants: R134a, R404A and R410A. Int. J. Refrig. 111, 113–123. doi:10.1016/j.ijrefrig.2019.11.012
Honeywell, S. (2021). N13 (R-450A). (DoA: 2021). URLhttps://www.honeywellrefrigerants.com/europe/wp-content/uploads/2015/03/Solstice.
Hwang, Y., Ferreira, C., and Piao, C. (2015). Guideline for life cycle climate performance. Paris: International Institute of Refrigeration.
Jacob, T. A., Matty, E. P., and Fronk, B. M. (2019). Experimental investigation of in-tube condensation of low GWP refrigerant R450A using a fiber optic distributed temperature sensor. Int. J. Refrig. 103, 274–286. doi:10.1016/j.ijrefrig.2019.04.021
KSU (2015). Chilled water plant and Distribution project. Available: https://www.k-state.edu/facilities/projects/projects/chilledwater/ [Accessed 8/29/2023].
Lee, H., Troch, S., Hwang, Y., and Radermacher, R. (2016). LCCP evaluation on various vapor compression cycle options and low GWP refrigerants. Int. J. Refrig. 70, 128–137. doi:10.1016/j.ijrefrig.2016.07.003
Li, G. (2015). Comprehensive investigations of life cycle climate performance of packaged air source heat pumps for residential application. Renew. Sustain. Energy Rev. 43, 702–710. doi:10.1016/j.rser.2014.11.078
Li, G. (2021). Performance evaluation of low global warming potential working fluids as R134a alternatives for two-stage centrifugal chiller applications. Korean J. Chem. Eng. 38, 1438–1451. doi:10.1007/s11814-021-0785-5
Li, T., Guo, K., and Wang, R. (2002). High temperature hot water heat pump with non-azeotropic refrigerant mixture HCFC-22/HCFC-141b. Energy Convers. Manag. 43, 2033–2040. doi:10.1016/s0196-8904(01)00150-9
Makhnatch, P., and Khodabandeh, R. (2014). The role of environmental metrics (GWP, TEWI, LCCP) in the selection of low GWP refrigerant. Energy Procedia 61, 2460–2463. doi:10.1016/j.egypro.2014.12.023
Mateu-Royo, C., Mota-Babiloni, A., Navarro-Esbrí, J., and Barragán-Cervera, Á. (2021). Comparative analysis of HFO-1234ze (E) and R-515B as low GWP alternatives to HFC-134a in moderately high temperature heat pumps. Int. J. Refrig. 124, 197–206. doi:10.1016/j.ijrefrig.2020.12.023
Morrow, J. A., and Derby, M. M. (2022). Flow condensation heat transfer and pressure drop of R134a alternative refrigerants R513A and R450A in 0.95-mm diameter minichannels. Int. J. Heat Mass Transf. 192, 122894. doi:10.1016/j.ijheatmasstransfer.2022.122894
Mota-Babiloni, A., Barbosa, J. R., Makhnatch, P., and Lozano, J. A. (2020). Assessment of the utilization of equivalent warming impact metrics in refrigeration, air conditioning and heat pump systems. Renew. Sustain. Energy Rev. 129, 109929. doi:10.1016/j.rser.2020.109929
Mota-Babiloni, A., Navarro-Esbrí, J., Molés, F., Cervera, Á. B., Peris, B., and Verdú, G. (2016). A review of refrigerant R1234ze (E) recent investigations. Appl. Therm. Eng. 95, 211–222. doi:10.1016/j.applthermaleng.2015.09.055
Nair, V. (2021). HFO refrigerants: a review of present status and future prospects. Int. J. Refrig. 122, 156–170. doi:10.1016/j.ijrefrig.2020.10.039
Poggi, F., Macchi-Tejeda, H., Leducq, D., and Bontemps, A. (2008). Refrigerant charge in refrigerating systems and strategies of charge reduction. Int. J. Refrig. 31, 353–370. doi:10.1016/j.ijrefrig.2007.05.014
Rahbari, H. R., Mandø, M., and Arabkoohsar, A. (2023). A review study of various High-Temperature thermodynamic cycles for multigeneration applications. Sustain. Energy Technol. Assessments 57, 103286. doi:10.1016/j.seta.2023.103286
Schultz, K., and Kujak, S. (2013). “System drop-in tests of R134a alternative refrigerants (ARM-42a, N-13a, N-13b, R-1234ze (E), and OpteonTM XP10) in a 230-RT water-cooled water chiller,” in Air-conditioning, heating, and refrigeration Institute (AHRI) low-GWP alternative refrigerants evaluation Program (Low-GWP AREP).
Schultz, K., Kujak, S., and Majurin, J. (2016). “Refrigerant R513A as a replacement for R134a in chillers,” in ASHRAE winter conference.
Smith, C., Nicholls, Z. R., Armour, K., Collins, W., Forster, P., Meinshausen, M., et al. (2021). The earth’s energy budget, climate feedbacks, and climate sensitivity supplementary material. Clim. change, 1850–2005.
Techwell (2022). Water-cooled screw chillers. Available: https://techwellhvac.com/optin/ (Accessed September 8, 2022).
UN (2023). The Paris Agreement [Online]. Available: https://unfccc.int/process-and-meetings/the-paris-agreement (Accessed August 11, 2023).
Wan, H., Cao, T., Hwang, Y., Radermacher, R., Andersen, S. O., and Chin, S. (2021). A comprehensive review of life cycle climate performance (LCCP) for air conditioning systems. Int. J. Refrig. 130, 187–198. doi:10.1016/j.ijrefrig.2021.06.026
Wang, H., Wang, Y., Mi, H., Zang, J., and Wang, S. (2022). Analysis of carbon emission energy inventory from refrigerant production and recycling carbon compensation. Appl. Sci. 12, 1. doi:10.3390/app12010001
Whitehouse (2021). Fact sheet: president biden sets 2030 greenhouse gas pollution reduction target aimed at creating good-paying union jobs and securing US leadership on clean energy technologies.
Yang, C., Seo, S., Takata, N., Thu, K., and Miyazaki, T. (2021). The life cycle climate performance evaluation of low-GWP refrigerants for domestic heat pumps. Int. J. Refrig. 121, 33–42. doi:10.1016/j.ijrefrig.2020.09.020
Yi, K., Zhao, Y., Liu, G., Yang, Q., Yu, G., and Li, L. (2022). Performance evaluation of centrifugal refrigeration compressor using R1234yf and R1234ze(E) as drop-in replacements for R134a refrigerant. Energies 15, 2552. doi:10.3390/en15072552
Yu, F. W., and Chan, K. T. (2007). Part load performance of air-cooled centrifugal chillers with variable speed condenser fan control. Build. Environ. 42, 3816–3829. doi:10.1016/j.buildenv.2006.11.029
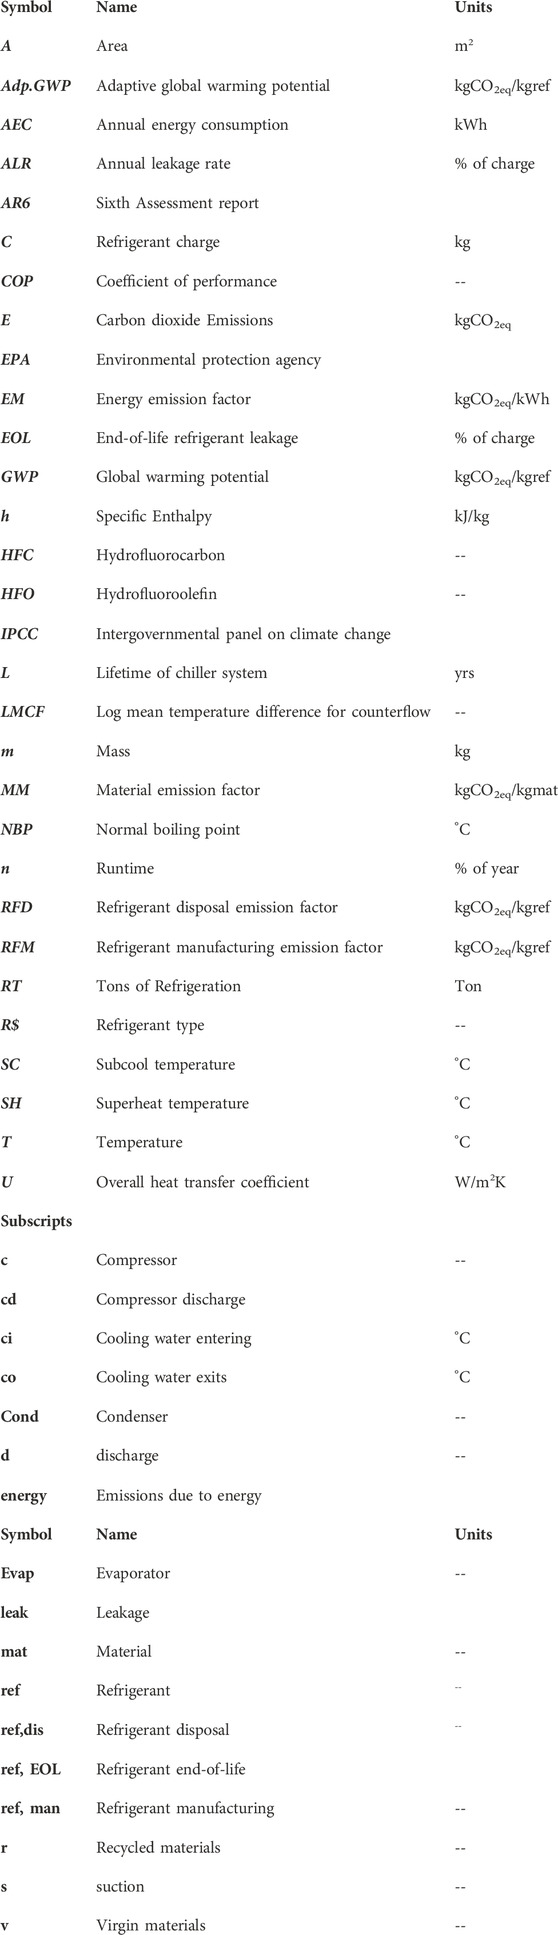
Nomenclature
Keywords: carbon footprint, low GWP, climate change, alternative refrigerants, renewable energy, HVAC&R
Citation: Akinseloyin MO, Hall C, Stallbaumer-Cyr EM, Morrow JA and Derby MM (2023) Analyzing the carbon dioxide emissions of R134a alternatives in water-cooled centrifugal chillers using the life cycle climate performance framework. Front. Energy Res. 11:1293993. doi: 10.3389/fenrg.2023.1293993
Received: 14 September 2023; Accepted: 15 November 2023;
Published: 06 December 2023.
Edited by:
Bin Hu, Shanghai Jiao Tong University, ChinaReviewed by:
Hamid Reza Rahbari, Aalborg University, DenmarkBaomin Dai, Tianjin University of Commerce, China
Copyright © 2023 Akinseloyin, Hall, Stallbaumer-Cyr, Morrow and Derby. This is an open-access article distributed under the terms of the Creative Commons Attribution License (CC BY). The use, distribution or reproduction in other forums is permitted, provided the original author(s) and the copyright owner(s) are credited and that the original publication in this journal is cited, in accordance with accepted academic practice. No use, distribution or reproduction is permitted which does not comply with these terms.
*Correspondence: Melanie M. Derby, ZGVyYnltQGtzdS5lZHU=