 Jingli Li1*
 Yichen Yao
 Yuan Zhao
 Zhongwen Li
94% of researchers rate our articles as excellent or good
Learn more about the work of our research integrity team to safeguard the quality of each article we publish.
Find out more
ORIGINAL RESEARCH article
Front. Energy Res. , 09 November 2023
Sec. Sustainable Energy Systems
Volume 11 - 2023 | https://doi.org/10.3389/fenrg.2023.1292899
This article is part of the Research Topic Evolutionary Computation for Smart Grid and Sustainable Energy Systems View all 5 articles
Conducting research on cluster control strategies for distributed photovoltaic systems to address voltage fluctuations and reverse power flow caused by large-scale distributed photovoltaic integration is crucial foundational work in establishing a new power system and ensuring its safe and stable operation. Based on the division of distributed photovoltaic cluster, this paper takes distributed photovoltaic cluster as the intermediate layer of control, and researches the two-layer control strategy of inter-cluster coordination and intra-cluster autonomy. The inter-cluster coordination strategy is located at the upper layer, and this strategy based on the power grid structure of the controlled area, comprehensively considering the observability, controllability, degree and betweenness centrality of each node, the latter two characterize the spatial location of the nodes. The dominant nodes of each cluster are selected by the above multiple indicators. The multi-objective inter-cluster coordination control model respectively focusing on the minimum voltage deviation of the dominant node or the minimum network loss of the system is constructed according to whether the voltage of the dominant node crosses the limit or not, and the improved particle swarm-gray wolf coupling algorithm (PSO-GWO) is used to generate the output indicators of each cluster. The intra-cluster autonomy strategy is at the lower layer. In the shortage of adjustable PV resources connected to the dominant node, the intra-cluster autonomy strategy adopting the control sequence of dominant node-downstream node-upstream node to distribute the output indicators of inter-cluster coordination within the cluster; In addition, in view of the situation that the cluster cannot receive the output indicators due to communication failure, The intra-cluster autonomy control model is constructed with the goal of minimum voltage deviation and minimum network loss of the dominant node in the cluster. The distributed photovoltaic inter-cluster coordination + intra-cluster autonomy two-layer regulation strategy is used to simulate the improved IEEE33-nodes system under multiple scenarios. The results show that the proposed control strategy can effectively solve the voltage overlimit, power flow back and other problems, and play an important role in ensuring the safe and economic operation of the system.
Driven by the dual-carbon strategy, China’s new power system construction process is continuously deepening, and the scale of distributed photovoltaic grid integration is rapidly expanding. Due to the strong randomness and intermittency of distributed photovoltaics themselves, and often being connected to low-voltage distribution networks in a highly dispersed manner (Qian and Haiyun, 2023), it has exacerbated the phenomena of power flow reversal and voltage fluctuations in distribution networks. However, traditional centralized control is unable to address the massive communication data issues caused by the sharp increase in the number of controlled entities (Wei et al., 2013). Researching efficient control methods for distributed photovoltaics is a fundamental undertaking to ensure the safe and reliable operation of the new distribution network.
In recent years, with the continuous development of distributed photovoltaic grid-connected technology, domestic and foreign scholars have conducted extensive research on the control strategies of distributed photovoltaics in response to the above-mentioned issues. As early as 2009, scholars from the international community emphasized the significant role of photovoltaic inverters in voltage control. They compared two voltage control methods: active power limitation and reactive power support by photovoltaic inverters, indicating that both strategies should be used in conjunction to fully exploit the voltage control capability of photovoltaic inverters. They also anticipate the emergence of more intelligent photovoltaic regulation methods in the future (Demirok et al., 2009). Currently, fundamentally speaking, the content of distributed photovoltaic regulation still combines the reasonable reduction of active power and the full utilization of reactive power regulation capability. However, various regulatory strategies have emerged in form, leading to continuous improvement in regulation effectiveness. Among them, voltage and reactive power control based on clusters represent an important direction, encompassing reactive power partitioning, dominant node selection, and regulation strategies. Regarding reactive power partitioning and dominant node selection in distribution networks, reference (Ze and Yunning, 2020) applied an electrical distance-based agglomerative hierarchical clustering algorithm to partition the distribution network, subsequently constructed a multi-objective function-based dominant node selection model, and the particle swarm algorithm based on the relative dominance strategy is adopted for solving. In reference (Wei et al., 2017), both the controllability of power sources to nodes and nodes to loads and their influence on other areas are taken into account to construct the dominant node selection model. The genetic algorithm based on the relative dominance strategy is employed for solving. Additionally, they propose the control space of dominant nodes and use the K-means clustering algorithm to partition the distribution network. Both references have validated the reliability of the partitioning results and dominant node selection through simulations. However, the evaluation criteria solely consider the size of the objective function and do not consider the impact of changes in distribution network structure resulting from the multi-point grid connection of distributed photovoltaics. In distributed photovoltaic control strategies, reference (Hongmin et al., 2019) first acquires the voltage sensitivity matrix by calculation. Based on this sensitivity matrix, reactive power adjustments of distributed photovoltaics are allocated in the distribution network. This is then supplemented by appropriate active power reduction to enhance grid integration characteristics. Reference (Peng et al., 2016) proposes a hierarchical multi-mode reactive power control strategy for distributed photovoltaic clusters, comprising an executive layer and an intelligent control layer. Two control modes are designed, with the intelligent control layer utilizing a fuzzy controller to adjust the reactive power curve under the respective mode. The executive layer then outputs the corresponding reactive power based on the reactive power curve, this method makes full use of the bidirectional reactive power regulation capability of photovoltaic inverters. Both references primarily focus on the optimization of distributed photovoltaic control within specific regions, overlooking the coordinated operation and global planning functions among different clusters.
To effectively address the aforementioned issues, this paper considers the characteristics of distributed photovoltaic grid integration based on cluster partitioning. In the selection criteria for dominant nodes, two factors, namely, node structural characteristics and positional information, are integrated to optimize the dominant node selection method, ensuring that the chosen dominant nodes effectively reflect the each cluster’s voltage levels in numerous distributed photovoltaic integration. Based on the voltage levels of dominant nodes in each cluster, the inter-cluster coordinated optimization model and the intra-cluster autonomous optimization model are constructed to regulate reactive power output from distributed photovoltaics using an improved particle swarm optimization-grey wolf coupling algorithm. The application of this dual-layer cluster control strategy based on the improved particle swarm optimization-grey wolf coupling algorithm to the improved IEEE 33-node system demonstrates that the control results can reduce node voltage deviations and system power losses, effectively enhance system security and economic performance in various scenarios.
Household distributed photovoltaics are connected to the grid in the form of inverters, which brings about challenges of handling massive communication data and numerous controlled entities, making centralized control difficult. Additionally, the inverters themselves serve as reactive power sources, providing the connected photovoltaic systems with a significant amount of reactive power reserve. In the 1970s, Electricité de France (EDF) proposed a voltage hierarchical control scheme based on “dominant nodes” and “control zones" (Bifeng, 2006). This scheme employs cluster division to spatially decouple the distribution network, allowing each cluster to fully utilize its own reactive power resources for on-site reactive power balance. It can effectively utilize the reactive power reserve of distributed photovoltaic inverters to achieve efficient voltage regulation in large-scale photovoltaic grid integration. The division of distribution network clusters and the selection of cluster-dominant nodes are the main tasks of the voltage hierarchical control scheme.
Cluster division of distribution networks should adhere to the following principles (Lin et al., 2017).
(1) Clusters should be approximately decoupled from each other, with minimal mutual influence, and control measures for neighboring clusters have limited impact on the cluster in question;
(2) Each cluster should possess sufficient voltage reactive power reserves to maintain its own voltage level.
For a given distribution network’s cluster division, the first step involves constructing an optimization model for cluster division using electrical distance as an indicator of node coupling degree. An improved particle swarm optimization algorithm is employed for finding the optimum and solution. The specific implementation process is illustrated in Figure 1.

FIGURE 1. Flowchart of cluster partitioning.
The dominant node is a crucial node within the cluster. In monitoring perspective, the voltage level of the dominant node can represent the cluster’s voltage level. In control perspective, efficient control of the cluster’s voltage can be achieved by regulating the voltage of the dominant node. Selecting dominant nodes can effectively reduce the difficulty of observing the voltage states of each cluster, which is especially applicable in the context of insufficient measurement resources in distribution networks. The criteria for selecting dominant nodes include observability and controllability indicators (Fei et al., 2011), which are derived from the elements of the sensitivity matrix. First, the decoupling of active and reactive power is performed based on the Jacobian matrix in the Newton-Raphson power flow calculation method:
In the equation,
In the equations,
In the equation,
In the equation,
Similarly, according to equation (3), formulas for reactive power voltage sensitivity and controllability indicators can be derived as follows:
The reactive voltage sensitivity in equation (6) is directly derived from equation (3). In equation (7),
After obtaining the observability and controllability indices for each node in the cluster, and considering their values differ by nearly one order of magnitude (Xiaoyu et al., 2019), normalization is performed first, followed by weighted summation:
In the equation,
The number of dominant nodes generally does not exceed the number of clusters participating in the regulation system, so the number of dominant nodes in each cluster is set to 1, and the node with the largest comprehensive indicator value becomes the dominant node of the cluster.
Considering the impact of a large number of distributed photovoltaic access on the distribution network, distributed photovoltaics are mostly connected to the terminal nodes of feeders to raise the end voltage level (Chang et al., 2022). In large-scale distributed power grid systems, the dominant nodes selected based on observability and controllability criteria are often connected to reactive power source nodes (Jianfang et al., 2017). This facilitates efficient regulation of voltage levels in dominant nodes, but the observability of such nodes is generally poor. Therefore, introducing the node degree value and node betweenness centrality from complex network theory can represent the structural characteristics and positional information of each node, optimizing the selection of dominant nodes.
In the equation, E represents the set of connecting lines between nodes in cluster m to which node k belongs; when the connecting line l is associated with node k, the symbol
After adding the node degree value and node betweenness centrality, the improved expression for the comprehensive selection criterion is as follows:
In equation (10), the node degree value and node betweenness centrality replace the observability and controllability weights in equation (8), avoiding the consideration and arrangement of weighting sizes, and enhancing the influence of node structure and spatial position on the selection of dominant nodes.
Inter-cluster coordination strategies activate different control modes based on the overvoltage conditions of dominant nodes. The improved particle swarm-grey wolf coupling algorithm is used to optimize the calculation of reactive power output indicators for each cluster, which are then distributed to the respective clusters.
The inter-cluster coordination strategy is based on the control objectives of minimizing the voltage deviation of the dominant node of each cluster and minimizing the system network loss:
In the equation, J represents the number of dominant nodes;
The weighted sum of the two objective functions is the comprehensive inter-cluster coordination objective function:
In the equation,
The inter-cluster coordination strategy constraints include three types: power flow constraints, cluster power constraints, and operational safety constraints.
Power flow constraints refer to the equality constraints that must be followed in system power flow calculations, which can be expressed as (Tao et al., 2021):
In the equation, Ui and Uj represent the node voltages of nodes i and j respectively; iij represents the branch current from node i to node j; Pij and Qij represent the active and reactive power flowing through branch i-j; rij and xij represent the resistance and reactance of branch i-j respectively; Pj and Qj represent the net active and reactive loads injected at node j; jl represents the set of branches connected to node j with node l as the endpoint; Pjl and Qjl represent the active and reactive power flowing through branch j-l.
In the equation,
In the equation,
Particle Swarm Optimization (PSO) is a type of swarm intelligence optimization algorithm. This algorithm is derived from the study of bird preying behavior, and its basic idea is to find the optimal solution through the cooperation and information sharing among individuals in a group. First, define a particle population where each particle has two multidimensional features: velocity and position. After the population is generated, the particle swarm starts iterative updates. The update direction of each particle is determined by two factors: the global optimal objective function value of the entire particle swarm and the historical optimal objective function value of the particle itself. Assign corresponding weights to particles for iterative updates in these two directions, so that the entire population can search for the optimal value through continuous iterations. The iterative update formula for PSO algorithm is as follows:
In the equations,
In the classical PSO algorithm, the inertia weight
In the equation, the inertia weight
To compare the optimization performance between constant inertia weight and dynamic inertia weight PSO algorithms, we set constant inertia weights as 0.4, 0.6, and 0.8, and the dynamic inertia weight varies within the range of [0.4, 0.8] according to equation (18). The aforementioned inter-group coordination optimization model is optimized using these settings, and the iteration process is shown in Figure 2. From the figure, it can be observed that when using constant inertia weight PSO algorithm, the better the objective function value found as the inertia weight increases, gradually exhibiting saturation characteristics, and the optimal objective function value is obtained when the constant inertia weight is 0.8. On the other hand, the dynamic inertia weight PSO algorithm can search for the optimal value of the objective function while having higher optimization speed and stability.
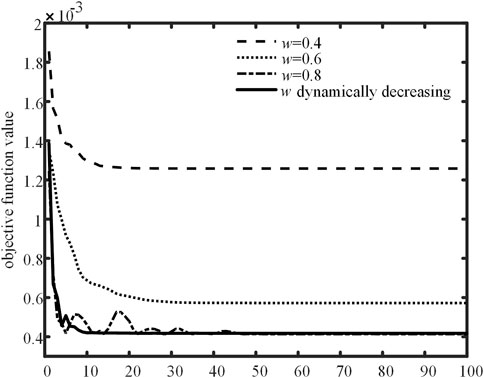
FIGURE 2. Iterative process of inertial weight PSO algorithm.
Grey Wolf Optimization (GWO) is a swarm intelligence optimization algorithm that simulates the hunting behavior of grey wolves. The fundamental concept involves forming a wolf pack, organized into a strict four-tier social hierarchy. The first three tiers consist of leadership wolves, usually limited to three individuals, ranked as alpha, beta, and delta wolves, respectively. These wolves are composed of individuals with the highest fitness values within the pack. The remaining wolves constitute the fourth tier, and their position iteratively updates and converge based on the positions of the three leading wolves, leading the entire wolf pack towards the optimal value. The specific formula is as follows:
In the equations,
In the equations, the convergence factor a linearly decays from 2 to 0 during the iteration process,
While the three leading grey wolves approach the prey following equations (18) to (21), the other grey wolves in the pack optimize their search paths along with the leading ones, as described by the specific formula:
The optimization process of GWO includes two phases: breadth search and depth search. During the initial iterations, the breadth search phase aims to expand the search range as much as possible to discover numerous local optimal solutions. When a sufficient amount of local optimal solution information is accumulated, the later iterations enter the depth search phase, characterized by more precise development and tracking capabilities, enabling an accurate and rapid approach towards the global optimal solution.
During the aforementioned iterative process, the position updates of the wolf pack are sharply influenced by the coefficient vector
As evident from equation (21),
In the equation, t represents the current iteration number, tmax represents the maximum iteration number. The convergence factor a varies with the iteration count as shown in Figure 3.
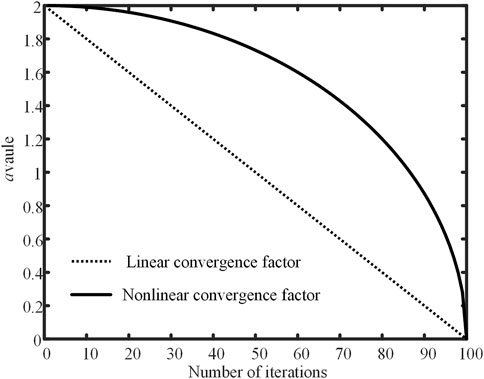
FIGURE 3. Curve of convergence factor with the number of iterations.
As evident from Figure 3, the nonlinear convergence factor exhibits a slow decay rate in the early iterations, contributing to a higher proportion of the breadth search phase, thereby retaining robust global search capabilities. In the later iterations, it rapidly decays to 0, ensuring effective optimization speed without excessive consumption of iteration counts.
Moreover, equations (23) to (25) reveal that the GWO algorithm does not manifest a hierarchical structure among the three leading wolves in their position update step and lacks communication between individual grey wolf entities. Hence, the introduction of the perturbation-weighted rule (Menglong Cao, 2023):
In the equations, the weight
The PSO algorithm possesses the characteristics of fast optimization speed, relatively stable results, and simplicity; however, its search capability is limited, making it susceptible to local optima. The GWO algorithm has a stronger global search capability and is relatively less prone to local optima compared to the PSO algorithm. Nonetheless, its search capability heavily relies on the three leading grey wolves, and the strength of search capability is closely related to the initialization of the wolf pack. Therefore, an improved PSO-GWO coupling algorithm is proposed for the optimization calculation of inter-group coordination regulation models. Firstly, the PSO algorithm is employed to iteratively optimize the inter-group coordination regulation model, resulting in three optimal particles. The objective function values of these three optimal particles obtained by the PSO algorithm are compared with the initial objective function values of the three leading grey wolves initialized by the GWO algorithm. If the objective function values of the particles obtained by the PSO algorithm are superior, they replace the initial values of the leading wolves, while the initialization positions of other wolves remain unchanged. This ensures that the wolf pack has superior initial positions of the leading wolves in the early iterations. The improved PSO-GWO coupling algorithm is outlined in Figure 4.
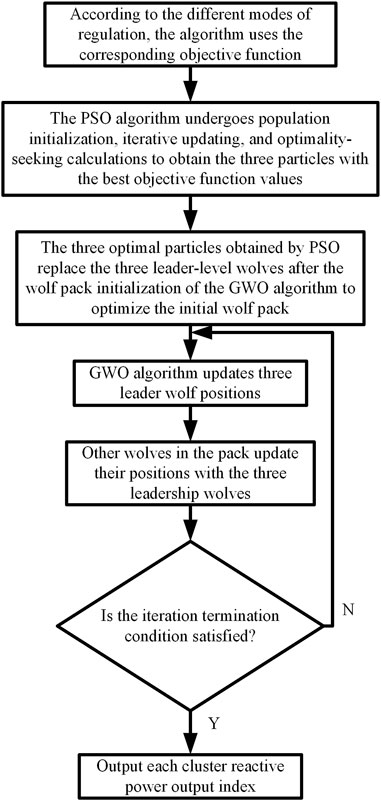
FIGURE 4. Flowchart of PSO-GWO coupling algorithm.
The inter-cluster coordination strategy adopts different control modes based on the voltage levels of the dominant nodes in each cluster. When the voltage fluctuates within limits at the leading node without exceeding them, the weight ω1 of the voltage deviation of nodes in the inter-cluster coordination control objective function is set smaller than the weight ω2 of network loss, and the system enters the economic control mode, mainly focusing on reducing network loss by controlling the reactive power output of distributed photovoltaics in each cluster. When the voltage at the leading node exceeds limits, the weight ω1 of the voltage deviation becomes larger than the weight ω2 of network loss, and the system enters the emergency control mode, primarily focusing on adjusting the reactive power output of distributed photovoltaics in each cluster to ensure that the voltage at each leading node operates safely within a specified range. After the calculation of the reactive power output of distributed photovoltaics in each cluster is completed, instructions are generated and sent to the lower-level inter-cluster autonomous strategy for allocation.
Upon receiving the reactive power control instructions distributed by the upper-level inter-cluster coordination strategy, the cluster calculates and issues indicators to determine the allocation among various photovoltaic power stations within the cluster using Intra-group autonomy control strategy. Generally, the allocation is based on the proportional capacity of each photovoltaic power station, ensuring the efficient utilization of reactive power capacity across the stations. However, this method neglects the varying sensitivity of voltage influence by the photovoltaic power station’s location on the dominant node. In reference (Lijun and Chao, 2021), distributed photovoltaics with the same capacity are integrated into upstream node n-1 and downstream node n+1, both at the same distance from a certain node n. When the injected photovoltaic power is equal, the integration of photovoltaics at downstream node n+1 exerts a greater impact on the voltage of node n. This conclusion can be obtained by using DisFlow power flow equation and considering the characteristics of distribution network feeders. The node voltage of the upstream node n-1 of node n in the distribution network can be obtained by the following formula:
In the equation, Rn, Xn and Pn, Qn are the resistive, reactance and active power, reactive power between nodes n-1 and n, respectively. Let the load power of node n be PLn, QLn, and node n possesses distributed PV output power PVn, QVn. When the distributed PV output power of node n changes at moment t while the injected power of the downstream node remains unchanged, the voltage change of the upstream node at moment t+1 is:
In the equation,
From Eq. (30) and (31), it can be seen that the change of PV output power of node n has an impact on the voltage of both upstream and downstream nodes, and the voltage change of the upstream node is larger, which indicates that regulating the PV output power of a node has a greater impact on its upstream node. In the case that the dominant node has both better observability and controllability, the voltage change of the dominant node is observed as the standard, so the downstream distributed PV of the dominant node should be preferentially invoked to obtain higher regulation efficiency of the dominant node.
Consequently, the strategy for reactive power output distribution within the cluster is as follows: Upon receiving instructions at the cluster level, a check is first performed to ascertain whether the self-dominant node is connected to photovoltaics. According to the prioritized control sequence of dominant node, downstream node and upstream node, the indicators are then allocated to distributed photovoltaics within the cluster. Nodes within each priority level are assigned indicators based on their respective distances from the dominant node. Only when the adjustable reactive power of a certain level is completely utilized and there are remaining control indicators, can the adjustable reactive power of the next priority level be invoked.
In case of communication failures between the inter-cluster layer and the cluster layer, and the cluster is unable to receive output indicators, the intra-cluster autonomy control strategy can be implemented. The control objectives of the intra-cluster autonomy control strategy aim to minimize the voltage deviation of the dominant node and the network loss of the cluster:
In the equations,
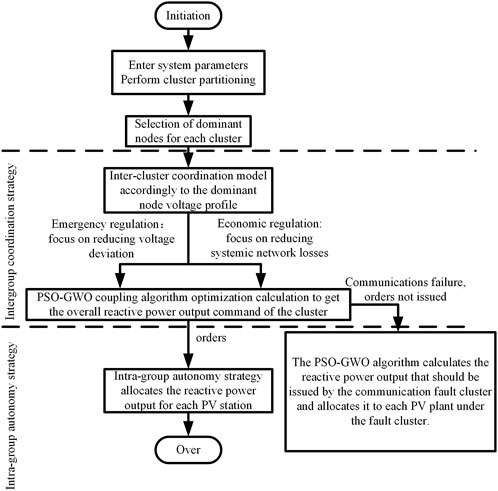
FIGURE 5. Flowchart of inter-cluster coordination + intra-cluster autonomy two-tier regulation strategy.
The improved IEEE 33-node system is selected, containing 32 load nodes with 9 nodes incorporating distributed photovoltaics. The total load of the system is 3,715 + j2315kVA, and the power factor of each distributed photovoltaic is 0.95. The network topology, distributed photovoltaic integration status, and cluster partitioning results are depicted in Figure 6; Table 1. Variances in simulation scenarios can lead to differences in cluster partitioning outcomes, this paper only presents the cluster partitioning results for a specific scenario.
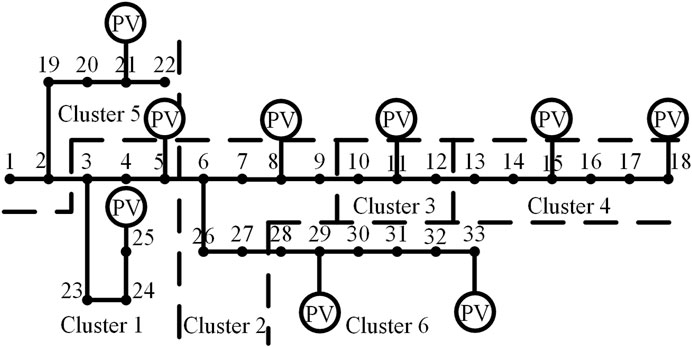
FIGURE 6. Improvement of IEEE 33-node system.
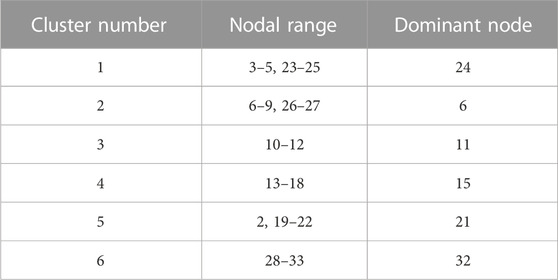
TABLE 1. Improved IEEE33 node system cluster division, dominant node selection results.
Selecting dominant nodes using three types of indicators. Method 1: Single observability indicator; Method 2: Composite indicator of observability and controllability, with a weight ratio of 0.4:0.6; Method 3: Improved dominant node indicator considering node degree and betweenness centrality. The selection results of the three methods are shown in Figure 7.
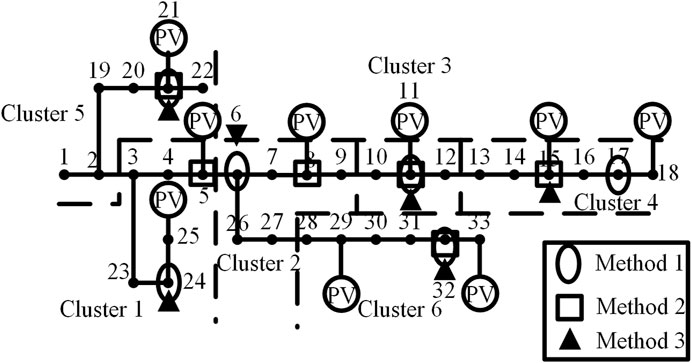
FIGURE 7. Comparison of the results of dominant node selection.
From Figure 7, it can be observed that dominant nodes selected by Method 1 are mostly non-photovoltaic access nodes. The voltage of these nodes can better reflect the cluster voltage level, but the single observability indicator does not consider the regulating performance of these nodes. Dominant nodes selected by Method 2 are mostly photovoltaic access nodes. These photovoltaic access nodes exhibit superior voltage regulation capabilities. However, there is a tendency for dominant nodes to be located at the end of feeders, which does not effectively represent the overall voltage level of the cluster. Dominant nodes selected by Method 3 are often situated in the middle of the cluster and are mostly photovoltaic access nodes. These nodes possess a good balance between observability and controllability.
The dominant nodes selected by the three methods are consistent in Clusters 3, 5, and 6. For Cluster 4, Method 1 designates Node 17 as the dominant node, which is situated at the end of a feeder and lacks photovoltaic access, thus not conducive to voltage regulation voltage regulation. Both Method 2 and Method 3 select Node 15 as the dominant node, positioned at the center of the cluster and equipped with photovoltaic access, exhibiting superior controllability. In Cluster 1, Method 2 designates Node 5 as the dominant node, with photovoltaic access but located at the edge of the cluster; both Method 1 and Method 3 designate Node 24 as the dominant node, not only adjacent to photovoltaic Node 25, but relatively closer to the cluster center, ensuring better regulation performance. For Cluster 2, both Method 1 and Method 3 designate Node 6 at the cluster center as the dominant node; however, Method 2 designates Node 8, an edge-of-cluster photovoltaic access node, as the dominant node. The differences in node selection between the two approaches reflect varying emphasis on observability, controllability, and spatial position factors. To compare the effectiveness of the two approaches (YAN Xiangwu et al., 2020), the reactive load of the dominant nodes in both approaches is sequentially increased by a factor of 1.1. The voltage trend of each node in the cluster is iteratively computed, as illustrated in Figure 8, enabling the analysis of the observability and controllability performance of the dominant nodes in the two approaches.
FIGURE 8. Trend of voltage change at each node due to increasing reactive load at node 6 or 8.
From Figure 8A, it can be observed that during the process of increasing reactive load resulting in voltage of cluster’s nodes changes, Node 6’s voltage closely aligns with those of the internal nodes within the cluster. Furthermore, the voltage drop rates of all nodes are consistent. In other words, Node 6 can effectively reflect the voltage level of the cluster, validating the rationality of this dominant node selection approach. From Figure 8B, it can be seen that the voltages of Nodes 7, 8, and 9 are similar, exhibiting consistent trends in change. Similarly, the voltage values and trends of Nodes 6, 26, and 27 are alike. The six nodes in Cluster 2 gradually segregate into two groups with significant deviations in voltage levels, indicating that Node 8 does not adequately represent the voltage fluctuation trend of the entire cluster.
In regard to the improved IEEE 33-node system, system voltage fluctuations caused by varying photovoltaic output under different sunlight conditions are simulated. Three scenarios are considered: voltage fluctuations within limits, voltage exceeding the upper limit, and voltage falling below the lower limit, for the purpose of conducting cluster control analysis. In the improved PSO-GWO coupling algorithm, the particle count of the particle swarm and the gray wolf individuals in the gray wolf population are both set to 50. The particle swarm undergoes 20 iterations, while the gray wolf population undergoes 100 iterations. In the PSO, both individual learning factor and social learning factor are set to 0.4.
When the dominant node voltages of each cluster operate within a safe range, the system enters an economic control mode; at this time, the minimum target weight for network loss is 0.7, and the minimum target weight for dominant node voltage deviation is 0.3. Two approaches are adopted for voltage control: this paper proposed improved PSO-GWO coupling inter-cluster coordination + intra-cluster autonomy allocation strategy, and the classical PSO inter-cluster coordination + intra-cluster allocation strategy based on photovoltaic capacity ratio. The optimized reactive power outputs of each cluster obtained using the proposed improved PSO-GWO coupling inter-cluster coordination + intra-cluster autonomy allocation strategy are shown in Table 2, and the reactive power outputs of each photovoltaic station after intra-cluster autonomy allocation are shown in Table 3.
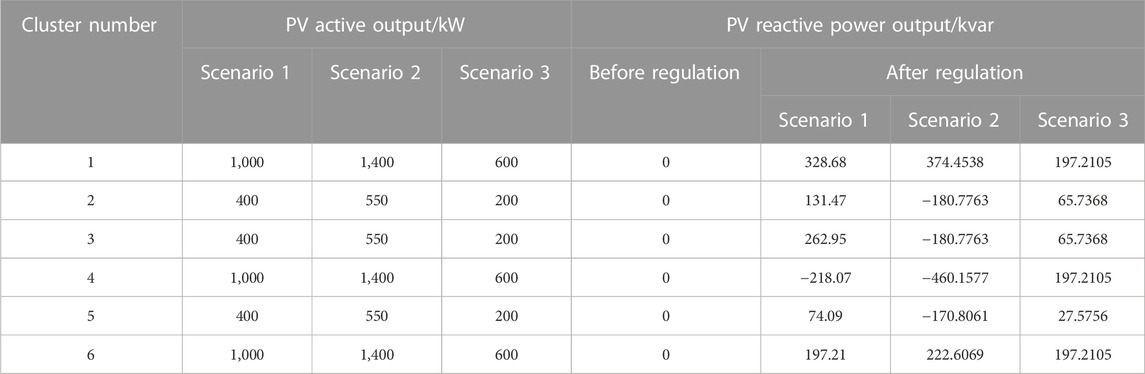
TABLE 2. Output before and after regulation of each cluster.
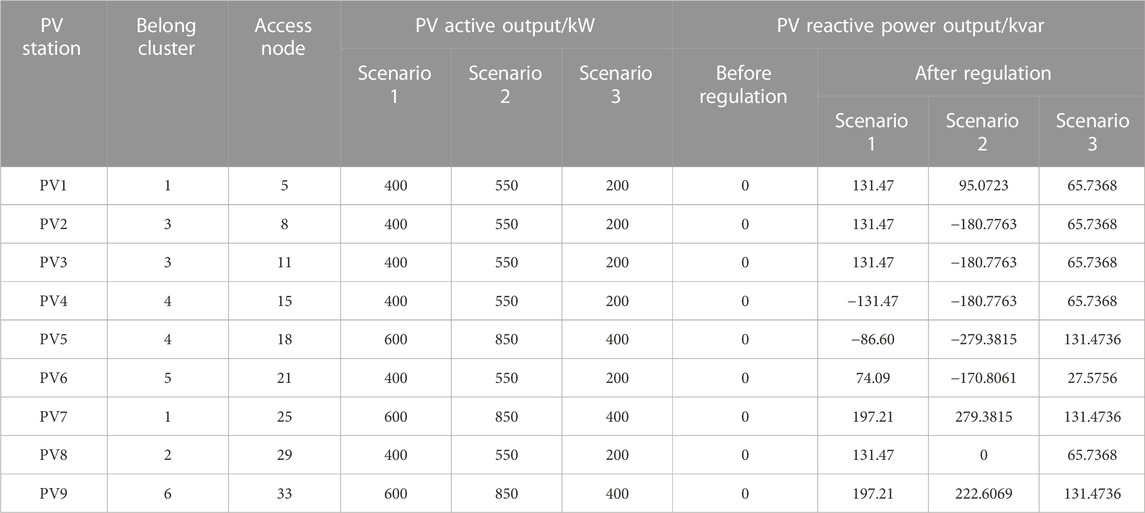
TABLE 3. Output of each PV power plant before and after regulation.
The comparison of system node voltage magnitudes before and after voltage control using the two approaches is shown in Figure 9A, and the voltage deviation, system network loss, and objective function values are presented in Table 4.
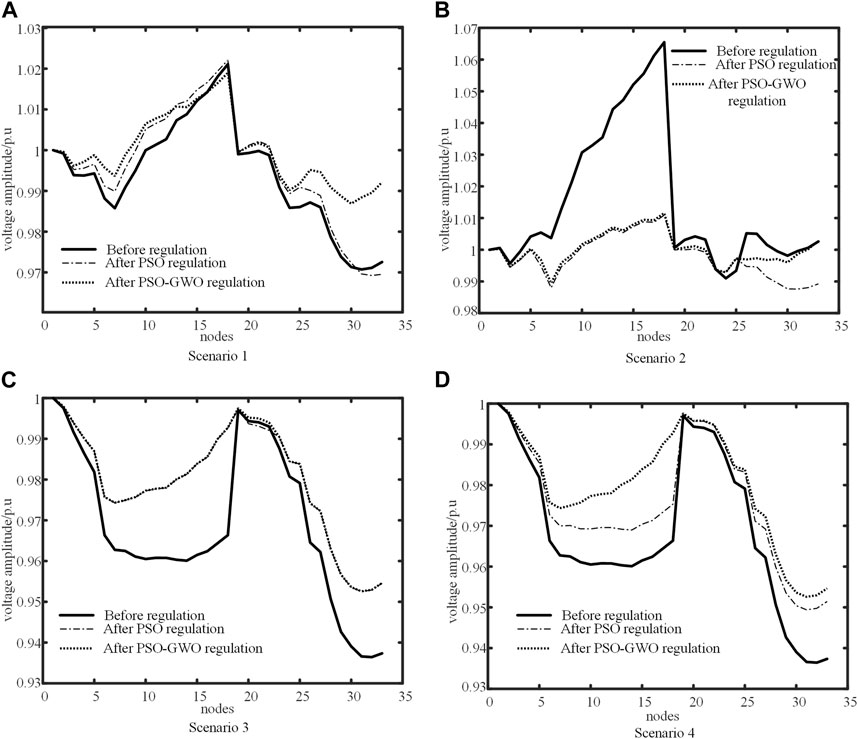
FIGURE 9. Plot of system voltage amplitude before and after regulation in scenarios 1∼4.
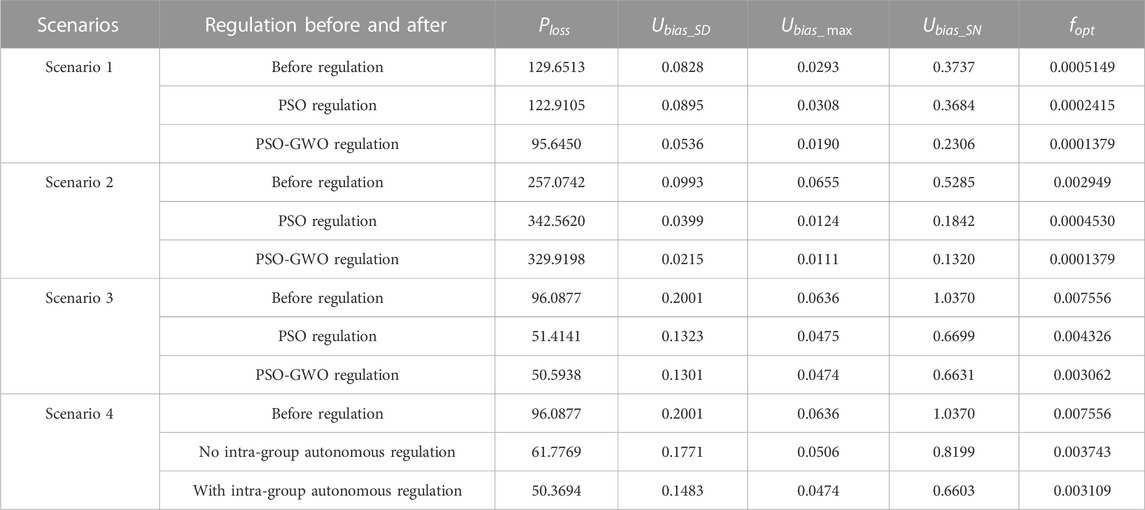
TABLE 4. Table of indicators for regulatory assessment.
The comparison of PSO-GWO algorithm control before and after, as shown in Figure 9A; Table 4, reveals that the sum of magnitudes of dominant node voltage deviations decreases by 35.27%, the maximum node voltage deviation decreases by 35.15%, and the sum of magnitudes of voltage deviations for all nodes decreases by 38.13%. In contrast, the PSO algorithm control shows an increase of 8.09% and 5.12% in the sum of magnitudes of dominant node voltage deviations and the maximum node voltage deviation, respectively, while the total node voltage deviation decreases by 1.42%. Compared to the control before, the PSO-GWO algorithm reduces system network loss by 34.0063kW, achieving a decrease of 26.23%; the PSO algorithm reduces system network loss by 6.7408kW, a reduction of 5.20%. This demonstrates that the PSO-GWO coupled control approach significantly reduces system network loss and voltage deviations, while effectively elevating the voltage levels at the end of feeders.
Figure 10 illustrates the relationship between the objective function values and the number of iterations during optimization for the two approaches. It is evident from the figure that the PSO algorithm achieves rapid optimization but lacks precision, quickly converging to a local optimum after only 10 iterations. In contrast, the PSO-GWO coupling algorithm, benefiting from the initial optimization of the PSO population and the utilization of intra-cluster autonomy allocation strategy, has an initial objective function value that surpasses the local optimum reached by the PSO algorithm. Moreover, the PSO-GWO algorithm exhibits superior global search capability, enabling it to continue searching for improved objective function values even after stabilization. It can expand the search range through perturbation weighting and continues to find better solutions around the 50–60 iteration mark.

FIGURE 10. Iterative optimization graph of PSO algorithm and PSO-GWO coupling algorithm.
The inter-cluster coordination detected the dominant node voltage exceeding the set upper limit of 1.05 p. u., causing the system to enter emergency control mode. At this time, the minimum target weight for network loss is 0.3, and the minimum target weight for dominant node voltage deviation is 0.7.
The improved PSO-GWO coupling inter-cluster coordination + intra-cluster autonomy allocation strategy optimization proposed in this paper yields the reactive power output of each cluster as shown in Table 2. After intra-cluster autonomy allocation, the reactive power output indicators of each photovoltaic station are presented in Table 3.
The comparison of system node voltage magnitude before and after voltage regulation using the two approaches is shown in Figure 9B, along with the voltage deviations, system network loss, and objective function values as presented in Table 4.
As evident from Figure 9B; Table 4, before regulation, the dominant node 15 of Cluster 4 exceeded the upper limit, triggering emergency control mode. After regulation, all node voltages are within the safe range, and the drop in Cluster 4, which had the highest exceedance, is significantly greater than other clusters, demonstrating the effectiveness of the control. Comparing PSO-GWO algorithm control before and after, the sum of dominant node voltage deviation magnitudes in the system decreases by 78.35%, the maximum node voltage deviation drops by 83.05%, and the sum of all node voltage deviation magnitudes decreases by 75.02%. On the other hand, comparing PSO algorithm control before and after, the sum of dominant node voltage deviation magnitudes, maximum node voltage deviation, and total node voltage deviation values decrease by 59.82%, 81.07%, and 65.15% respectively. Compared to the pre-regulation state, in order to control dominant node voltages, the PSO-GWO algorithm results in the system network loss increase of 72.8456 kW during the control of distributed photovoltaic reactive power output, while the PSO algorithm increases it by 85.4878 kW. This illustrates that the PSO-GWO coupling control approach outperforms the PSO algorithm in all performance indicators. Furthermore, it significantly reduces feeder terminal node voltage deviations compared to the PSO algorithm.
Inter-cluster coordination detected that the voltage of the dominant node has crossed the set lower limit of 0.95 p. u., causing the system to enter an emergency control mode. At this moment, the weights corresponding to the minimum network loss objective function and the minimum dominant node voltage deviation objective function are the same as in Scenario 2.
The improved PSO-GWO coupling inter-cluster coordination + intra-cluster autonomy allocation strategy optimization proposed in this paper yields the reactive power outputs of each cluster as shown in Table 2. After undergoing intra-cluster autonomy allocation, the reactive power outputs of individual photovoltaic stations in each cluster are presented in Table 3.
A comparison of system node voltage magnitudes before voltage regulation and after employing two different approaches for voltage regulation is illustrated in Figure 9C, along with their corresponding voltage deviations, system network losses, and objective function values as outlined in Table 4.
As indicated by Figure 9C; Table 4, it can be observed that the dominant node 32 of Cluster 6 exceeds the lower limit before regulation, triggering the emergency control mode. In comparison to the state prior to control, the total modulus sum of the dominant node voltage deviations in the system decreases by 34.98% after PSO-GWO algorithm control, with the maximum node voltage deviation decreasing by 25.47%, and the total modulus sum of all node voltage deviations decreasing by 36.06%. Conversely, for PSO algorithm-based control, in comparison to the state before control, the dominant node voltage deviation modulus sum decreases by 33.88%, the maximum node voltage deviation decreases by 25.31%, and the overall node voltage deviation values decrease by 35.40%.
Due to the low solar irradiance in this scenario and the limited capacity for adjustable reactive power, the space for effective control scheme optimization is constrained, leading to reduced optimization difficulty. Consequently, the performance metrics of the PSO-GWO algorithm exhibit only minor discrepancies compared to the PSO algorithm. Both approaches are capable of identifying the global optimum.
In summary, for the improved IEEE 33-node system under three distinct scenarios, a comparative analysis of cluster control is conducted between the enhanced PSO-GWO coupling strategy with inter-cluster coordination and intra-cluster autonomy allocation, and the classical PSO strategy with inter-cluster coordination and intra-cluster allocation based on photovoltaic capacity ratios. The results demonstrate that the proposed approach can effectively achieve voltage control under different scenarios and reduce system network losses. The control performance is significantly enhanced compared to the classical particle swarm optimization strategy with inter-cluster coordination and intra-cluster allocation based on photovoltaic capacity ratios.
According to Table 2, in scenario three, compared to other clusters, Cluster 4 has the highest active power capacity and a reactive power capacity of 197.2105 kvar, with low node voltages within this cluster; In the absence of communication failures, as per the inter-cluster coordination strategy proposed in this paper, Cluster 4’s reactive power output is at its maximum state; If a communication failure occurs within this cluster, resulting in its exclusion from the overall system control, its reactive power output becomes zero. This situation would significantly impact the effectiveness of voltage limit control in the system; Consequently, Cluster 4 is designated as the communication failure cluster, operating with an intra-cluster autonomy strategy.
Since the dominant node 15s voltage within Cluster 4 does not fall below the lower limit, the intra-cluster autonomy strategy enters an economic control mode. The computation using the intra-cluster autonomy strategy yields maximum reactive power output for this cluster, as shown in Table 5. A comparison among the pre-control scenario, Cluster 4 with communication failure and no intra-cluster autonomy, and Cluster 4 with communication failure and intra-cluster autonomy is illustrated in terms of node voltage magnitudes in Figure 9D. Voltage deviations, system network losses, and objective function values are presented in Table 4. From Figure 9D; Table 4, it is evident that when Cluster 4 experiences a communication failure and lacks intra-cluster autonomous control, the system lacks adjustable reactive power participation from Cluster 4. This deficiency results in a maximum node voltage deviation of 0.0506 p. u., which still exceeds the lower limit. When Cluster 4 experiences a communication failure and is subject to intra-cluster autonomy control, even though the cluster enters an economic control mode due to the non-exceedance of its dominant node voltage limit, the overall lower voltage level allows the intra-cluster autonomy strategy to yield an output scheme consistent with the inter-cluster coordinated control. Furthermore, the voltage deviations, system network losses, and objective function values are nearly identical to those of the inter-cluster coordinated control.

TABLE 5. Autonomous regulation of reactive power output within cluster 4 cluster.
In conclusion, when the communication failure occurs within a cluster, the intra-cluster autonomy control strategy can facilitate inter-cluster coordination to issue commands to that cluster. This achieves voltage limit regulation and promotes secure and economical operation.
In response to the issues of voltage exceeding limits and reverse power flow caused by the integration of a large number of distributed photovoltaics, this paper proposes an improved PSO-GWO coupling inter-group coordination + intra-group autonomy allocation strategy. After conducting multiple scenario-based simulation analysis on an enhanced IEEE 33-node system, the following conclusions are drawn.
(1) The improved PSO-GWO coupling inter-group coordination + intra-group autonomy allocation strategy, based on considerations of observability and controllability, first introduces node degree and node betweenness centrality reflecting node structural information and spatial position. These metrics form a comprehensive indicator for selecting the dominant node within each cluster. In comparison to conventional observability and controllability metrics, the dominant node selected based on the comprehensive indicators considering node position information and topological structure can effectively reflect the cluster’s voltage level and exhibit excellent control capabilities.
(2) The improved PSO-GWO coupling algorithm introduces linearly decreasing dynamic inertia weights in the PSO algorithm, enhancing optimization speed and search depth; in the GWO algorithm, a nonlinear convergence factor is set to optimize the breadth-to-depth search ratio, accelerating convergence speed; a disturbance-weighted rule for leading-level wolves is established to enhance optimization diversity; and the improved PSO algorithm is coupled with the improved GWO algorithm to optimize the initial structure of the wolf pack.
(3) Targeting minimal voltage deviation of the dominant node and minimal system power loss, a regulatory optimization model for distributed photovoltaic clusters is established. The improved PSO-GWO coupling algorithm is applied for coordinated computation and issuance of reactive power output for each cluster. Intra-cluster autonomous allocation strategies are implemented for each cluster.
In the improved IEEE 33-node system, typical scenarios are established to compare the improved PSO-GWO coupling inter-group coordination + intra-group autonomy control strategy with the classical PSO inter-group coordination + intra-group allocation strategy based on photovoltaic capacity proportion. The results indicate that the proposed strategies exhibit favorable effects on reducing node voltage deviation and lowering power loss under different scenarios. This strategy is suitable for complex control scenarios arising from the integration of a large number of distributed photovoltaics, characterized by extensive equipment monitoring and communication pressure, effectively ensuring the secure and economic operation of the distribution network.
The original contributions presented in the study are included in the article/Supplementary material, further inquiries can be directed to the corresponding author.
JL: Writing–review and editing. YY: Writing–original draft. JQ: Writing–review and editing. JC: Writing–review and editing. YZ: Writing–review and editing. JR: Writing–review and editing. ZL: Writing–review and editing.
The author(s) declare financial support was received for the research, authorship, and/or publication of this article. Research on heterogeneous multi-source mult-temporal cooperative frequency tuning method fornew power system funding number: 62273312.
Author JQ was employed by State Grid Henan Electric Power Company; Author JC was employed by Economic and Technical Research Institute of State Grid Henan Electric Power Company; Author JR was employed by State Grid Hebi Power Supply Company.
The remaining authors declare that the research was conducted in the absence of any commercial or financial relationships that could be construed as a potential conflict of interest.
The handling editor KY declared a shared affiliation with the author JL, YY, YZ, and ZL at the time of the review.
All claims expressed in this article are solely those of the authors and do not necessarily represent those of their affiliated organizations, or those of the publisher, the editors and the reviewers. Any product that may be evaluated in this article, or claim that may be made by its manufacturer, is not guaranteed or endorsed by the publisher.
Bifeng, X. (2006). “Study on control strategy of secondary voltage control,”. Master thesis (Southeast University). Dhaka, Bangladesh.
Chang, D., Li, Y., Chen, G., Liu, C., and Ma, Z. (2022). Study on the influence of distributed photovoltaic access on distribution network. Autom. Appl. (8), 111–114. doi:10.19769/j.zdhy.2022.08.033
Demirok, E., Sera, D., Teodorescu, R., Rodriguez, P., and Borup, U. (2009). “Clustered PV inverters in LV networks: an overview of impacts and comparison of voltage control strategies,” in 2009 IEEE Electrical Power & Energy Conference (EPEC 2009), Montreal, Canada, January 2009.
Fei, D., Lei, H., Jian, X., and Yuan-zhang, S. (2011). Voltage partitioning and pilot nodes selecting of Henan power grid based on secondary voltage control. Power Syst. Prot. Control 39 (24), 101–105. doi:10.3969/j.issn.1674-3415.2011.24.017
Hongmin, Y., Xinhui, D., Tingjun, L., and Chen, J. (2019). Simulation of consumption capacity and voltage control strategy of distribution network with high penetration of photovoltaics. Power Syst. Technol. 43 (2), 462–469. doi:10.13335/j.1000-3673.pst.2018.2036
Institute, C. E. P. R., Co, N. C. E. P. R. I., Center, C. M. P. P., Co, C. S. P. G., Corporation, C. R. E. G., Company, S. E. C., et al. (2008). “Power quality—deviation of supply voltage,” in General administration of quality supervision, inspection and quarantine of the people's Republic of China (Standardization Administration of the People's Republic of China). Beijing, China.
Jianfang, L., Lu, Z., Xiaohui, S., Xiaoli, M., and Wei, T. (2017). Multi-objective reactive power partitioning and pilot node selection of distribution network with high penetration of DGs. Renew. Energy Resour. 35 (11), 1664–1671. doi:10.13941/j.cnki.21-1469/tk.2017.11.013
Jinghua, C., Linjuan, Z., Dan, L., Pu, G., Junyue, R., and Jingli, L. (2023). Cluster partition method of distributed power supply based on improved particle swarm optimization algorithm. J. Zhengzhou Univ. Eng. Sci., 44, 1–9. doi:10.13705/j.issn.1671-6833.2023.05.012
Lijun, X., and Chao, W. (2021). Voltage partition coordinated control of county distribution network with distributed PV based on partial measurement data. Electr. Meas. Instrum., 1–6.
Lin, Y., Ying, S., Ran, X., and Kejun, L. (2017). Improved particle swarm optimization algorithm and its application in reactive power partitioning of power grid. Automation Electr. Power Syst. 41 (03), 89–95+128. doi:10.7500/AEPS20160321004
Menglong Cao, W. Z., and Chen, Z. (2023). Robot path planning by fusing particle swarm algorithm and improved grey wolf algorithm. J. Syst. Simul. 35 (08), 1768–1775. doi:10.16182/j.issn1004731x.joss.22-0407
Mirjalili, S., Mirjalili, S. M., and Lewis, A. (2014). Grey wolf optimizer. Adv. Eng. Softw. 69, 46–61. doi:10.1016/j.advengsoft.2013.12.007
Peng, L., Hang, Y., Man, X., and Jian, S. (2016). A hierarchical multi-mode var control strategy for grid-connected PV clusters. Power Syst. Technol. 40 (10), 3038–3044. doi:10.13335/j.1000-3673.pst.2016.10.016
Qian, C., and Haiyun, W. W. W. (2023). Research on optimal operation of distribution network with distributed generation integration. Electr. Meas. Instrum., 1–12.
Tao, J., Donghui, Z., Xue, L., Rufeng, Z., and Guoqing, L. (2021). Distributed optimal control of voltage in active distribution network with distributed photovoltaic. Electr. Power Autom. Equip. 41 (9), 102–109+125. doi:10.16081/j.epae.202108011
Wei, C., Wei, Y., Lee, W.-J., and Xia, Z. (2017). Optimal pilot-bus selection and network partitioning algorithm considering zonal reactive power balance. Power Syst. Technol. 41 (1), 164–170. doi:10.13335/j.1000-3673.pst.2016.0393
Wei, C., Xin, A., Tao, W., and Hui, L. (2013). Influence of grid-connected photovoltaic system on power network. Electr. Power Autom. Equip. 33 (2), 26–32+39. doi:10.3969/j.issn.1006-6047.2013.02.005
Xiao, M., Gaofeng, P., Xinghua, W., Xiangang, P., and Xiaomei, W. (2013). Improved network partition and pilot node selection method for reactive power/voltage control based on community detection algorithm. Power Syst. Prot. Control 41 (22), 32–37.
Xiaoyu, Z., Yu, J., Ying, Z., and Jianhua, Y. (2019). Coordinated optimal control of distributed photovoltaic cluster based on model predictive control. Power Syst. Clean Energy 35 (7), 66–74. doi:10.3969/j.issn.1674-3814.2019.07.009
Yan, X., Li, R., and Xu, Y. (2020). Voltage adaptive partitioning method and optimal pilot-node selection considering reactive power margin. Mod. Electr. Power 37 (2), 117–124. doi:10.19725/j.cnki.1007-2322.2019.0311
Yan-Zhen, X., and Dong-Hui, W. (2018). Hybrid grey wolf optimizer algorithm with fuzzy weight strategy. Comput. Syst. Appl. 27 (10), 202–208. doi:10.15888/j.cnki.csa.006569
Keywords: distributed photovoltaic, cluster division, dominant node, inter-cluster coordination, intra-cluster autonomy
Citation: Li J, Yao Y, Qin J, Chen J, Zhao Y, Ren J and Li Z (2023) Research on control strategy of distributed photovoltaic cluster based on improved particle swarm-gray wolf coupling algorithm. Front. Energy Res. 11:1292899. doi: 10.3389/fenrg.2023.1292899
Received: 12 September 2023; Accepted: 26 October 2023;
Published: 09 November 2023.
Edited by:
Kunjie Yu, Zhengzhou University, ChinaReviewed by:
Min Xia, Nanjing University of Information Science and Technology, ChinaCopyright © 2023 Li, Yao, Qin, Chen, Zhao, Ren and Li. This is an open-access article distributed under the terms of the Creative Commons Attribution License (CC BY). The use, distribution or reproduction in other forums is permitted, provided the original author(s) and the copyright owner(s) are credited and that the original publication in this journal is cited, in accordance with accepted academic practice. No use, distribution or reproduction is permitted which does not comply with these terms.
*Correspondence: Jingli Li, bGlqaW5nbGkxMDIyQHp6dS5lZHUuY24=
Disclaimer: All claims expressed in this article are solely those of the authors and do not necessarily represent those of their affiliated organizations, or those of the publisher, the editors and the reviewers. Any product that may be evaluated in this article or claim that may be made by its manufacturer is not guaranteed or endorsed by the publisher.
Research integrity at Frontiers
Learn more about the work of our research integrity team to safeguard the quality of each article we publish.