 Yi Xuan
 Zhiqing Sun
95% of researchers rate our articles as excellent or good
Learn more about the work of our research integrity team to safeguard the quality of each article we publish.
Find out more
BRIEF RESEARCH REPORT article
Front. Energy Res. , 09 November 2023
Sec. Process and Energy Systems Engineering
Volume 11 - 2023 | https://doi.org/10.3389/fenrg.2023.1292095
This article is part of the Research Topic Advanced Technologies for Planning and Operation of Prosumer Energy Systems, volume III View all 32 articles
Low-voltage distribution grid (LVDG) topology detection refers to detecting whether the topology connection between distribution grid nodes is correct. Accurate topology connection is critical for the normal operation and planning of LVDG. However, due to the incomplete measurement device, unknown line parameters, and rapid growth of renewable energy, the topology detection of LVDG becomes one of the most prominent challenges. This paper proposes an LVDG topology detection method based on virtual impedance, utilizing measurement data from nodes in the LVDG to achieve the detection of abnormal topological connections. Specifically, the electrical distances between nodes are analyzed to establish a topology detection model using virtual impedance. Then, the double hidden layer recurrent neural network is proposed to fit the mapping relationships between variables in the power flow constraints. The virtual impedance between nodes is solved. The value of virtual impedance is used to determine whether the topological connection between nodes is correct. Finally, the test results in the actual LVDG prove the effectiveness of the proposed method.
The low-voltage distribution grid (LVDG) is an essential part of the power system, responsible for delivering electricity to residential, commercial, and industrial end-users (Wei et al., 2022). With the rapid growth of renewable energy and the increasing access to distributed power, the development of LVDG is imperative (Azizivahed et al., 2020; Memmel et al., 2023). As the complexity of LVDG increases, efficient and accurate topology detection methods become crucial to ensure their reliable operation and optimal utilization (Wang et al., 2023a; Chen et al., 2023).
LVDG topology detection refers to detecting whether the nodes of the distribution grid are connected correctly. Topology detection provides electrical grid structure data for LVDG tasks such as power flow calculation and fault detection (Li et al., 2023), the foundation is formed to conduct LVDG analysis. In recent years, by installing smart metering devices or investing a lot of manpower to obtain the topology of LVDG, the economic cost of power grid companies has greatly increased (Orlando et al., 2022). Therefore, LVDG topology detection has gained increasing attention from scholars.
At present, the topology detection methods for the distribution grid can be broadly categorized into instrumentation method, signal injection method, and data-driven method (Cao et al., 2023; Tang et al., 2023). The instrumentation method requires deploying various measuring instruments and meters in the LVDG, using real-time data collected to analyze the topology and operational status of the LVDG (Srinivas and Wu, 2022). Similarly, the signal injection method requires the use of specific instruments to inject characteristic signals in advance, and then identify them for completing the topology detection (Niu et al., 2021; Alam and Payami, 2023). However, both instrumentation method and signal injection method require the addition of additional identification equipment and signal generators at the terminals of LVDG. This may lead to the deployment and maintenance of LVDG become more complex. Therefore, both methods are not conducive to the topology detection of the entire LVDG. They are only suitable for the detection of individual lines or demonstration lines. With the popularity of smart meters, topology detection is carried out by analyzing the relationship between measurement data (Zhao et al., 2022). This method is called the data-driven method. Based on the current balance relationship of distribution line nodes, (Zhang et al., 2020; Liu et al., 2021), analyze the distribution of user nodes on distribution lines. (Jorjani et al., 2021; Wang et al., 2021) propose a data-driven method based on graph theory, this method uses the measurement data of smart meters to infer the topology of LVDG. However, existing research methods usually adopt a single data feature. The accuracy of topology detection cannot be guaranteed when faced with complex LVDG. Besides, they cannot deal with topology detection in the case of missing terminal measurement data and unknown line parameters (Xue et al., 2023).
Consequently, this paper proposes an LVDG topology detection method based on virtual impedance. Firstly, based on the measurement data from LVDG terminals, the electrical distances between measurement nodes are analyzed. The concept of virtual impedance is used to describe the degree of connection between nodes, then a topology detection model based on virtual impedance is established. Secondly, the Double Hidden Layer Recurrent Neural Network (DHLRNN) is proposed to model the mapping relationships between variables in the power flow constraints, aiming to calculate the virtual impedance between nodes. Consequently, the topology of the LVDG is deduced, enabling the detection of abnormal topology connections. Finally, testing results in practical LVDG demonstrate the effectiveness of the proposed approach.
The rest of the paper is arranged as follows: Section 2 introduces the concept of virtual impedance. Section 3 proposes a topology detection model and its solution method based on DHLRNN. Section 4 verifies the effectiveness of the topology detection method proposed in this paper. Section 5 gives the conclusion of this paper.
Based on the measurement data of the LVDG terminals, this section analyzes the electrical distance between the measurement nodes. The concept of virtual impedance is used to describe the tightness of the connection between nodes (Wang et al., 2023b). Therefore, it becomes possible to determine whether nodes are correctly connected by calculating virtual impedance. This is of significant importance for monitoring and managing LVDG (Liu et al., 2022).
In LVDG, the electrical distance between nodes refers to the length of the electrical path between two nodes. The calculation of electrical distance involves the impedance, conductance, and other factors of the line. Generally, a greater electrical distance between nodes indicates a longer connection line between them. Long-distance distribution lines will lead to increased impedance, resulting in increased line losses. Therefore, to minimize line losses in the LVDG, the electrical distance between nodes should be reduced as much as possible.
For the LVDG with n nodes, Ij, Xj, and Rj are defined as current, reactance, and resistance in the cable segment. The impedance can be expressed as Zj = Rj + jXj. cosδj represents the power factor. The reactance can be represented as Xj = Rjtanδj. The active power loss, reactive power loss, and total power loss of this cable segment can be expressed as follows:
Based on the above formulas, the line losses PLOSS for the n-node LVDG can be derived as follows:
Replacing the coefficient of IjIk with Mjk to obtain the line losses PLOSS:
where P1 represents the active power of the smart meter outlet of the distribution transformer node 1; Pj represents the active power at the smart meter outlets from user node j; Ij is the output current of the smart meter at user node j; Mjk represents the coefficient of IjIk in Eq 3; The value of Mjk depends on the topology of the LVDG and the impedance values of transformers and lines in the grid.
When there is no connection between nodes j and k, the value of Mjk is 0. When there is a connection, the value of Mjk equals the product of the impedance values of each section at the upstream junction of nodes j and k and the reciprocal square of the power factor. Therefore, by analyzing the value of Mjk when j = 1, the virtual impedance values between each pair of nodes are gradually derived.
In the calculation of virtual impedance, power flow variables such as active power and voltage are involved. The mapping relationship between these power flow variables is included in the power flow constraint equation. Therefore, fitting the mapping relationship between power flow variables is essential, it essentially reconstructs the power flow constraint equation.
In the power flow constraint equations, for an n-node LVDG, there exists a unique, continuous, and differentiable function L such that:
The above analysis demonstrates the unique mapping relationship between [I1, P2,∙∙∙, Pn] and [P1, I2,∙∙∙, In]. By reconstructing the power flow constraint equations to fit the mapping relationship between power flow variables, the relationship between virtual impedance and power flow variables can be derived.
This paper adopts DHLRNN to fit the mapping relationship between variables in the power flow constraints. DHLRNN consists of a multilayer perceptron with two hidden layers. The nodes of the hidden layer apply the activation function to the weighted sum of their inputs, then the data is processed by a dynamic cyclic connection. Therefore, the DHLRNN algorithm can effectively handle non-linear fitting problems.
DHLRNN is a four-layer neural network, this neural network comprises an input layer, an output layer, and two intermediate hidden layers. The first hidden layer is responsible for computing the activation function. The second hidden layer is responsible for calculating the Gaussian function. After one round of computation, the output signal is fed back to the input layer through the feedback loop for the next round of calculation. The forward propagation process of the K-layer DHLRNN algorithm is as follows:
where the input X is an n-dimensional vector consisting of the injected currents at transformer nodes and the active power at other nodes; W(i) represents the weight matrix of the i-th hidden layer; b(i) represents the bias vector of the i-th hidden layer; The output Y is an n-dimensional vector consisting of the active power at transformer nodes and the injected currents at other nodes.
Based on the mapping relationship between the power flow variables fitted by DHLRNN. The virtual impedance values between nodes are calculated. The formula for solving the virtual impedance is expressed as follows:
where Mjk represents the virtual impedance between nodes j and k; Pj and Pk represent the active power at the smart meter outlets from node j and k; Ij and Ik represent the output current of the smart meter at node j and k; W(i) represents the weight matrix of the i-th hidden layer; b(i) represents the bias vector of the i-th hidden layer; K represents the number of hidden layers of the DHLRNN, and the value of K is 2.
The solved virtual impedance value is normalized. Mapping it to the standardized range [0,1]. Assuming that the range of the virtual impedance value is [Mmin, Mmax], the normalized formula is as follows:
where Mjk_n represents the normalized virtual impedance value; Mjk represents the virtual impedance value before normalization; Mmin represents the minimum value of the virtual impedance value before normalization; Mmax represents the maximum value of the virtual impedance before normalization.
Then, the normalized virtual impedance value is compared with the preset threshold. The calculation formula of threshold Mth is as follows:
where, n represents the number of normalized virtual impedance values; M i jk_g represents the i-th normalized virtual impedance value.
If the normalized virtual impedance values between nodes are below the threshold, it indicates the existence of a topological connection between the nodes. On the contrary, if the normalized virtual impedance values between nodes exceed the threshold, it indicates that there is no topological connection between the nodes. By comparing the topological connection detection result data obtained by this method with the topological connection data recorded in the database. If the two data are inconsistent, it indicates that there is an anomaly in the topological connection between nodes.
The flow chart of virtual impedance-based topological connection detection using DHLRNN is shown in Figure 1.

FIGURE 1. Virtual impedance-based topological connection detection using DHLRNN.
In this paper, the LVDG in a practical area is tested. This LVDG comprises 6 low-voltage distribution transformers and 358 end-users. Data is collected at 96 time points (24 h) with intervals of 15 min each day. The proposed virtual impedance-based topology detection method is validated on this LVDG.
Some historical active power and current amplitude data are selected for training. Among them, 75% are training set data and 25% are test set data. Each sample includes the active power injected by 30 user nodes and the current amplitude of the distribution transformer node (1 × 31-dimensional vector). Each tag includes the current amplitude of 30 user nodes and the active power injected by the distribution transformer node (1 × 31-dimensional vector). The number of layers in the neural network is 4, and the number of neurons in the hidden layer is 185.
The adjacency matrix heatmap can visually illustrate the connectivity between nodes. In the adjacency matrix heatmap, darker colors typically represent stronger connections between nodes. The lighter colors indicate weaker connections or the absence of connections. The adjacency matrix heatmap obtained using the proposed topology detection method in this paper is shown in Figure 2.
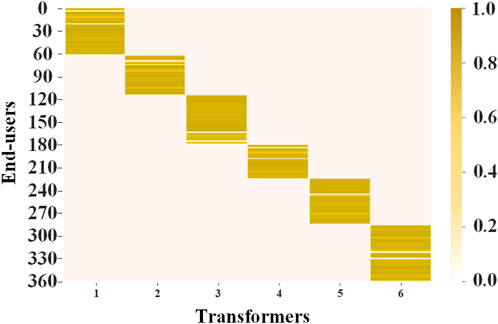
FIGURE 2. Heatmap of the adjacency matrix.
From Figure 2, the 6 low-voltage distribution transformer areas and 358 end-users of the LVDG are generally recognized. The user with an abnormal topology connection is detected.
In order to reflect the superiority of DHLRNN over other neural networks in the training process. In this paper, the mean absolute percentage error (eMAPE) and maximum percentage error (emax) are selected as the evaluation indexes to compare the performance of DHLRNN, CNN and RNN neural networks in the training process. As shown in Table 1:
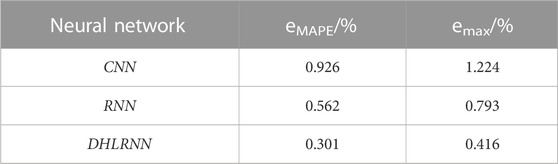
TABLE 1. Neural network comparison.
From Table 1 compared with other neural networks, DHLRNN has smaller prediction error and better data fitting ability.
Using the LVDG as an example, this paper compares the proposed topology detection method based on virtual impedance with the following three methods: 1) Based on the multi-period MILP model to identify the topological relationship between nodes. 2) Identify the topological relationship between nodes based on mutual information Bayesian network. 3)Identify the topological relationship between nodes based on a graph convolutional network. Figure 3 shows the number of users with normal topology connections detected by the four methods and the accuracy of detection.
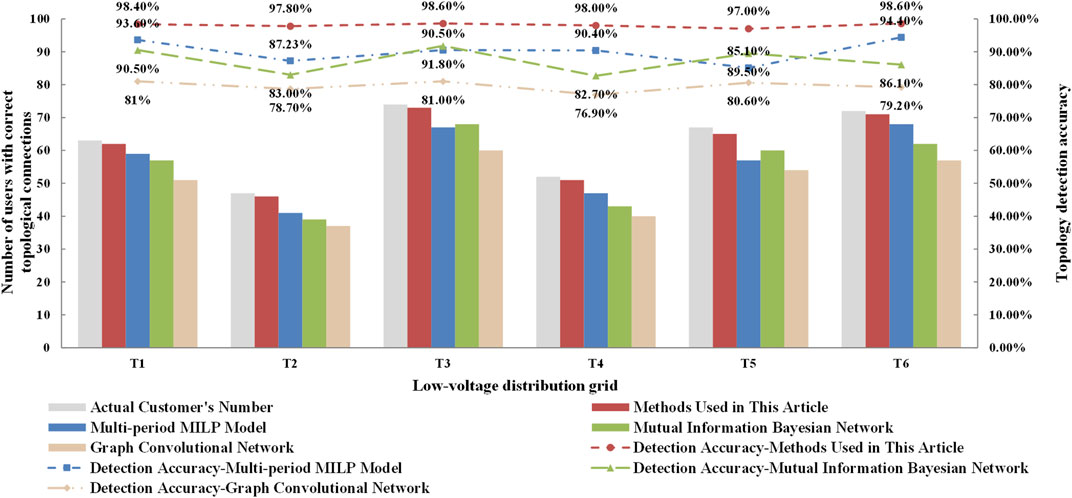
FIGURE 3. The number of users with correct topological connections and the accuracy of detection.
From Figure 3, the topology detection method based on the virtual impedance proposed in this paper has higher accuracy. This method can adapt to more topology detection scenarios.
This paper proposes a virtual impedance-based LVDG topology detection. The aim is to address the challenges of incomplete measurement devices and unknown line parameters in LVDG topology detection. The main contribution of this paper is summarized as follows:
1) A practical LVDG topology detection method is proposed to detect the end-user of LVDG topology with incomplete measurement devices and unknown line parameters.
2) The electrical distance between measurement nodes is analyzed. The concept of virtual impedance is used to describe the tightness of the connection between nodes. Then a topology detection model based on virtual impedance is established.
3) The DHLRNN is proposed to fit the mapping relationship between variables in power flow constraints. Then the mapping relationship is used to solve the virtual impedance. The value of virtual impedance is used to judge whether the topological connection between nodes is correct.
This method demonstrates relatively high accuracy in the majority of topology detection scenarios. However, it may not be suitable for detecting topologies in extremely complex LVDG. Besides, the quality of node measurement data also significantly influences the accuracy of topology detection. Therefore, this method requires further refinement and optimization.
The raw data supporting the conclusion of this article will be made available by the authors, without undue reservation.
YX: Data curation, Writing–review and editing. ZS: Writing–original draft. LF: Writing–original draft. YC: Writing–original draft. RH: Data curation, Writing–review and editing. QW: Writing–review and editing. JH: Writing–review and editing. MJ: Writing–review and editing.
The author(s) declare financial support was received for the research, authorship, and/or publication of this article. This research was funded by Science and Technology Projects of State Grid Zhejiang Electric Power Co. Ltd., grant number B311HZ230003.
Authors YX, ZS, LF, YC, RH, QW, JH, and MJ were employed by Hangzhou Power Supply Company of State Grid Zhejiang Electric Power Company.
All claims expressed in this article are solely those of the authors and do not necessarily represent those of their affiliated organizations, or those of the publisher, the editors and the reviewers. Any product that may be evaluated in this article, or claim that may be made by its manufacturer, is not guaranteed or endorsed by the publisher.
Alam, M., and Payami, S. (2023). A novel control-independent online fault diagnosis of interturn short circuits in SRMs using signal injection technique. IEEE Trans. Industrial Electron. 70, 2157–2167. doi:10.1109/TIE.2022.3169709
Azizivahed, A., Arefi, A., Ghavidel, S., Shafie-khah, M., Li, L., Zhang, J., et al. (2020). Energy management strategy in dynamic distribution network reconfiguration considering renewable energy resources and storage. IEEE Trans. Sustain. Energy 11, 662–673. doi:10.1109/TSTE.2019.2901429
Cao, D., Zhao, J., Hu, W., Liao, Q., Huang, Q., and Chen, Z. (2023). Topology change aware data-driven probabilistic distribution state estimation based on Gaussian process. IEEE Trans. Smart Grid 14, 1317–1320. doi:10.1109/TSG.2022.3204221
Chen, B., Wu, Q. H., Li, M., and Xiahou, K. (2023). Detection of false data injection attacks on power systems using graph edge-conditioned convolutional networks. Prot. Control Mod. Power Syst. 8, 16. doi:10.1186/s41601-023-00287-w
Jorjani, M., Seifi, H., and Varjani, A. Y. (2021). A graph theory-based approach to detect false data injection attacks in power system AC state estimation. IEEE Trans. Industrial Inf. 17, 2465–2475. doi:10.1109/TII.2020.2999571
Li, P., Wu, W., Wang, X., and Xu, B. (2023). A data-driven linear optimal power flow model for distribution networks. IEEE Trans. Power Syst. 38, 956–959. doi:10.1109/TPWRS.2022.3216161
Liu, G., Wang, M., Zhou, W., Wu, Q., and Fu, Y. (2021). A sensorless current balance control method for interleaved boost converters based on output voltage ripple. IEEE Trans. Power Electron. 36, 7138–7149. doi:10.1109/TPEL.2020.3037650
Liu, Y., Li, Z., and Zhao, J. (2022). Robust data-driven linear power flow model with probability constrained worst-case errors. IEEE Trans. Power Syst. 37, 4113–4116. doi:10.1109/TPWRS.2022.3189543
Memmel, E., Steens, T., Schlüters, S., Völker, R., Schuldt, F., and Von Maydell, K. (2023). Predicting renewable curtailment in distribution grids using neural networks. IEEE Access 11, 20319–20336. doi:10.1109/ACCESS.2023.3249459
Niu, L., Wu, G., and Xu, Z. (2021). Single-phase fault line selection in distribution network based on signal injection method. IEEE Access 9, 21567–21578. doi:10.1109/ACCESS.2021.3055236
Orlando, M., Estebsari, A., Pons, E., Pau, M., Quer, S., Poncino, M., et al. (2022). A smart meter infrastructure for smart grid IoT applications. IEEE Internet Things J. 9, 12529–12541. doi:10.1109/JIOT.2021.3137596
Srinivas, V. L., and Wu, J. (2022). Topology and parameter identification of distribution network using smart meter and µPMU measurements. IEEE Trans. Instrum. Meas. 71, 1–14. doi:10.1109/TIM.2022.3175043
Tang, Z., Ekomwenrenren, E., Simpson-Porco, J. W., Farantatos, E., Patel, M., Haddadi, A., et al. (2023). Data-driven extension of measurement-based fast coordinated voltage control for transmission grids. IEEE Trans. Power Syst. 38, 948–951. doi:10.1109/TPWRS.2022.3220056
Wang, B., Liu, Y., Lu, D., Yue, K., and Nie, Y. (2023b). Unsynchronized parameter-free fault location for two or three terminal double-circuit transmission lines sharing the same tower via unscented kalman filter. IEEE Trans. Power Deliv. 38, 1731–1746. doi:10.1109/TPWRD.2022.3223410
Wang, C., An, J., and Mu, G. (2021). Power system network topology identification based on knowledge graph and graph neural network. Front. Energy Res. 8, 613331. doi:10.3389/fenrg.2020.613331
Wang, Y., Tang, J., Si, J., Xiao, X., Zhou, P., and Zhao, J. (2023a). Power quality enhancement in islanded microgrids via closed-loop adaptive virtual impedance control. Prot. Control Mod. Power Syst. 8, 10. doi:10.1186/s41601-023-00284-z
Wei, B., Zobiri, F., and Deconinck, G. (2022). Peer to peer flexibility trading in the voltage control of low voltage distribution network. IEEE Trans. Power Syst. 37, 2821–2832. doi:10.1109/TPWRS.2021.3124790
Xue, A., Kong, H., Xu, F., Zhao, J., Chang, N., Chow, J. H., et al. (2023). Correction of time-varying PMU phase angle deviation with unknown transmission line parameters. CSEE J. Power Energy Syst. 9, 315–325. doi:10.17775/CSEEJPES.2021.07280
Zhang, J., Wang, Y., Weng, Y., and Zhang, N. (2020). Topology identification and line parameter estimation for non-PMU distribution network: a numerical method. IEEE Trans. Smart Grid 11, 4440–4453. doi:10.1109/TSG.2020.2979368
Keywords: low-voltage distribution grid, topology detection, virtual impedance, double hidden layer recurrent neural network, power flow mapping
Citation: Xuan Y, Sun Z, Fan L, Chen Y, Han R, Wang Q, Huang J and Jin M (2023) Virtual impedance based low-voltage distribution grid topology detection using double hidden layer recurrent neural network. Front. Energy Res. 11:1292095. doi: 10.3389/fenrg.2023.1292095
Received: 11 September 2023; Accepted: 30 October 2023;
Published: 09 November 2023.
Edited by:
Bin Zhou, Hunan University, ChinaReviewed by:
Changsen Feng, Zhejiang University of Technology, ChinaCopyright © 2023 Xuan, Sun, Fan, Chen, Han, Wang, Huang and Jin. This is an open-access article distributed under the terms of the Creative Commons Attribution License (CC BY). The use, distribution or reproduction in other forums is permitted, provided the original author(s) and the copyright owner(s) are credited and that the original publication in this journal is cited, in accordance with accepted academic practice. No use, distribution or reproduction is permitted which does not comply with these terms.
*Correspondence: Yi Xuan, eWl4dWFuc2djY0BvdXRsb29rLmNvbQ==
Disclaimer: All claims expressed in this article are solely those of the authors and do not necessarily represent those of their affiliated organizations, or those of the publisher, the editors and the reviewers. Any product that may be evaluated in this article or claim that may be made by its manufacturer is not guaranteed or endorsed by the publisher.
Research integrity at Frontiers
Learn more about the work of our research integrity team to safeguard the quality of each article we publish.