- School of Business, Shanghai Dianji University, Shanghai, China
Introduction: With the development of the energy market and the gradual rise of emerging market players, the linkage of interests between energy sources and loads in the Integrated Energy System (IES) has become increasingly complex. Additionally, the reliability of the system has been impacted by the growing proportion of renewable energy output.
Methods: To address the challenges posed by the above issues. This paper first proposes an operational strategy for an integrated energy system that incorporates the uncertainty of wind and solar output using a master-slave game approach. To enhance system robustness and cost-effectiveness, the paper introduces the information gap decision theory (IGDT). Second, building on this foundation, the system operator is considered as the leader, adding a tiered carbon trading mechanism and cloud energy storage system, and building a system revenue maximization model. Then, the user is regarded as the follower, and an optimization model is developed based on integrated demand response (IDR). Finally, the two-layer model is converted into a mixed-integer linear programming problem (MILP) to be solved by the Karush-Kuhn-Tucker conditions (KKT) combined with the big M method.
Results: The analysis of the example shows that according to the difference of the decision maker’s attitude towards risk, different scheduling schemes can be obtained through the two perspectives of risk-seeking and risk-avoiding, which can provide guidance for the dynamic operation of the system, and at the same time, the users can be guided by the energy differentials to reasonably use the energy under this strategy.
Discussion: Therefore, the proposed strategy in this paper can balance the economy and robustness of the system.
1 Introduction
As conventional fossil fuels continue to deplete, the importance of transitioning to low-carbon alternatives has become increasingly evident. The integrated energy system (IES), which serves as a comprehensive system that integrates various energy sources within a confined space, is emerging as an imperative choice for the ongoing energy revolution and contemporary development (Canhuang et al., 2018). The IES not only facilitates seamless integration and optimization of various energy sources in terms of extraction, conversion, storage, transport, and utilization but also effectively caters to the energy demands of the load side. With its inherent reliability, flexibility, and superior energy efficiency, the IES has emerged as a pivotal field of study in the realm of energy research (Yu et al., 2016). At the same time, the IES has gradually become a research hotspot because of its great advantages in energy management. Several scholars have made significant contributions to energy management in the past. An energy management strategy using a price-based DR program is developed for IoT-enabled residential buildings (Hafeez et al., 2020). Saleem et al. (2022) offered the design, deployment, implementation, and performance evaluation of an IoT-based SEMS to manage energy on the demand side.
Research on benefit distribution and power supply reliability in the context of the IES has gained considerable attention as a prominent research focus. As the IES continues to evolve and the energy market experiences significant growth, the interdependency between energy sources and loads becomes increasingly intricate. The energy transactions and supply–demand relationships between these sources and loads play a fundamental role in optimizing the operation of the IES. Coordinating the interests of multiple decision-making entities to achieve optimal IES operation has emerged as a significant and challenging topic. Traditional optimization theory predominantly tackles decision problems involving a single agent. However, it faces difficulties in capturing the complex interplay among multiple agents and addressing multi-agent decision problems. Consequently, the advent of the master–slave game provides a viable solution to overcome this obstacle (Lu et al., 2014). During the energy trading process, the system operator establishes the energy price, while the user adjusts their demand in response to this price. This sequential interaction between the two parties lends itself to be effectively described using a master–slave game framework.
Several scholars in previous studies have contributed greatly to the study of the master–slave game aspect of IESs. Xiang et al. (2021) simultaneously considered the initiative of supply-side and demand-side market players and proposed an interactive framework for the IES, which realized the interactive optimization of the system operators and users. Based on the master–slave game framework, Sun et al. (2021) proposed a demand response mechanism based on price incentives and established a user utility model and an aggregator revenue model considering user preferences. Wang et al. (2020) proposed a distributed co-optimized operation strategy for integrated community energy systems based on master–slave games, aiming to enhance revenues on the supply-side and consumer surplus on the energy-using side. However, most of the aforementioned studies only focus on achieving economic optimality of the system from an economic point of view and lack consideration of uncertainty.
As the share of renewable energy generation continues to rise, the inherent stochastic and fluctuating characteristics of these sources introduce significant uncertainties to the system. This uncertainty poses challenges in accurately predicting generation power and load, which, in turn, affects the development of precise scheduling plans. Consequently, it becomes imperative to explore the reliability assessment and uncertainty mitigation strategies for the IES. Extensive scholarly research has been conducted in the past to investigate the IES and its reliability. Bao et al. (2023) and Hui et al. (2022) presented the function of energy storage and microgrids in energy hubs and industrial parks. Wang et al. (2023a) focused on the operational reliability evaluation of the urban multi-energy system, considering the incorporation of equivalent energy storage. Wang et al. (2023b) proposed an operational reliability evaluation framework for the IES, considering flexibilities from both the demand side and transmission system. The aforementioned literature has refined the modeling and methodology for energy systems.
Existing studies have produced some research results in the area of uncertainty in IESs (Yang et al., 2022). Currently, there are two main approaches to the uncertainty problem, one is stochastic programming and the other is robust optimization. Stochastic optimization generally uses probabilistic means to describe various types of random variables, simulates the probability distribution function of the variables based on day-ahead forecast data, and generates simulation scenarios to solve the problem (Birge and Louveaux, 2011). For uncertainty in a system, the method identifies it as a random parameter that can be described by a probability function (Mavromatidis et al., 2018). A stochastic programming model has been devised to address the wind power uncertainty and optimize system cost minimization (Li et al., 2018). In order to fully exploit the relationship between flexibility and uncertainty in electrothermal energy storage, a two-stage stochastic programming model is raised to improve the economy and reliability of the system (Lei et al., 2019). Zhao et al. (2020) considered wind, light, and load uncertainties and developed stochastic planning models based on long time-scales. However, the modeling of such uncertainties is highly demanding in terms of obtaining accurate probability density distributions, which will be greatly limited by the maturity of the information on the statistical probability branch of data collection (Xuefei et al., 2022). Stochastic programming methods are computationally intensive and time-consuming, making it difficult to obtain accurate probability distribution models. Moreover, the optimization results may lack robustness and pose risks to the system’s operation. It is clear that this approach has certain limitations when evaluated.
Another common method to overcome uncertainty is robust optimization, which does not have a demand for the probability distribution of uncertainty (Zhang et al., 2019). The variations in load and the energy output under extreme conditions are considered, and an innovative two-stage robust optimization model for the day-ahead scheduling of IES is constructed (Zun et al., 2019). Chen et al. (2012) combined robust optimization with interval programming and established an interval stochastic robust optimization method to solve carbon trading and energy system planning problems. Considering the uncertainty of load demand, Yang and Su (2021) proposed a two-stage robust optimization framework for enhancing the operational efficiency of the power station under the condition of satisfying the robustness and economy of the power plant. Chen et al. (2021) considered the source-load uncertainty and utilized robust optimization methods to fulfill the optimal economic dispatch of microgrids about integrated energy. Zhai et al. (2022) and Chen et al. (2023) introduced more concepts regarding the optimization methods. Wu et al. (2022) developed an optimal RIES operation strategy based on distributing robust games, considering demand response. However, Zou et al. (2019) stated that the robust optimization methods generally focus on extreme cases, requiring constraints to be satisfied in the extreme scenario, and the resulting optimization results are often too conservative, which results in certain economic losses and lacks applicability.
Furthermore, the majority of current research on optimizing the IES primarily focuses on configurations involving physical energy storage devices. However, in practical scenarios, investing in low-capacity physical energy storage results in higher unit investment costs. Additionally, these energy storage devices may remain idle during peak periods of non-energy usage, leading to potential resource wastage. In response to this challenge, the concept of cloud energy storage (CES) has emerged in recent years, largely inspired by the rise and expansion of the sharing economy (Liu et al., 2017). CES brings a new solution to the above problems.
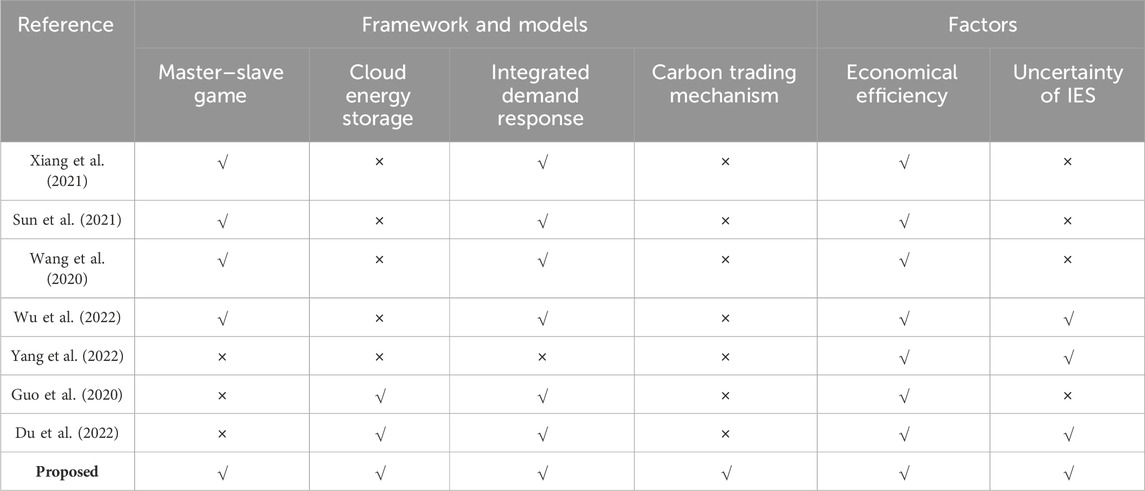
Table 1 lists some of the comparisons in the literature. It can be seen that the majority of the current study focuses primarily on optimizing the system from an economic standpoint while lacking consideration for the potential effects brought about by various uncertainties within the system. At the same time, common approaches to uncertainty resolution, such as stochastic programming, often rely heavily on data acquisition. However, these methods face challenges such as intensive computation and slow solution speed. Robust optimization often leads to overly conservative solution results due to its emphasis on extreme cases. Therefore, the above approach has certain limitations. Moreover, most of the existing studies usually treat uncertainty solely as a negative factor, ignoring its potential benefits. Meanwhile, this paper introduces CES systems to replace traditional energy storage devices and innovate the system model. Based on the deficiencies found in the aforementioned studies, the objective of this study is to optimize the economy and reliability of the system within the framework of a master–slave game while taking into account the uncertainties associated with the output of renewable energy. The main contributions of this study are presented below.
(1) In order to better capture the mutual interests between system operators and users, this study proposes an IES master–slave game scheduling model considering the stepped carbon-trading mechanism and integrated demand response, which can further reduce carbon emissions while improving the economic benefits of the system.
(2) The CES system is used to replace the traditional energy storage device, and the effect of the traditional energy storage device can be realized by paying a small amount of leasing fee, which further reduces the system cost and improves the consumption rate of renewable energy.
(3) The information-gap decision theory (IGDT) is introduced to describe the uncertainty of renewable energy, which overcomes the limitation of regarding the uncertainty purely as a negative factor in traditional research. Different scheduling schemes are obtained from the perspectives of risk aversion and risk pursuit, and the system benefits are analyzed to ensure the robustness of the system while taking into account the economy of the system.
In this paper, we prove the existence and uniqueness of the proposed Stackelberg equilibrium under the above model and methodology. The two-layer model proposed in this paper can be converted to a single-layer model by the KKT condition and the Big M method. Finally, we compare the benefits of the system under the deterministic model, the risk-averse model, and the risk-seeking model through an example analysis.
2 Basic framework of IES with cloud energy storage
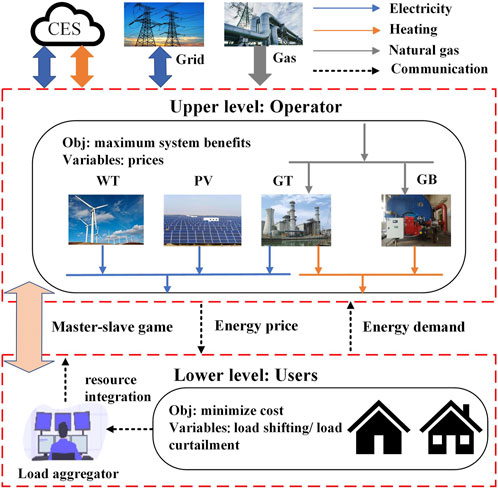
The depicted framework of the IES is presented in Figure 1. At the highest level of the IES, the distribution system operator (DSO) serves as the system operator and encompasses various components, including a wind power and photovoltaic generation system, a gas turbine (GT), a gas boiler (GB), and a CES system.
The role of the DSO as an intermediary between the higher grid and the end-users is to optimize revenue generation by capitalizing on the price difference through energy trading. Additionally, the DSO has the advantage of offering more flexible energy prices to customers in comparison to the grid. However, due to the limited power capacity of individual users, they do not meet the minimum requirements for direct market trading. To address this issue, this study introduces a load aggregator (LA), which consolidates individual users into a lower-level entity within the IES. The primary objective of the LA is to minimize its own costs.
The LA assumes the responsibility of conveying the energy prices determined by the DSO to the users. Furthermore, it collects real-time feedback on the users’ energy demands after implementing demand response measures and relays this information to the upper-level operator. This iterative process allows for the further optimization of the DSO units’ output while simultaneously influencing the formulation of subsequent energy prices by the operator. This dynamic interaction continues until an equilibrium state is achieved.
3 Model formulations of the IES
3.1 Upper-level operator model
3.1.1 The tiered carbon-trading mechanism
The tiered carbon-trading mechanism will be used to further reduce the system’s carbon emissions. Here, the actual carbon emissions minus the emission allowances are equal to the carbon emission credits to be purchased.
where
The carbon trading cost of this paper is divided into three intervals; with more CO2 emissions beyond the limit, the cost of the corresponding part will increase, and the cost model is outlined as follows:
where
3.1.2 Electric/thermal cloud energy storage system model
For IES, investing in small-capacity physical energy storage requires high investment costs. If the cloud electric energy storage (CEES) is utilized for IES, the energy storage effect can be achieved through leasing, which can not only reduce the high construction cost and dependence on the power grid but also avoid the disorder of charging and discharging of distributed energy storage. Consequently, it facilitates the efficient utilization of energy storage resources (Guo et al., 2020). We take the cloud power storage system as an example and list its relevant constraints as follows:
where
3.1.3 The objective function for the upper-level decision-maker
The primary objective of the DSO is to optimize its revenue generation by formulating prices for energy transactions with lower-level users to achieve arbitrage. Its objective function can be defined as follows:
where
where
3.1.4 Constraints of DSO
The main equipment within the operator’s system includes the following: renewable energy generation systems (wind and PV), micro GTs, GBs, and interaction constraints with the external grid. The specific constraints are listed below:
(1) New energy output constraints
where
(2) GT and GB constraints
While the GT consumes natural gas to produce electricity, the resulting high-temperature waste-heat gas flows through a waste-heat recovery unit to be recovered and then passed through a heat exchanger to produce heat.
where
(3) Energy price constraints
Energy prices are set by the DSO for the users as
where
(4) Electrical and thermal power balance constraints
where
3.2 Lower-level user model
3.2.1 The objective function for lower-level users
In IES, the LA acts as a representative of the interests of the user’s controllable resource aggregation, enabling flexible leveling or curtailment of load demand response under its management. Users, on the other hand, optimize their own energy use on the basis of the energy price set by the DSO to reduce the cost of energy use and provide feedback on their real-time energy demand to the DSO through the LA. The user cost can be expressed as follows:
where
Only considering the energy purchase cost of the users and satisfaction loss as representation parameters for user interests lacks a certain degree of rationality, especially for industrial and commercial users. Energy consumption implies profit generation, especially in the context of industry and business. Therefore, considering the above factors, this paper expresses the user’s energy utility as follows (Jiang et al., 2021):
where
Previous studies have shown that the user’s comfort before the demand response is the best. When users receive instructions from the LA to adjust energy usage in different time periods, it may lead to a certain degree of user satisfaction loss. Therefore, the loss of user satisfaction in this paper can be expressed as follows (Li et al., 2021):
where
3.2.2 Constraints of the user
(1) Electrical load constraints
The effect of peak shaving and valley filling can be achieved by adjusting the electric load of the user’s energy use time, and the transferable electric load should ensure that the total load before and after the demand response remains unchanged and, at the same time, meet the upper and lower constraints. Where
where
(2) Heat load constraints
The heat load can be reduced by a certain percentage within the user’s energy comfort level.
where
(3) Power balance constraints for loads
where
4 Models of IES based on IGDT
Typically, there is some error in the source load prediction of the system, which often leads to a large deviation between the day-ahead schedule and the actual situation, resulting in economic losses. IGDT is an effective optimization method to resolve the uncertainty problem (Wang et al., 2018). The IGDT model needs to set the target of the expected cost or expected benefit in advance and has two models, risk avoidance and risk pursuit, so that it can achieve good results for the system to be both robust and economical. Thus, this approach outperforms traditional robust optimization. In this paper, IGDT is used to model and analyze the factors of uncertainty in the day-ahead dispatch schedule. In the following, we use
Traditional robust optimization requires consideration of the exact upper and lower bounds on the input variables. In contrast, the IGDT makes the input of uncertainty parameters an imprecise set by introducing a bias factor and describes uncertainty through the uncertainty set of some non-probabilistic models, such as the envelope model, fractional uncertainty model, and ellipsoid model (Mehdizadeh et al., 2018). In this paper, we adopt a fractional uncertainty model based on the characteristics of uncertainty, with the basic model as follows.
where
Changes in uncertainty factors and decision-makers’ attitudes toward risk will affect the system’s final revenue and dispatch strategies. Therefore, according to the IGDT principle, it is divided into the robust model (RM) of risk aversion and the opportunity model (OM) of risk pursuit. The RM is conservative, while the OM is speculative. The fundamental model of IGDT is as follows.
In the context provided,
4.1 Robust IGDT model based on risk aversion
The RM believes that uncertainty will adversely affect the operation schedule and typically maximizes the adverse perturbation of uncertain parameters with respect to wind and PV. Under risk-averse scheduling decisions, IES is expected to achieve robust optimization while ensuring the desired economic objectives. In other words, when there is severe uncertainty (the maximum value of uncertain parameter fluctuations), the RM must ensure that it is stable when fluctuating within U. It can make the revenue target value within the expected target revenue range. Thus, a robust IGDT dispatch model based on risk avoidance is constructed as follows:
where
Similarly, the PV output uncertainty model is considered, where the uncertainties in wind and PV power are assumed to be equal, each accounting for 50% of the overall uncertainty.
4.2 Opportunity IGDT model based on risk pursuit
The OM believes that uncertainty may bring additional benefits to the system and has the opportunity to further reduce the dispatch cost of the system. As a result, adverse perturbations to the uncertain parameters of wind power and PV output are usually minimized. In the case of risk-seeking scheduling decisions, the system defaults to the positive impact of uncertainty. In this case, it is more inclined to maximize returns by reducing
where
5 Example analysis
The two-layer Stackelberg game model for the IES introduced in this paper uses the stagnation point approach. First, we formulate the KKT system for the lower-follower cost-minimization problem. The KKT system is then treated as a constraint in the upper-level optimization problem. Utilizing the Big M method and incorporating Boolean variables, the two-layer model is transformed into a single-layer model for resolution. Finally, the systematic uncertainties are modeled and analyzed. The proposed method and model are modeled and solved through MATLAB using the YALIMP language in combination with the Gurobi solver. The solution process can be divided into two following parts:
(1) The solution procedure for decoupling the two-tier model is detailed in Supplementary Appendix (B).
(2) The IGDT model solution considering renewable energy output uncertainty.
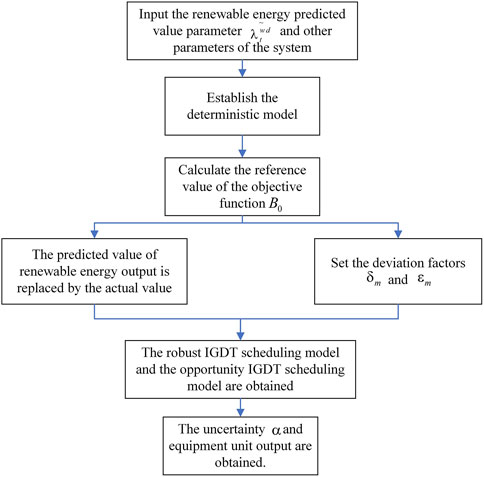
Here, the solution process for the IGDT model is as follows:
Step 1:. Solve the deterministic model under the condition that the renewable output is the predicted value
Step 2:. First replace the original predicted value with the actual value of renewable output
Step 3:. Solve for the uncertainty
The solution flow is shown in Figure 2.
5.1 Uncertainty and benefit analysis under risk aversion and risk-pursuing strategies
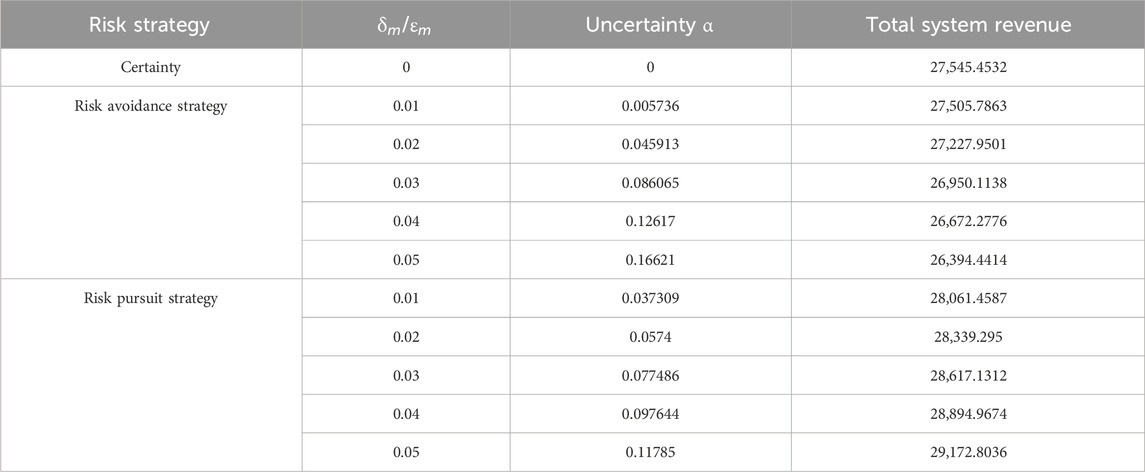
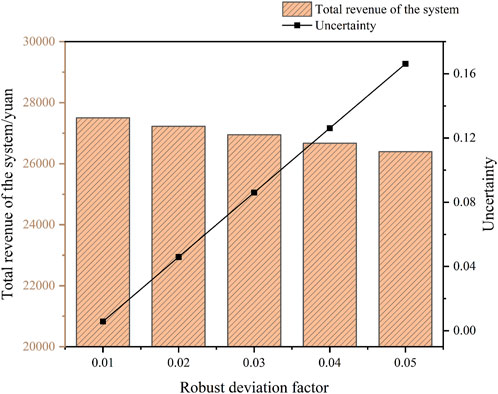
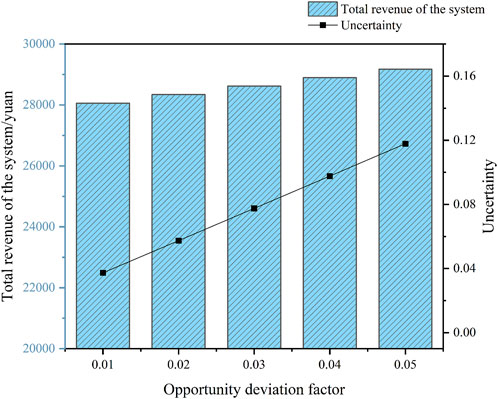
Table 2 shows the results of the total system return changing with
Under the risk avoidance strategy, the robust bias factor is directly proportional to the level of uncertainty and inversely proportional to the total system revenue. This is because under the robust model, the system decision-maker believes that in this biased direction, the uncertainty factor will have a negative effect on the system. The larger
5.2 Analysis of optimization results under the deterministic model
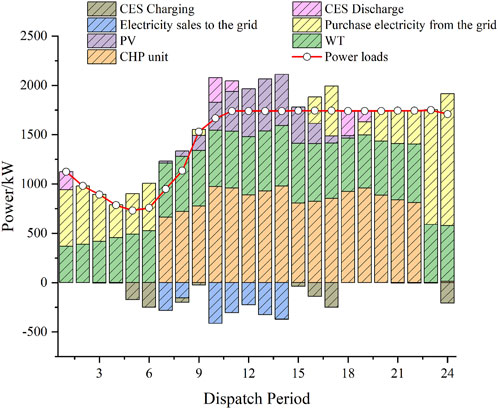
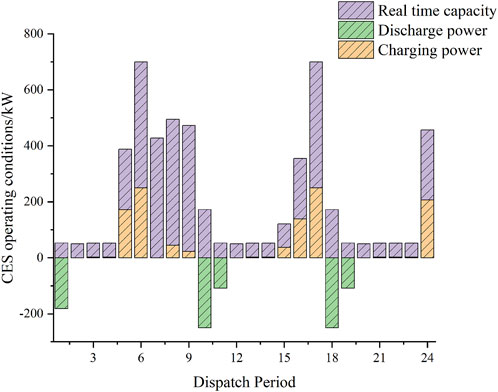
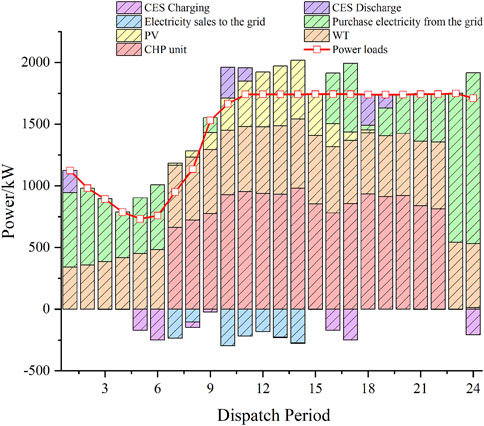
As shown in Figure 5, under the deterministic model, the system will reduce the amount of power purchased from the external grid and increase the output of the CHP units to meet the demand of the electricity load in the case of higher electricity pricing, thereby reducing the operating costs. During 10:00–16:00, when the renewable energy output is relatively high, the CHP units will preferentially meet the heat load demand accordingly and reduce some of the generation output. In other words, the CHP unit will mainly produce heat power during this period. As shown in Figure 6, the CES system is charged during periods of low electricity prices, such as 5:00–6:00 and 15:00–17:00, while it is discharged during 10:00–11:00 and 18:00–19:00. Discharging occurs during intervals characterized by elevated electricity prices, which further reduces system costs through this operating mode. It can be found that CES can fully realize the energy storage effect of traditional physical energy storage devices. When the wind power and photovoltaic output is large during periods such as 7:00–8:00 and 10:00–14:00, the DSO can sell the excess electric power to the grid, realizing the consumption of renewable energy and improving the system revenue.
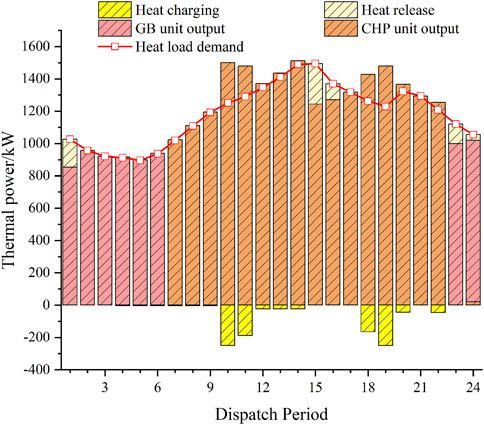
Figure 7 shows that the heat output of the CHP unit occurs primarily during the daytime hours and is supplemented by GBs when the output is insufficient at night. The operation mode of CEES is also adopted in the cloud heat storage system.
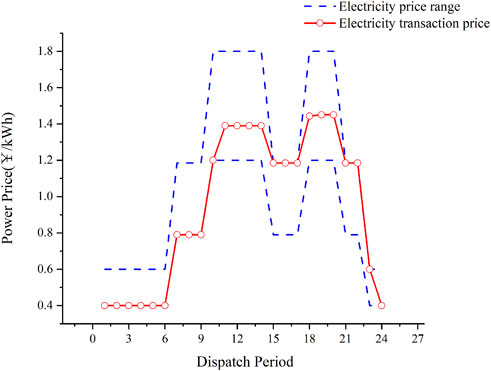
Figure 8 and Figure 9 show that the DSO can formulate a more flexible electricity price relative to the grid under the deterministic model, and the established electricity price is consistent with the trend of the time-of-use electricity price of the power grid, thereby reducing the user’s energy purchase cost. Users formulate their own energy consumption strategies on the basis of the electricity prices set by DSO and transfer part of the electricity load to periods of relatively low electricity prices between 12:00–15:00 and 18:00–20:00 to minimize their own costs. From this, we can see that the optimized user power load demand is reduced to varying degrees throughout the day. It is evident that the load-side flexibility has been enhanced through integrated demand response.
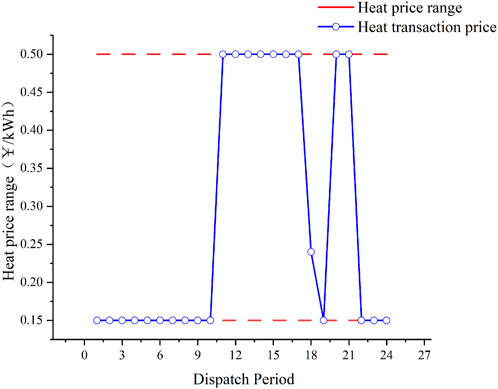
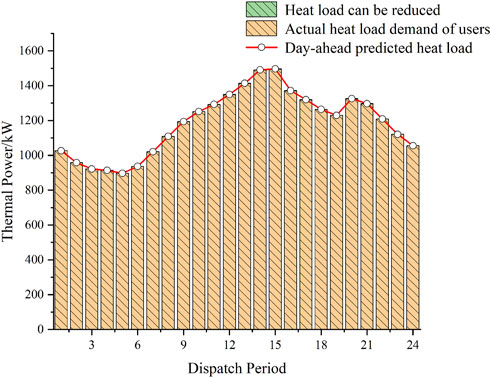
Figure 10 shows that due to the large thermal load demand of users during the 12:00–15:00 noon and 20:00–22:00 evening hours, the DSO sets relatively high thermal prices, while the prices are relatively low during other periods. As shown in Figure 11, in general, the user’s comfort level is the highest before the demand response. Since the lower-load model adds a penalty cost for the decrease in user satisfaction due to heat load reduction, users generally do not choose to take the initiative to reduce their heat load, or the heat load reduction is small when the system can meet the heat load power supply.
5.3 Comparative analysis of revenue and renewable energy output
Given the uncertain nature of wind and solar output, in this paper, we define the fluctuation range of wind and solar output as uncertainty and then set the bias factor to obtain decision plans for decision-makers with different risk preferences. Taking the bias factor
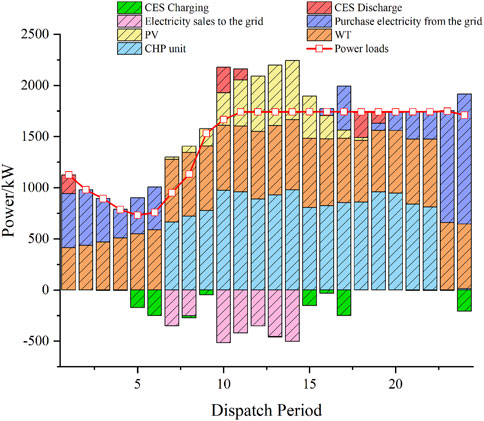
From Figures 5, 12, and 13, it can be seen that the moment of maximum PV output is also the time of day when the renewable energy output is the highest, i.e., 10:00–14:00. Table 3 compares the total power of the renewable energy output and the power sold by the system to the external grid during this time period. It can be found that under the RM, the system treats the uncertainty as a negative factor, and both the wind and PV output are reduced, while the system’s power sales to the external grid are also reduced. In contrast, under the OM, the system perceives that uncertainty is expected to lead to a higher revenue, and its effect is positive. As a result, both the wind and PV output of the system increase compared to the case under the deterministic model, and the electricity sales to the external grid increase accordingly.
Table 4 lists the comparison of the system benefits and costs under the deterministic, risk-averse, and risk-seeking models, respectively. Under the risk aversion strategy, with an uncertainty of 0.17, the total system return is ¥ 26,394.44, which means that when the wind and light output fluctuate within the uncertainty range of positive 0.17 and below, the total system return can be guaranteed to be not less than ¥ 26,394.44. Under the risk-seeking strategy, with an uncertainty of 0.12, the total system return is ¥ 29,172.80, which means that the total system return is guaranteed to be no less than ¥ 29,172.80 when the wind and light outputs fluctuate within an uncertainty range of negative 0.12 and above.
Since the renewable energy output is mainly reflected in the power supply side of the system, the electric power balance diagram of the system operator under the deterministic model, RM, and OM is analyzed.
Figure 12 illustrates the electric power balance within the system operator when employing the risk-averse strategy. In this operation mode, the goal is to obtain the system revenue in the worst case, so the output of wind and photovoltaic power experiences significant reductions in comparison to that in the deterministic model. Therefore, the need to make power purchases from the grid to satisfy the power balance of the system still exists during the time period of 9:00–16:00 when the wind and light outputs are high, which increases the cost of interacting with the external grid by ¥ 1,124.2844 and decreases the total system revenue by ¥ 1,151.0118 compared to the cost of interacting with the external grid under the deterministic model.
Figure 13 shows the system operator’s electric power balance under the risk-seeking strategy. The system goal under this operating mode is to obtain the revenue with the least uncertainty, so the system’s overall revenue is the largest in this situation. Therefore, the output of renewable energy is greater in the 7:00–19:00 time period than that under the deterministic model, and, at the same time, in the 7:00–18:00 time period, the excess electricity generated by renewable energy is sold to the grid to obtain more revenue, and the system requires purchasing electricity from the grid only in part of the night time. As can be seen from Table 4, the cost of interaction between the system and the external grid is reduced by ¥1,574.7742, and the overall benefit of the system is increased by ¥1,627.3504 compared to that of the deterministic model.
Based on the above analysis, it is clear that utilizing the IGDT approach provides the system decision-maker with the ability to select an appropriate scheduling strategy based on varying risk attitudes. By appropriately adjusting the bias factor, the system can effectively achieve the desired economic benefits while ensuring robustness.
6 Conclusion
In order to fully take into account the interplay of the interests of the various actors in the IES and reduce the effect of uncertainties in the renewable energy output of the system, this paper first proposes a master–slave game model of an IES that considers the uncertainty in wind and solar output based on the Stackelberg game. The model treats the system operator as the leader of the upper tier, and the LA represents the subscribers as the followers of the lower tier. The two-layer model is transformed into a single-layer mixed-integer linear programming problem, which is solved by the KKT condition combined with the Big M method. The proposed method was tested and the results showed the following:
1) The model and methodology proposed in this paper can effectively describe the interaction of interests between the system operators and users. The energy transaction price is set for the lower users by the upper DSO to promote the users to carry out the integrated demand response, which, in turn, affects the decision-making of the upper operators and promotes them to optimize their own unit output to maximize their benefits. This model can greatly improve the flexibility of the system.
2) The CES system is added to replace the traditional energy storage equipment and devices. According to the analysis of the example, the system can achieve the same effect as the traditional energy storage equipment only by paying a small amount of rental cost, that is, the CES charges, when the energy price is low and discharges to the system when the energy price is high, thus greatly reducing the operating cost of the system.
3) The IGDT is introduced to describe the uncertainty of wind and solar output. Two different models are developed based on the difference in the attitude of decision-makers toward risk. Under the risk-seeking strategy, the system is able to take full advantage of favorable uncertainty factors, which enables the system to achieve a larger return. Under the risk-averse strategy, the system can guarantee a certain expected return while guaranteeing its own robustness. Thus, this approach can make the system both robust and economical.
Future work will focus on investigating the shared energy storage among multiple subjects and the influence of the customer-side load uncertainty.
Data availability statement
The original contributions presented in the study are included in the article/Supplementary Material; further inquiries can be directed to the corresponding author.
Author contributions
XZ: writing–original draft and writing–review and editing. JS: supervision and writing–review and editing.
Funding
The author(s) declare that no financial support was received for the research, authorship, and/or publication of this article.
Conflict of interest
The authors declare that the research was conducted in the absence of any commercial or financial relationships that could be construed as a potential conflict of interest.
Publisher’s note
All claims expressed in this article are solely those of the authors and do not necessarily represent those of their affiliated organizations, or those of the publisher, the editors, and the reviewers. Any product that may be evaluated in this article, or claim that may be made by its manufacturer, is not guaranteed or endorsed by the publisher.
Supplementary material
The Supplementary Material for this article can be found online at: https://www.frontiersin.org/articles/10.3389/fenrg.2023.1291728/full#supplementary-material
References
Bao, M., Hui, H., Ding, Y., Sun, X., Zheng, C., and Gao, X. (2023). An efficient framework for exploiting operational flexibility of load energy hubs in risk management of integrated electricity-gas systems. Appl. Energy 338, 120765. doi:10.1016/j.apenergy.2023.120765
Birge, J. R., and Louveaux, F. (2011). Introduction to stochastic programming. Berlin, Germany: Springer Science & Business Media.
Canhuang, Z., Jiehui, Z., Zhaoxia, J., Qinghua, W., and Xiaoxin, Z. (2018). Multi-objective optimal design of integrated energy system for park-level microgrid.
Chen, J. J., Qi, B. X., Rong, Z. K., Peng, K., Zhao, Y. L., and Zhang, X. H. (2021). Multi-energy coordinated microgrid scheduling with integrated demand response for flexibility improvement. Energy 217, 119387. doi:10.1016/j.energy.2020.119387
Chen, C., Li, Y. P., Huang, G. H., and Li, Y. F. (2012). A robust optimization method for planning regional-scale electric power systems and managing carbon dioxide. Int. J. Electr. Power & Energy Syst. 40, 70–84. doi:10.1016/j.ijepes.2012.02.007
Chen, X., Zhai, J., Jiang, Y., Ni, C., Wang, S., and Nimmegeers, P. (2023). Decentralized coordination between active distribution network and multi-microgrids through a fast decentralized adjustable robust operation framework. Sustain. Energy, Grids Netw. 34, 101068. doi:10.1016/j.segan.2023.101068
Du, J., Han, X., Li, T., Yin, Z., and Bai, H. J. P. S. T. (2022). Optimization strategy of multi microgrid electric energy cooperative operation considering electricity price uncertainty and game cheating behaviors.
Guo, Y., Wang, C., Shi, Y., Guo, C., Shang, J., and Yang, X. (2020). Comprehensive optimization configuration of electric and thermal cloud energy storage in regional integrated energy system.
Hafeez, G., Wadud, Z., Khan, I. U., Khan, I., Shafiq, Z., Usman, M., et al. (2020). Efficient energy management of IoT-enabled smart homes under price-based demand response program in smart grid. Sensors (Basel) 20, 3155. doi:10.3390/s20113155
Hui, H., Bao, M., Ding, Y., and Song, Y. (2022). Exploring the integrated flexible region of distributed multi-energy systems with process industry. Appl. Energy 311, 118590. doi:10.1016/j.apenergy.2022.118590
Jiang, A., Yuan, H., and Li, D. (2021). Energy management for a community-level integrated energy system with photovoltaic prosumers based on bargaining theory. Energy 225, 120272. doi:10.1016/j.energy.2021.120272
Lei, J., Guo, Z., and Chen, C. (2019). Two-stage planning-operation co-optimization of IES considering uncertainty and electrical/thermal energy storage.
Li, P., Wu, D., Li, Y., Liu, H., Wang, N., and Zhou, X. (2021). Optimal dispatch of multi-microgrids integrated energy system based on integrated demand response and stackelberg game. Proc. CSEE, 1307–1321. doi:10.13334/j.0258-8013.pcsee.201845
Liu, J., Zhang, N., Kang, C., Kirschen, D., and Xia, Q. (2017). Cloud energy storage for residential and small commercial consumers: a business case study. Appl. Energy 188, 226–236. doi:10.1016/j.apenergy.2016.11.120
Li, Z., Wang, C., Liang, J., Zhao, P., and Zhang, Z. (2018). Expansion planning method of integrated energy system considering uncertainty of wind power.
Lu, Q., Chen, L., and Mei, S. 2014. Typical applications and prospects of game theory in power system. Zhongguo Dianji Gongcheng Xuebao/Proceedings Chin. Soc. Electr. Eng., doi:10.13334/j.0258-8013.pcsee.2014.29.00234, 5009–5017.
Mavromatidis, G., Orehounig, K., and Carmeliet, J. (2018). Design of distributed energy systems under uncertainty: a two-stage stochastic programming approach. Appl. Energy 222, 932–950. doi:10.1016/j.apenergy.2018.04.019
Mehdizadeh, A., Taghizadegan, N., and Salehi, J. (2018). Risk-based energy management of renewable-based microgrid using information gap decision theory in the presence of peak load management. Appl. Energy 211, 617–630. doi:10.1016/j.apenergy.2017.11.084
Saleem, M. U., Usman, M. R., Usman, M. A., and Politis, C. (2022). Design, deployment and performance evaluation of an IoT based smart energy management system for demand side management in smart grid. IEEE Access 10, 15261–15278. doi:10.1109/access.2022.3147484
Sun, W., Liu, X., Xiang, W., and Li, H. (2021). Master-slave game based optimal pricing strategy for load aggregator in day-ahead electricity market.
Wang, C., Wei, H., and Wu, S. J. P. C. (2018). Multi-power combined unit commitment based on information gap decision theory.
Wang, H., Li, K., Zhang, C., and Ma, X. (2020). Distributed coordinative optimal operation of community integrated energy system based on Stackelberg game.
Wang, S., Hui, H., Ding, Y., Ye, C., and Zheng, M. (2023a). Operational reliability evaluation of urban multi-energy systems with equivalent energy storage. IEEE Trans. Industry Appl. 59, 2186–2201. doi:10.1109/tia.2022.3232099
Wang, S., Zhai, J., Hui, H., Ding, Y., and Song, Y. (2023b). Operational reliability of integrated energy systems considering gas flow dynamics and demand-side flexibilities. IEEE Trans. Industrial Inf., 1–13. doi:10.1109/tii.2023.3275712
Wu, H., Liu, Y., Yang, Q., Xu, L., and Zhong, L. (2022). Optimal RIES operation strategy based on sistributionally robust game considering demand response.
Xiang, E., Gao, H., Liu, C., Liu, Y., and Liu, J. (2021). Optimal decision of energy trading for community multi-energy operator based on game interaction with supply and demand sides.
Xuefei, Y., Shuai, Z., Linlin, L., and Jian, D. (2022). Carbon capture power plant scheduling based on information gap decision theory.
Yang, C., Fuyin, G., and Wuzhi, Z. (2022). Interval multi-objective optimal dispatch of integrated energy system under multiple uncertainty environment.
Yang, J., and Su, C. (2021). Robust optimization of microgrid based on renewable distributed power generation and load demand uncertainty. Energy 223, 120043. doi:10.1016/j.energy.2021.120043
Yu, D., Sun, X., Gao, B., and Xu, Q. (2016). Coordinated optimization model for wind power integration considering wind power uncertainty output.
Zhai, J., Wang, S., Guo, L., Jiang, Y., Kang, Z., and Jones, C. N. (2022). Data-driven distributionally robust joint chance-constrained energy management for multi-energy microgrid. Appl. Energy 326, 119939. doi:10.1016/j.apenergy.2022.119939
Zhang, R., Jiang, T., Bai, L., Li, G., Chen, H., Li, X., et al. (2019). Adjustable robust power dispatch with combined wind-storage system and carbon capture power plants under low-carbon economy. Int. J. Electr. Power & Energy Syst. 113, 772–781. doi:10.1016/j.ijepes.2019.05.079
Zhan, X., Yang, J., Han, S., Zhou, T., Wu, F., and Liu, S. (2021). Two-stage market bidding strategy of charging station considering schedulable potential capacity of electric vehicle.
Zhao, J., Yong, J., and Huan, J. (2020). Stochastic planning of park-level integrated energy system based on long time-scale.
Zou, Y., Yang, L., Li, J., Xiao, L., Ye, H., and Lin, Z. (2019). Robust optimal dispatch of micro-energy grid with multi-energy complementation of cooling heating power and natural gas.
Keywords: integrated energy system, master–slave game, uncertainty of wind and solar output, carbon trading mechanism, integrated demand response
Citation: Zhang X and Shen J (2024) Master–slave game operation scheduling strategy of an integrated energy system considering the uncertainty of wind and solar output. Front. Energy Res. 11:1291728. doi: 10.3389/fenrg.2023.1291728
Received: 10 September 2023; Accepted: 22 December 2023;
Published: 16 January 2024.
Edited by:
Minglei Bao, Zhejiang University, ChinaReviewed by:
Sheng Wang, University of Macau, ChinaChao Guo, Hangzhou City University, China
Yang Yu, North China Electric Power University, China
Copyright © 2024 Zhang and Shen. This is an open-access article distributed under the terms of the Creative Commons Attribution License (CC BY). The use, distribution or reproduction in other forums is permitted, provided the original author(s) and the copyright owner(s) are credited and that the original publication in this journal is cited, in accordance with accepted academic practice. No use, distribution or reproduction is permitted which does not comply with these terms.
*Correspondence: Jin Shen, c2hlbmppbjIwMDJAc2luYS5jb20=
 Xiaohan Zhang
 Jin Shen*