 Dong Wang
 Tingwei Fang
- Department of Finance, School of Finance, Shandong Technology and Business University, Yantai, China
Eliminating energy poverty is not only a prerequisite for escaping the “energy poverty trap” but also crucial to enhancing the welfare of residents and realising ecological civilization. Income inequality has become an essential challenge affecting China’s economic growth and social stability. By integrating Chinese household data for 2016, 2018, and 2020, a mixed-method approach of energy income response modeling, income inequality measurement modeling, and fixed panel modeling is used in this paper to explore the relationship between income inequality and household energy poverty. Further, the mechanism of income inequality on energy poverty and the poverty reduction effect of household income on energy poverty are explored. The results show that income inequality is significantly and positively correlated with household energy poverty, implying that widening income inequality leads to energy “poverty enhancement.” In terms of mechanisms, income inequality increases energy poverty by increasing households’ willingness to save and reducing energy consumption. The moderating effect analysis shows that the breadth of digital financial inclusion reduces the contribution of income inequality to household energy poverty. The increase in household income will increase the affordability of households, especially the increase in wage income and property income, which can help households lift themselves out of “energy poverty.” Therefore, creating sustainable digital ecosystems, incorporating sound government interventions, and providing diversified income channels are key to helping households escape energy poverty.
1 Introduction
As one of the main ecological problems facing the world in the present, energy poverty has grown to be a global issue in the twenty-first century, and it is usually defined as the lack of availability, accessibility, and affordability of energy (Zhang et al., 2021; Zhao et al., 2021; Hong et al., 2022). The IEA (International Energy Agency) released a report in 2021 stating that 2.64 billion people globally depend on traditional biomass, and 1.26 billion people lack regular access to electricity, mainly in underdeveloped areas of Asia and Africa. In the shadow of the dollar overdraft and global economic recovery in 2021, a sharp price increase in the international energy market has changed the dynamics between electricity and coal supply and demand. This has resulted in a large-scale “power cut” crisis around the world. The conflict between Russia and Ukraine in 2022 exacerbated the global energy supply shortage, which furthered the world energy crisis (Xin and Zhang, 2023). Soaring energy prices and energy shortages have threatened households, especially for residents in developing countries (Birol, 2007). Accordingly, it is particularly meaningful to investigate the energy poverty problem regarding Chinese households because China, a developing nation, has one of the largest populations. In the last decade, changing relative poverty has been one of the most efficient paths to improving residential welfare when absolute poverty is eliminated. However, energy poverty alleviation is a crucial step in reducing relative poverty (Luan et al., 2023). While energy poverty in China has been alleviated to some extent since reform and opening up, more than 30% of households continued to use solid fuels in 2014 and faced severe energy shortages and energy payment burdens (Zhang et al., 2019). The situation causes serious pollution problems and damages wellbeing and health (Duarte et al., 2021), eventually damaging socioeconomic development. Energy poverty harms social welfare and economic growth in addition to degrading the environment. As energy poverty runs counter to sustainable development goals, how to improve energy access and thus eliminate energy poverty has become a central issue of current importance.
In the existing literature, many scholars have attempted to explore the current state of energy poverty at the macro level and provide corresponding policy recommendations to alleviate energy poverty. The impact of carbon emissions, digital divide, geography and other factors on energy poverty have been widely discussed (Zhao et al., 2021; Luan et al., 2023). However, few studies have explored the relationship between income inequality and energy poverty from a household perspective, and almost no literature has analyzed the impact of income inequality on energy poverty. Income is the most critical element affecting household energy usage and determines the affordability of household energy consumption (Zheng et al., 2023). The gap between incomes symbolises the energy consumption gap between households, and when the inequality of income distribution continues to worsen, fewer people take up more wealth, which leads to disparities in household energy consumption and the emergence of more energy-poor households (Chaudhuri and Huaccha, 2023). Income inequality is usually measured by the Gini coefficient, which is defined as the portion of the total income of the population that is unequally distributed as a percentage of total income. The globalisation of capital, the globalisation of the economy, and the continuous advancement of technology all have the potential to lead to the polarisation of wealth and income among different groups of people in different regions (Sun et al., 2023). Social inequality in some developed cities or provinces has been worsening for a long time and continues to affect the process of economic development and social stability (Gravina and Lanzafame, 2021). In addition, income inequality will lead to the insufficiency of total social energy demand and total consumption (Alex et al., 2022). Analysing from the perspective of different income levels, most of the low-income groups only have the minimum demand for the basic survival type of energy due to capital constraints and are not able to meet the scientific and effective demand for the basic living type of energy. On the other hand, high-income groups gather a lot of wealth and occupy most of the new income and more advanced energy sources, which in turn causes energy deficiency and poverty in low-income groups. Since income inequality worsens the economic environment and impacts economic development as well as social stability, does it exacerbate energy poverty? Can household energy poverty be ameliorated if the income of the population is raised? The answers to these questions will not only inform the formulation of energy policies by the relevant authorities but will also help to harmonise the equal distribution of income with the alleviation of energy poverty and the realisation of sustainable development.
The impact of income inequality on household energy poverty is examined using data from China for 2016, 2018, and 2020, and the micro-theoretical and empirical evidence of the impact of income inequality on household energy poverty in China is provided. Income distribution inequality, household energy poverty alleviation and ecological wellbeing can be improved by this research. The novelties and contributions of this paper include the following: In terms of indicator measurement, an energy poverty line was derived to measure the level of household energy poverty by looking at the affordability and accessibility of energy to households in grassroots groups. In addition, the Gini coefficients of different Chinese provinces in 2016, 2018 and 2020 were measured based on the data of the sample households to measure the degree of income inequality. In terms of research topics, the impact of income inequality on household energy poverty is explored for the first time based on nearly three samples using two authoritative survey databases by matching large panel data covering 29,088 Chinese households. Considering the robustness and endogeneity of the results, the robustness and endogeneity tests were carried out by replacing the variables, transforming the model and IV-GMM method. In terms of impact mechanisms, the mediating effect of income inequality on energy poverty through household cash savings and the moderating effect of the breadth of digital financial inclusion coverage are examined. To further consider the relationship between household income and energy poverty, the impact of different household incomes, as well as high incomes, on energy poverty is examined.
2 Literature review and theoretical hypotheses
2.1 Literature review
2.1.1 Energy poverty
The increasing problem of energy poverty seriously affects sustainable development and access to education, which in turn constrains business innovation and environmental quality improvement (Cassia et al., 2020; Dong et al., 2022). Therefore, how to alleviate energy poverty has become a hot issue in academic research. Energy poverty, as a typical poverty phenomenon, presents different characteristics in advanced and developing countries (Wei et al., 2023; Zou et al., 2023). In developed nations, energy poverty is commonly identified as the difficulty of households accessing adequate energy services (Sefa and Russell, 2020). In developing countries, energy poverty is defined as a lack of access to clean fuels and a high dependence on conventional solid biomass energy sources that are heavily polluting (Papada and Kaliampakos, 2016). Chan and Delina (2023) define energy poverty as ‘the inability of a household to access socially and materially necessitated levels of energy services in the home’. Furthermore, energy poverty is often defined as the lack of availability, accessibility, and affordability of energy (Trung et al., 2019), which is consistent with Item 7 of the Sustainable Development Goals (Shi et al., 2023). Therefore, it is used as our definition of energy poverty.
As an important indicator for assessing energy poverty, there is no harmonized measurement system for the Energy Poverty Index (EPI) (Lyu et al., 2023; Wei et al., 2023). Papada and Kaliampakos (2016) introduced the 10% index method, arguing that a household is energy poor if its energy consumption exceeds the 10% threshold of household income. The index has been widely used by subsequent researchers. However, the 10% threshold of income is too one-sided (Sun et al., 2023). Thus, Moore (2012) defined energy poor households as those whose income is insufficient to cover the cost of basic household energy use after housing and other needs are met, based on the Minimum Income Standard (MIS) indicator. Due to the complexity of energy poverty, the multidimensional perspective has been used more often in energy poverty investigations. Zhang Y. M. et al. (2023) defined per capita commercial energy expenditure, the share of commercial energy in final energy use, and the proportion of the population using electricity as equally weighted in assessing energy poverty. However, the approach focuses on energy availability and ignores affordability. Thus, Wang et al. (2015) decomposed the energy poverty index into two primary indicators: energy availability and energy affordability. Recent studies have shown that energy poverty not only increases carbon emissions and jeopardises human health but also reduces the quality of family life and the wellbeing of the elderly and causes damage to the ecological environment (Dong et al., 2022). Lin and Adu (2023) discovered that the black race is more likely to be exposed to energy poverty. Karim et al. (2023) show that remittances can be effective in easing energy poverty in low- and middle-income countries through research on workers’ remittances in developing countries. Che et al. (2023) find that the One Belt, One Road initiative alleviates energy poverty and plays a stronger role in the maritime Silk Road.
2.1.2 Income inequality
Income inequality, as an important obstacle to economic development and improving the wellbeing of the population in today’s society, not only negatively affects the entrepreneurial activities of the population by reducing consumption and lowering social trust, but also inhibits urban households’ multi-suite purchase decisions (Wang and Jv, 2023). Income inequality is usually measured by the Gini coefficient, which is defined as the portion of the total income of the population that is unequally distributed as a percentage of total income. Both credit shrinkage and household indebtedness have significant effects on income inequality. For example, Wang et al. (2023) find that credit growth narrows labour income inequality by increasing labour income and unit hourly wages for low- and middle-income groups. Liu et al. (2023) conclude that business indebtedness significantly increases the Gini coefficient and widens the income gap.
Empirical evidence from developed economies such as the United States and Germany suggests that income inequality is growing (Card and Heining, 2013), whereas empirical studies from Brazil, a developing country, suggest that income inequality has shown a downward trend in the last decades (Alvarez et al., 2018). In addition to examining inequality at the national level, the literature distinguishes between inter-firm and intra-firm inequality and focuses on intra-firm wage inequality and the factors that influence it (Mueller et al., 2017). Li et al. (2023) investigate the relationship between digital transformation and intra-firm inequality. Sintos (2023) investigates the impact of inflation on income inequality.
The above literature shows that income inequality and energy poverty have both received the attention of many scholars, respectively, but the study of the relationship between them has not been emphasized. There is no uniform definition of energy poverty, and only a few foreign scholars have provided research on the impact of income inequality on energy poverty based on different measures of energy poverty. For example, Galvin (2019) argues that rising income inequality leads to energy poverty as poorer families live in homes with insufficient heat and have lower incomes to afford energy bills. As income inequality rises, the limited financial capacity of poor families prevents them from patronising energy services to increase energy consumption. Moreover, in energy-scarce countries, income inequality can skew energy prices and make it tougher for the poor to obtain basic energy services, owing to the high up-front costs of energy-efficient technologies (Galvin and Sunikka, 2018). Importantly, while the above literature explores the implications of income inequality on energy poverty at both the macro and micro levels, the current state of income inequality in China and its relationship with household energy poverty are not revealed.
2.2 Theoretical hypotheses
Energy poverty, as a social issue, is closely related to energy supply and the consumption capacity of the population, including the accessibility and affordability of household energy consumption (Ye and Koch, 2023). In terms of household energy consumption accessibility, inequitable income distribution leads to energy problems. On the one hand, income inequality inevitably leads to social power inequality (Chu and Peng, 2011). In order to reduce production costs and maximise profits, high-income people prefer to utilise low-cost energy sources and are not active in their willingness to improve the quality of the environment, thus increasing environmental pollution (Wan et al., 2022). In addition, as education levels increase, low-income people with high levels of education tend to call for improving the quality of the environment (Hassan et al., 2022). However, their claims may be neglected given the inequality of rights and the large amount of invested capital needed to improve the environment. As a result, the status quo of excessive energy consumption is difficult to change (Zheng et al., 2023). On the other hand, income inequality exacerbates the unequal distribution of social welfare, which tends to trigger social conflicts and stimulate consumptionism, and individualism prevails, which can lead to an increase in demand for products driven by the maximisation of personal interests, and these products are often characterised by high energy consumption (Khadijeh et al., 2021). When society is in an environment of income inequality, a small number of high-income people lack environmental protection and social responsibility awareness (Tao et al., 2023). The wasteful consumption behavior of energy in pursuit of profit will occur, resulting in pressure on the energy supply side, which also leads to a relative reduction in the low-income group of energy available, forming the problem of energy poverty (Wang and Lin, 2022).
Regarding household energy affordability, widening income disparities reduce the energy consumption capacity of most households, making them unable to meet their basic household energy needs and entering energy poverty (Nguyen and Muhammad, 2021). Residents in regions with greater income inequality have a lower awareness of environmental protection, and therefore, environmental protection products are less likely to be used. This not only leads to the destruction of the ecological environment but also jeopardises the health of the residents (Xia et al., 2023). However, a good ecological environment is a prerequisite for the realisation of high-quality economic development, and physical health is the basis for individuals to obtain legitimate income (Qian, 2023; Wu and Xie, 2023). If the ecological environment and health of the residents are seriously affected, the local economic development will be hindered or even stagnated, which will further lead to the narrowing of personal employment opportunities and income channels and reduce household income (Shi et al., 2020). In the case of relatively unchanged energy prices, the reduction in income means the expansion of the energy burden on households. According to the theory of precautionary savings, households may be sacrificed at the expense of current energy consumption to obtain the future of life in the event of a major change in security (Gomes, 2017). Therefore, the assumption can be made that inequality in household incomes leads to lower incomes for the majority of the population, which in turn leads to energy poverty (Latzer and Mayneris, 2021). An increase in income, on the other hand, implies an increase in the future security of households and a decrease in the burden of energy expenditures, so that residents have more disposable funds to spend on basic energy consumption and prevent households from falling into the energy poverty trap (Xu and Zhong, 2022). In addition, a widening income gap means that those in the higher income brackets have access to higher incomes as well as benefits. Therefore, driven by the motivation of wanting to improve their social status, low- and middle-income households will save more rather than consume in order to accumulate their own wealth, which in turn reduces the demand for energy consumption and lowers basic energy expenditure (Dong et al., 2022). On the basis of the previously discussed theoretical framework, the following hypotheses were established:
Hypothesis 1. Increased income inequality reduces household energy accessibility and affordability, leading households into energy poverty.
Hypothesis 2. Increased incomes will improve household security and energy consumption capacity, further helping households to escape the energy poverty.
3 Data and methodology
3.1 Econometric methods
3.1.1 Baseline regression model
To investigate how income inequality impacts household energy poverty, a two-way fixed effects panel data model is employed:
whereis
3.1.2 Mediation effect model
In order to explore the mechanisms by which income inequality affects energy poverty, the pathways of income inequality are analyzed in terms of the willingness of households to save, and the way in which income inequality acts on household energy poverty by affecting household cash deposits is examined. Based on the benchmark model (Zhang et al., 2021), the following mediation effects model is constructed:
where
3.1.3 Moderation effect model
Based on model (Zhang et al., 2021), the moderating effect of the breadth of digital inclusion financial coverage on income inequality and household energy poverty is further investigated. In this paper, the interaction term between income inequality and the moderating variables is added to model (Zhang et al., 2021), and the model is constructed as follows:
where
3.1.4 IV-GMM model
There may be a problem of reverse causation between income inequality and energy poverty. To address the endogeneity problem, the IV-GMM (Instrumental Variable-Generalized Method of Moment) model (Brio, 2007) was constructed:
where
3.1.5 Probit model and logit model
In order to prove the robustness of the results, Probit model (Luan et al., 2023) and Logit model (Zhang Y. M. et al., 2023) are constructed in this paper for robustness testing:
where
3.2 Description and measurement of variables
3.2.1 Dependent variable
The dependent variable is energy poverty (EP). Energy poverty is usually defined as the inability of household energy use to meet basic energy needs (Luan et al., 2023). Due to the large number of index methods used in measuring energy poverty, no uniform benchmark exists for estimating energy poverty (Muhammad et al., 2022). However, the idea behind measuring energy poverty is that basic energy needs are income-insensitive; that is, they do not vary with household income. Therefore, drawing on the study by He and Reiner (2016), the energy poverty line was calculated by using the idea of calculating the basic electricity demand. Specifically, nine deciles are selected to divide total household income into ten groups on average, and the sensitivity of energy consumption to household income is considered for different threshold scenarios. If the link between energy expenditure and income becomes significant after the kth income decile, then it means that energy consumption expenditure starts to respond to income changes at this threshold income level, and the level of energy consumption at this threshold is the energy poverty line. To calculate the household energy poverty line, the model (Duarte et al., 2021) was constructed:
where
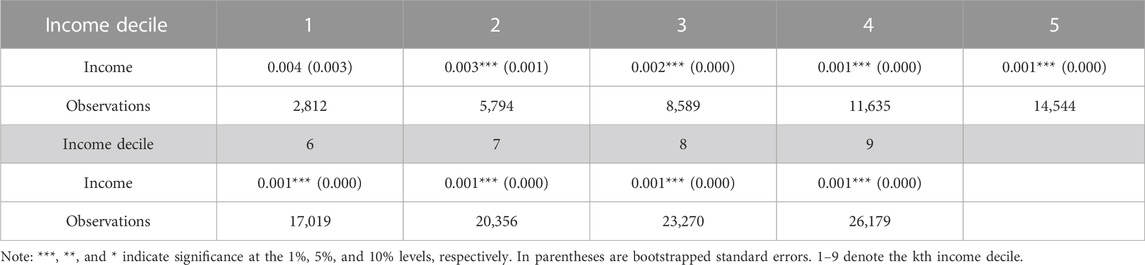
TABLE 1. Estimation of energy demand.
As seen from the results in Table 1, the relationship between energy consumption expenditures and income decile remains generally consistent. At the decile of income, there is no significant relationship between family income and energy consumption. Starting from the second income decile, energy consumption begins to respond significantly to changes in household income. It indicates that the level of energy expenditure corresponding to the income decile is the level of basic energy demand, which is the energy consumption poverty line referred to in this paper. The energy consumption level corresponding to the second income decile of the sample households in this paper is 90, and in order to protect the basic energy needs of residents, household energy consumption must reach 90 RMB per year. Through this energy consumption poverty threshold, it can be concluded that when the household energy consumption is higher than 90, there is no energy poverty; otherwise, it is an energy poor household.
On the basis of energy poverty, a threshold of energy consumption is used to measure the intensity of household energy poverty. In the absence of energy poverty in the household, the intensity of energy poverty is 0. When household energy consumption is less than basic energy needs, energy poverty exists in the household, and the further the household energy consumption expenditure deviates from the energy poverty line, the more serious the household energy poverty is and the greater the intensity of energy poverty. At this time, the ratio of the household energy consumption expenditure gap to the energy poverty line is taken to measure household energy poverty intensity. The specific measurement method is shown in Eq. 9:
where
3.2.2 Independent variable
The independent variable is income inequality (Gini). Income inequality is the uneven distribution of wealth among the population, and the question of equal efficiency is now a development goal in most countries (Wang and Jv, 2023). Current measures of income inequality mainly include the Gini coefficient, the logarithmic variance, and the Thiel index. The Gini coefficient is the most commonly used measure of income inequality in the international arena because it provides a quantitative border that reflects the gap between wealth and poverty in the population, which can reflect and monitor the population gap between the rich and the poor more objectively and intuitively and predict and prevent the polarisation of the population between the rich and the poor (Wang et al., 2023). Therefore, income inequality is measured in this paper by calculating the regional Gini coefficients over the sample period. First of all, calculate the overall sample of 29,088 families according to different years, respectively, according to family income in ascending order, and then calculate the cumulative ratio of family income as a percentage of total social income. At this point, the Lorenz curve is obtained. Due to this paper, in accordance with the Gini coefficient calculated in different provinces in different years, the Lorenz curve graphs are not shown. At this time, the area of the middle part of the Lorenz curve compared to the straight line connecting the two endpoints of the Lorenz curve is the Gini coefficient, from which income inequality is measured. The specific calculation model is shown in Eq. 10:
where
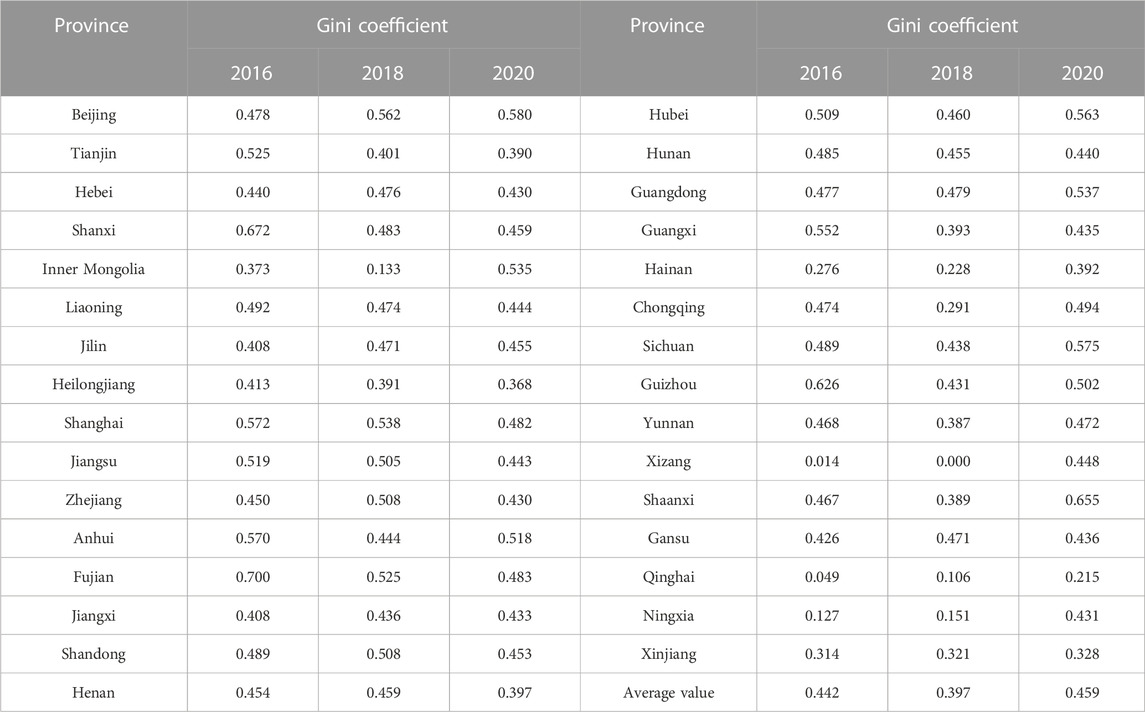
TABLE 2. Estimation of income inequality.
Theoretically, the Gini coefficient is at most “1” and at least “0”, and the closer the Gini coefficient is to 0, the more equal the distribution of income tends to be. Observation of Table 2 can be found: Income inequality actually exists in China today, and the income gap is large. 2016–2018 Gini coefficient into the overall downward trend, indicating that the inequality gap between incomes is narrowing. The Gini coefficient for 2018–2020 is on an overall upward trend, widening the income gap; this may have been influenced by the COVID-19 pandemic, which has led to low-income people with no economic security falling into the “poverty trap”.
3.2.3 Control variables
A variety of parameters, such as household and geographic characteristics, were considered to lessen endogeneity issue caused by omitted variables. Referring to Nie et al. (2021) and Zhang S. H. et al. (2023), household characteristics such as water for cooking, household size and home ownership are controlled for by us. The variables of human resources, regional economy and upgrading of industrial structure at the regional level were also considered. Family size (Size) is stated as the number of household members in logarithms (Nie et al., 2021). Hib is used to identify whether or not a household is self-employed and takes the value of 1 if it is and 0 if it is not. Home ownership (House) is used to indicate the ownership of the house in which the household lives and takes the value of 1 if it is owned by the household and 0 if it is not (Zhang Y. M. et al., 2023). Water is used to reflect the source of the water used in the kitchen of the household. Based on the responses to the CFPS question “What kind of water does your household use most for cooking?”, families with access to piped water and pure water are given a value of 1, while others are given a value of 0 (Hu et al., 2023). At the regional level, human resources (Hr) is expressed as the logarithm of the total population of the region in which the sample households are located (Liu et al., 2023). The regional economy (Gdp) is expressed as the logarithm of the local GDP. Industrial structure upgrading (Is) is calculated using the ratio of the value added of the tertiary industry to the value added of the secondary industry (Karim et al., 2023). A summary of the variables is shown in Table 3.
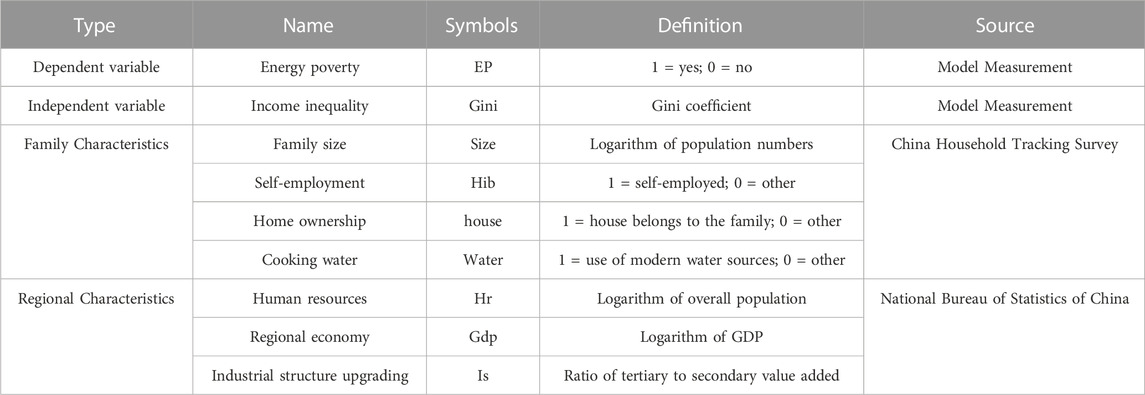
TABLE 3. Variable definitions and sources.
3.2.4 Mechanism variables
3.2.4.1 Household cash savings (Cash)
Household savings and willingness to hold cash are increased by income inequality, which in turn reduces household energy consumption and leads to energy poverty (Mari and Keizer, 2023). In this paper, household cash deposits are selected as the mediating variable, and the variable is logarithmized after adding 1.
3.2.4.2 Digital financial inclusion coverage breadth (Cov)
By virtue of its universality, digital financial inclusion can help residents access non-discriminatory financial services and products across space, serving a wider audience. The greater the breadth of coverage, the more people can enjoy the benefits of digital inclusive finance, thus alleviating income inequality and energy poverty (Song et al., 2023). In this article, the breadth of coverage of digital inclusive finance released by Peking University is selected as a moderating variable and is logarithmized.
3.3 Data sources
The dependent variable EP is measured based on household energy consumption expenditure. The explanatory variable of income inequality is measured based on the calculated Gini coefficient. Household microdata are obtained from the 2016, 2018, and 2020 China Household Tracking Survey (CFPS), and macrodata are sourced from National Bureau of Statistics of China (NBS). For sample selection, the CFPS micro database was matched with the macro data from NBS, and after data cleaning and missing value removal, 29,088 valid samples were finally retained. The descriptive statistics of the variables are given in Table 4. The average value of energy poverty is greater than 0, indicating that energy poverty effectively exists in China. The Gini coefficient of income inequality has a maximum of 0.700 and a minimum of 0, indicating that income inequality is serious and that there is a gap in income inequality between different regions. There are significant differences between the highest and lowest values of the other variables, indicating the heterogeneity of these indicators across households and regions.
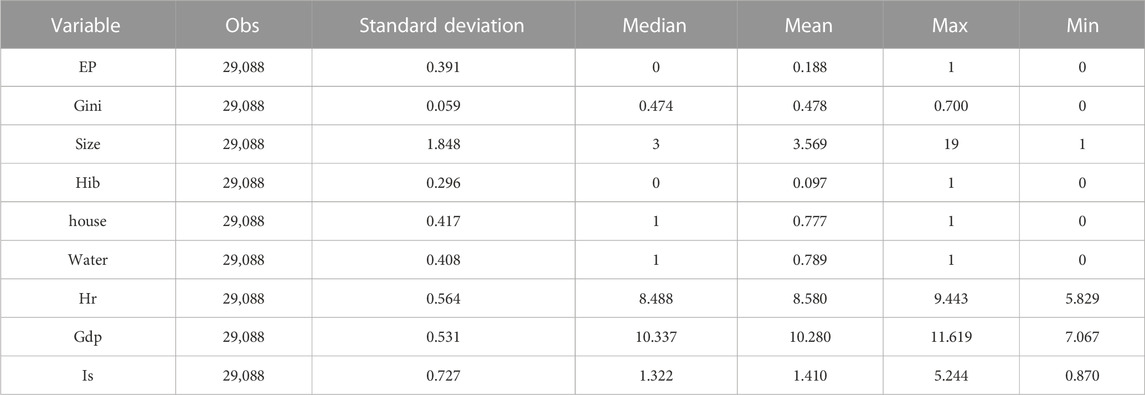
TABLE 4. Variable statistics.
4 Results
4.1 Income inequality and household energy poverty
The baseline model (1) was applied to assess the relationship between income inequality and household energy poverty. To more comprehensively investigate their relationship, the principle of asymptotic regression was used to construct the estimation model, and Table 5 displays the outcomes. In column (1) of Table 5, time and individual fixed effects are not controlled for; only time fixed effects are controlled for in column (2); only individual fixed effects are controlled for in column (3); and both time fixed effects and individual fixed effects are included in column (4). Table 5 shows that regardless of the model setting, the implication of income inequality on household energy poverty is positive at the 1% significant level, implying that widening household income disparity contributes to household energy poverty.
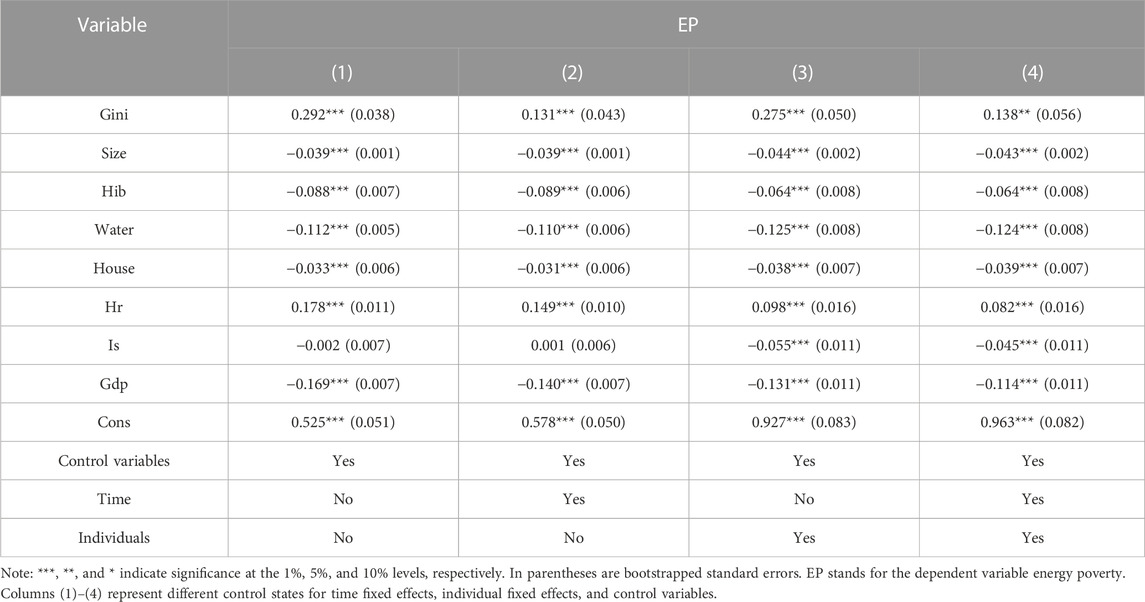
TABLE 5. Income inequality and household energy poverty.
The empirical findings of the baseline model in column (4) of Table 5 show that the regression coefficient of the core explanatory variable, income inequality (Gini), is significant at the 1% level of 0.138, which suggests that increasing income inequality can significantly worsen household energy poverty. This demonstrates that increased income inequality can lead to household energy poverty, and hypothesis 1 is verified. The conclusion parallels that of Galvin (2019), who found a robust correlation between the Gini index of income inequality and the percentage of households that cannot heat their homes adequately. This study opens new pathways to understanding the role of income inequality in household energy, although they do not directly link income inequality to household energy poverty. And heating risk is a major part of household energy poverty risk (Kelly et al., 2020; Xie et al., 2022). Therefore, eliminating energy poverty requires reducing the income inequality gap (Alex et al., 2022). Similar results were obtained by Nguyen and Muhammad (2021), who noted that increased income inequality leads to more energy poverty. In turn, a reduction in energy poverty appears to reduce income inequality. These arguments provide support for examining the relationship between income inequality and energy poverty at the household level. Specifically, on the one hand, energy consumption levels of micro-individuals are affected by income inequality, which in turn affects the future energy poverty status of households. When income inequality increases, low-income groups and households without social security do not have enough available consumption funds to meet their basic energy consumption needs and fall into the “energy poverty trap.” On the other hand, according to the precautionary savings theory, if income inequality widens, it indicates that income fluctuations will become greater and groups will tend to save more and consume less energy.
The findings of the control variables demonstrate that the regression coefficient of household size (Size) is noticeably negative, meaning that the energy poverty of households is alleviated as household size increases. This is because the larger the household, the better its access to assets and resources to enable the eradication of energy poverty. At the 1% degree, the coefficient of Hib is significantly negative, demonstrating that energy poverty declines as the proportion of households with self-employment rises. This is because self-employed households are generally well financed and have a greater financial capacity to afford energy use. The regression coefficient of House on energy poverty is negative at the 1% level, suggesting that family members’ house ownership lowers the likelihood of energy poverty. This is because owning a home means that households do not have rental expenses and have more spare funds for energy consumption. Water has a regression coefficient of −0.124, suggesting that more modernised sources of water for cooking will alleviate energy poverty. The use of modernised cooking water sources implies that households have the power of choice in their energy consumption, have enough money to support energy use, and do not need to worry about energy scarcity. The effect of human resources (Hr) on household energy poverty in the province where the household is located is significant at the 1% level, indicating that energy poverty increases as the population increases in the area where the household is located. This is because an increase in population raises energy use, and overuse of energy leads to energy scarcity when the total amount and supply of energy remain constant. The effects of upgrading the regional industrial structure and increasing economic level on energy poverty are both significantly negative at the 1% level, implying that upgrading the local industrial structure and increasing economic power can curb the phenomenon of energy poverty. The reason is that upgrading the industrial structure will eliminate industries with high energy use and polluting energy use, reduce energy waste, improve energy use efficiency, and alleviate energy poverty. Regional economic strength is linked to the welfare of local residents, and increased economic strength can obtain more energy for the local community, provide lower energy prices, protect people’s livelihoods, and alleviate energy poverty.
4.2 Robustness tests
The conclusions yielded by the estimation using the baseline model validate that rising income inequality increases energy poverty. However, empirical results may be affected by omitted variables, measurement error and model selection. Moreover, in energy-poor areas and households, people may not have access to diversified income channels, potentially leading to reverse causality problems. Even though the two-way fixed effects method somewhat minimises endogeneity, the possible endogeneity problem may still affect the research results. To address these problems, the robustness test and endogeneity analysis were conducted, and the results are shown in Table 6.
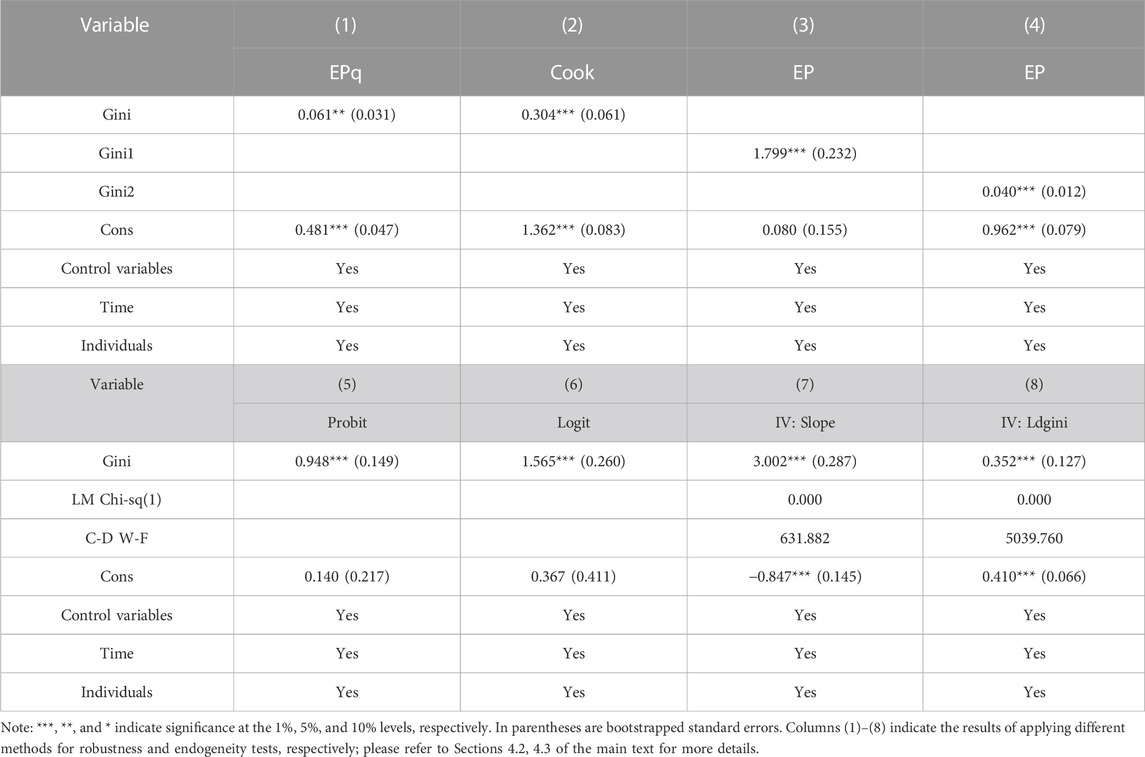
TABLE 6. Robustness test.
4.2.1 Replace dependent variable
Energy poverty intensity is a measure of household energy poverty, which can clearly show the comparison of energy poverty among households. In this paper, the energy poverty measurement methodology Formula 9 is applied to calculate the household energy poverty intensity. Then the obtained energy poverty intensity indicator is used to replace the energy poverty indicator as an explanatory variable to re-run the model regression to consider the effect of income inequality on household energy poverty intensity. The estimation outcomes are displayed in column (1) of Table 6. Income inequality is significantly positive for household energy poverty intensity, consistent with the previous regression results. To further validate the negative effect of income inequality on energy poverty, by drawing on Zhang et al. (2019), which suggest that energy availability and affordability are higher for households with access to modern forms of energy, the availability of modern cooking energy (Cook) is used as a replacement variable for energy poverty. Families are assigned a value of 0 if they have access to modern forms of cooking energy and a value of 1 if they use cooking energy such as coal or firewood, and the regression results are shown in column (2) of Table 6. The regression results show that household income inequality has a positive effect on energy poverty at the 1% level, validating the dependability of the baseline conclusions.
4.2.2 Replace independent variable
The national Gini coefficient for the year was calculated using national household data for different years as a measure of household income inequality (Gini 1). Regression analysis is conducted using the newly obtained Gini coefficient as a replacement variable for household inequality to test the effect of income inequality on household energy poverty. The outcomes are in Table 6 column (3), indicating that income inequality increases energy poverty. According to international practice, a Gini coefficient of 0.3–0.4 is considered to be relatively reasonable, and 0.4–0.5 is considered to be a large income disparity. When Gini coefficients reach 0.5 or above, they indicate income disparity. Therefore, a dummy variable for the Gini coefficient (Gini2) is introduced here as a proxy variable for income inequality for robustness testing. The dummy variable is given a value of 0 when the Gini coefficient is less than 0.4 and a value of 1 when the Gini coefficient is greater than 0.4. Table 6 column (4) displays the regression conclusions, and the estimation is significantly negative at the 1% level, which is compatible with the basic results and proves their robustness.
4.2.3 Probit and logit model
To further test the reliability of the results of the effect of income inequality on household energy poverty, probit and logit models were applied to assess the results. The regression conclusions are displayed in columns (5) and (6) of Table 6, respectively. Based on the two models, income inequality and household energy poverty are significantly positively correlated. This indicates that the empirical results demonstrate the robustness of the result that income inequality increases household energy poverty through the tests conducted using different model settings.
4.3 Instrumental variable regression
Energy poverty is affected by the fact that income inequality reduces household energy consumption and decreases the availability and affordability of household energy. However, in energy-poor households, the inability to fulfil basic energy needs can jeopardise the physical and mental health of family members, negatively affecting household income and widening the income gap. Moreover, energy-poor households do not have enough connections and opportunities to expand their income channels, further widening the gap with higher-income households, and there is a reverse causality problem. Therefore, how to solve the endogeneity problem is an issue worth considering. The most commonly used method to solve the endogeneity problem in the current literature is the instrumental variables method. While the instrumental variables approach to correcting estimation bias relies heavily on the selection of instrumental variables, GMM can better address the issue of unsuitable instrumental variables affecting the robustness of the estimation outcomes. Therefore, the IV-GMM method is used to test for endogeneity, and the instrumental variables are selected as follows: Slope (Slope) represents the regional land conditions. Areas with smaller slopes tend to be more economically active, while areas with larger slopes are more unsuitable for inter-economy business transactions, hindering the mutual flow of capital and potentially resulting in greater income disparities. Drawing on Zhou and Du (2021), the slope of each province is used as an instrumental variable for income inequality, and the test outcomes are displayed in column (7) of Table 6. In addition, the cross-multipliers (Ldgini) of the first-order lagged term and the first-order difference term of the Gini coefficient are used by us as instrumental variables for income inequality, and the test outcomes are shown in column (8) of Table 6.
Columns (7)–(8) of Table 6 present the empirical results using each instrumental variable. According to the Chi-sq(1) test, it can be found that the instrumental variables are identifiable. Furthermore, the Wald statistic is higher than the crucial threshold at the 10% level, proving that there is no weak instrumental variable issue. As can be seen from the table, the effect of income inequality on household energy poverty is significantly positive, proving the robustness of the benchmark model findings. To summarise, the role of income inequality in worsening household energy poverty remains unchanged after accounting for possible endogeneity issues, validating the reliability of the paper’s findings.
4.4 Mechanism analysis
4.4.1 Mediation mechanism
How does energy poverty in households is affected by income inequality? Can the breadth of digital finance coverage moderate the relationship between income inequality and household energy poverty? From the perspective of transmission channels, according to the precautionary savings theory, low- and middle-income households will increase their savings and liquidity to cope with future uncertainty and to improve their ability to protect their family members against major changes in the future, thus suppressing their own consumption demand. Energy consumption, as an important part of household consumption, will be reduced because of the decline in the overall consumption capacity and willingness of households to consume. When a household’s energy demand is extremely low and its energy consumption falls below the energy poverty threshold, it is caught in an energy poverty. Therefore, income inequality can increase households’ willingness to save and hold cash, which in turn reduces household energy consumption and leads to energy poverty. The amount of household cash and savings was measured using responses to the CFPS question “How much money do all household members currently have in cash and savings combined?”, and logarithmize the data after adding 1 to it. The process of testing the mechanism with household cash deposits as the mediating variable is reported in columns (1) (2) and (3) of Table 7. The findings reveal that the effect of income inequality on household cash deposits is significantly negative and that the effects of income inequality and household cash deposits on energy poverty are significant at 0.113 and −0.007, respectively. This suggests that rising income inequality promotes the willingness of households to save, which increases precautionary household savings, reduces energy consumption, and promotes energy poverty.
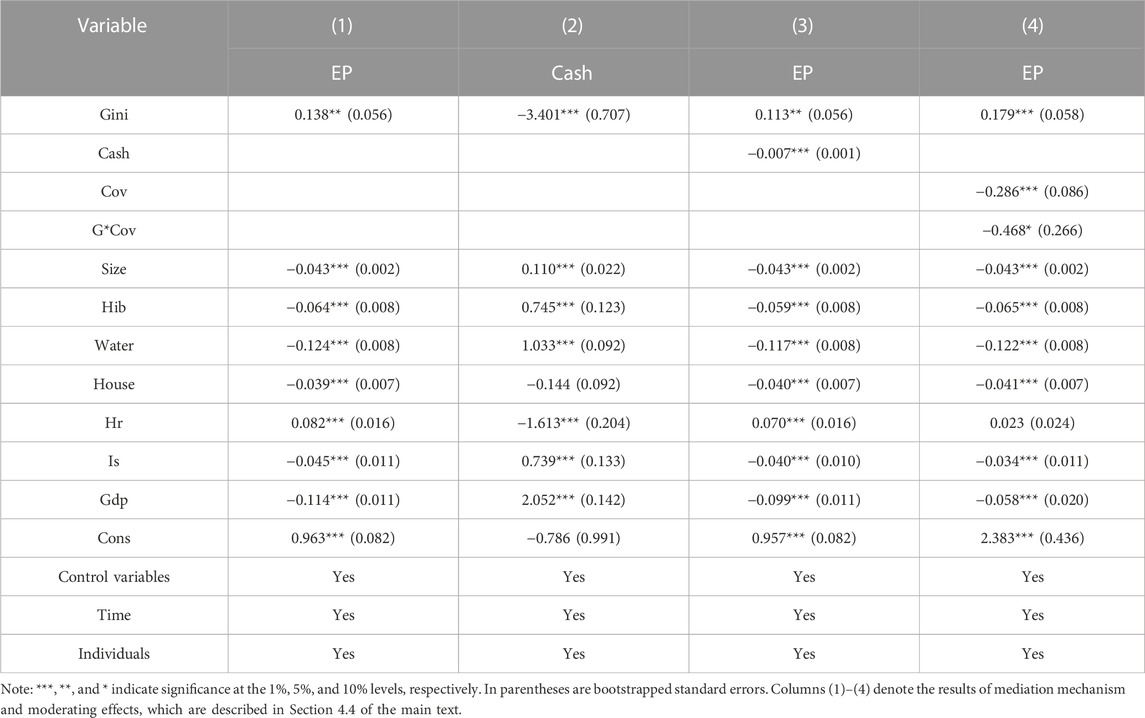
TABLE 7. Mechanism analysis.
4.4.2 Moderating effects
The excessive income gap is, to a large extent, caused by unequal opportunities in people’s relationships to public wealth and public goods. The urban-rural income gap has long been a central issue in the distribution of income in China. The unfair distribution of educational resources and the inequality of political power between urban and rural areas all contribute to the widening of the income gap between urban and rural residents. In addition, the unfair distribution of income in the industry is directly caused by industry monopolisation. Industry monopolisation has created monopoly interest groups and squeezed the development space of the private economy, which in turn has indirectly exacerbated the inequitable distribution of income. The newly emerged digital financial inclusion through the “financial + technology” deep integration of force and the full extension of financial services “tentacles,” may become an important force affecting income inequality. Income distribution inequality is mainly due to the small coverage of social welfare and the inability to consider all the people. By virtue of its universality, digital financial inclusion can help residents access non-discriminatory financial services and products across space and serve more people. Therefore, the breadth of digital inclusion financial coverage is selected as a moderating variable for income inequality and household energy poverty and explore whether the breadth of digital financial inclusion coverage can alleviate energy poverty by reducing the income gap. The regression results with breadth of digital financial inclusion coverage as the moderating variable are reported in column (4) of Table 7. The effect of income inequality on energy poverty is significantly positive, and the regression coefficients of both the breadth of digital financial inclusion coverage and its cross-multiplier with income inequality (G*Cov) are both significantly negative, indicating that the breadth of digital financial inclusion coverage reduces the worsening effect of income inequality on household energy poverty and alleviates the energy poverty challenge.
4.5 Household income and energy poverty
In order to synthesise the effect of family income on energy poverty, the impact of wage income (Wage), business income (Oper), property income (Pro), and transfer income (Trans) on household energy poverty were considered separately. Meanwhile, the impact of total household income (Income) and per capita household income (Pincome) on energy poverty is also considered. Since there are many cases where the categorised incomes of the sample households are zero, in order to ensure the completeness of the sample and to reduce the impact of data outliers, the data on household income for various categories are logarithmized after adding 1 in this paper. The findings are displayed in Table 8.
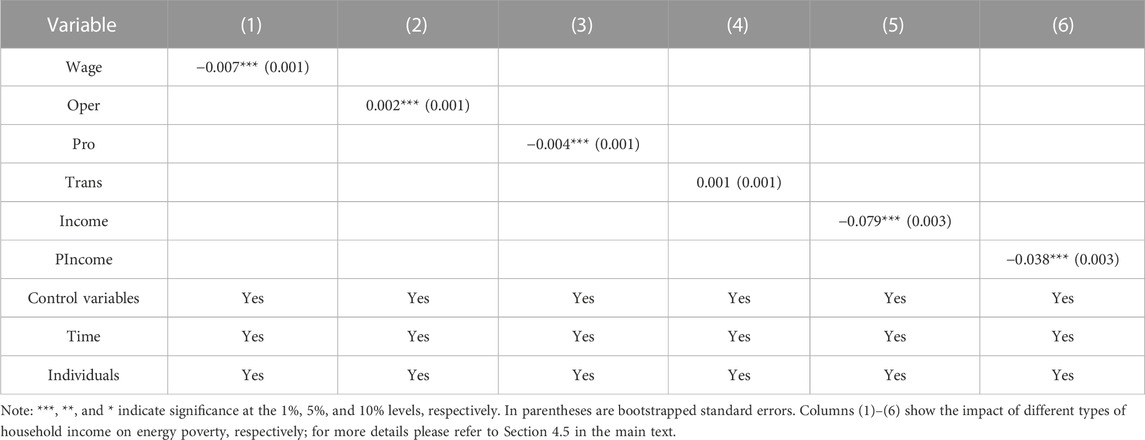
TABLE 8. Household income and energy poverty.
As shown in Table 8, the effects of household wage income, property income, total household income, and family per capita income on energy poverty are all significantly negative at the 1% level, implying that an increase in household per capita income, total income, wage income, and property income will help reduce household energy poverty and eliminate household energy poverty. This is because an increase in household income can improve the affordability of household energy consumption and provide the financial strength to consume more energy at the same energy price. Hypothesis 2 is verified. And along with the increase in household income and disposable funds, consumption also rises, and when household energy consumption rises above the energy poverty line, the household gets rid of the energy poor household designation, thus reducing the number of energy poor households. It is worth noting that the effect of operating income on household energy poverty is significantly positive at the 1% level, indicating that operating income increases household energy poverty. The possible reasons for this are as follows: Operating income refers to the income earned by taxpayers through production and business activities, which consume more energy when the operator carries out the activities, resulting in over-utilisation and waste of energy and thus energy poverty.
5 Conclusion and suggestions
Eradicating energy poverty is a prerequisite for breaking out of the “energy poverty trap,” and is also a necessary way to enhance the wellbeing of the population and achieve the construction of an ecological civilization. The wellbeing of the population and stable socio-economic development can be affected by income inequality. Models to measure income inequality and household energy poverty are constructed in this paper, which analyze the current status of income inequality in China and identify the specific situation of household energy poverty. Using the microdata from the China Family Panel Studies (CFPS) conducted by the China Centre for Social Science Research at Peking University in 2016, 2018, and 2020, a large panel of data covering 29,088 families in China is matched, and a double-fixed-effects model is introduced to verify the theoretical assumptions. The role of household cash savings and the breadth of digital financial inclusion coverage in income inequality and household energy poverty are also discussed in the study. Finally, the role of household income in alleviating energy poverty is examined. The study finds that income inequality in China is relatively high and has increased in recent years, and that energy poverty is still a challenge in eradicating relative poverty. Income inequality is significantly and positively correlated with household energy poverty, implying that widening income inequality exacerbates household energy poverty, and the results still hold after a series of robustness tests. Mechanistically, household cash savings play an important role in the pathway through which income inequality affects energy poverty. Income inequality increases households’ willingness to save and increases cash savings to exacerbate energy poverty. In terms of moderating effects, the expansion of the breadth of digital financial inclusion coverage attenuates the energy poverty-enhancing effects of income inequality. In terms of how to move out of energy poverty, an increase in household income is a viable approach. Household income can increase household consumption capacity and mobility, thereby easing the energy burden and curbing energy poverty. In order to alleviate income inequality and household energy poverty, the following recommendations are proposed in this paper based on the above findings:
First, it is important to create a sustainable digital ecosystem to promote the deep integration of digital inclusive finance with people’s livelihoods. Since the breadth of digital inclusive finance coverage can significantly reduce energy poverty has been empirically demonstrated, relevant policies should focus on promoting the synergistic development of high-end digitization (including cloud computing, big data, and the Internet of Things) and energy digitization so as to provide a solid foundation for digital inclusive finance to reduce income inequality and energy poverty. Second, the government should create a favourable consumption environment, formulate a multi-level energy pricing policy, subsidise the use of clean energy through official forces, and promote the accessibility of energy consumption. Reasonable government intervention is also necessary to reduce the leverage effect of rising income inequality on energy poverty. Finally, due consideration should be given to the household income factor. It is worth noting that the previous results suggest that an increase in household income can mitigate the incidence of energy poverty, especially the poverty-reducing effects of household wage and property incomes on energy. To this end, more employment opportunities as well as diversified income channels should be provided to individuals to improve the energy affordability of households and reduce energy poverty. Examples include creating more jobs, promoting innovation and entrepreneurship among the population, and improving social security and social welfare.
By utilizing data from 2016, 2018, and 2020, this paper adds to the existing literature by exploring for the first time the relationship between income inequality and energy poverty. This work is now more complete, but still has some limitations in terms of data. If reports of post-2020 data are released, future work could use the most recent data for discussion. In addition, future research could match household data with urban data to more microcosmically consider the social welfare of modern people.
Data availability statement
Publicly available datasets were analyzed in this study. This data can be found here: China Household Tracking Survey (http://www.isss.pku.edu.cn/cfps/) and China’s National Bureau of Statistics (http://www.stats.gov.cn/).
Author contributions
DW: Conceptualization, Data curation, Funding acquisition, Investigation, Methodology, Project administration, Software, Writing–original draft. TF: Formal Analysis, Resources, Supervision, Writing–review and editing. XW: Formal Analysis, Methodology, Project administration, Supervision, Writing–review and editing.
Funding
The authors declare financial support was received for the research, authorship, and/or publication of this article. This research was funded by General Program of the China National Social Science Foundation, grant number 21BJL083.
Conflict of interest
The authors declare that the research was conducted in the absence of any commercial or financial relationships that could be construed as a potential conflict of interest.
Publisher’s note
All claims expressed in this article are solely those of the authors and do not necessarily represent those of their affiliated organizations, or those of the publisher, the editors and the reviewers. Any product that may be evaluated in this article, or claim that may be made by its manufacturer, is not guaranteed or endorsed by the publisher.
References
Alex, O. A., Muhammad, S., Janet, D., and Jiao, Z. (2022). Effects of income inequality and governance on energy poverty alleviation: implications for sustainable development policy. Util. Policy. 78, 101403. doi:10.1016/j.jup.2022.101403
Alvarez, J., Benguria, F., Engbom, N., and Moser, C. (2018). Firms and the decline in earnings inequality in Brazil. Am. Econ. J. Macroecon. 10 (1), 1–189. doi:10.5089/9781484333037.001
Birol, F. (2007). Energy economics: a place for energy poverty in the agenda? Trans. Energy jour. 28, 1–6. doi:10.5547/issn0195-6574-ej-vol28-no3-1
Card, D., Heining, J. K. P., and Kline, P. (2013). Workplace heterogeneity and the rise of west German wage inequality*. Q. J. Econ. 128 (3), 967–1015. doi:10.1093/qje/qjt006
Cassia, A. R., Costa, I., Silva, V. H. C., and Neto, G. C. O. (2020). Systematic literature review for the development of a conceptual model on the relationship between knowledge sharing, information technology infrastructure and innovative capability. ility Technol. Anal. Strateg. Manag. 32 (7), 801–821. doi:10.1080/09537325.2020.1714026
Chan, C., and Delina, L. L. (2023). Energy poverty and beyond: the state, contexts, and trajectories of energy poverty studies in Asia. Energy Res. Soc. Sci. 102, 103168. doi:10.1016/j.erss.2023.103168
Chaudhuri, K., and Huaccha, G. (2023). Who bears the energy cost? Local income deprivation and the household energy efficiency gap. Energy Econ. 127, 107062. doi:10.1016/j.eneco.2023.107062
Che, X. H., Kuang, W. J., Zhang, H. J., and Jiang, M. X. (2023). Does the belt and road initiative alleviate energy poverty in participating countries? Energy. Rep. 9, 2395–2404. doi:10.1016/j.egyr.2023.01.054
Chu, A., and Peng, S. K. (2011). International intellectual property rights: effects on growth, welfare and income inequality. J. Macroecon. 33, 276–287. doi:10.1016/j.jmacro.2010.10.002
Dong, K. Y., Farhad, T. H., and Zhao, J. (2022). How inclusive financial development eradicates energy poverty in China? The role of technological The role of technological innovation. Energy Econ. 109, 106007. doi:10.1016/j.eneco.2022.106007
Duarte, R., Miranda, B. S., and Sarasam, C. (2021). Household consumption patterns and income inequality in EU countries: scenario analysis for a fair transition towards low-carbon economies. Energy Econ. 104, 105614. doi:10.1016/j.eneco.2021.105614
Galvin, R. (2019). Letting the Gini out of the fuel poverty bottle? Correlating cold homes and income inequality in European Union countries. Energy. Res. Soc. Sci. 58, 101255. doi:10.1016/j.erss.2019.101255
Galvin, R., and Sunikka, B. M. (2018). Economic inequality and household energy consumption in high-income countries: a challenge for social science based energy research. Ecol. Econ. 153, 78–88. doi:10.1016/j.ecolecon.2018.07.003
Gomes, R. F. A. (2017). Evaluating a consumption function with precautionary savings and habit formation under a general income process. Q. Rev. Econ. Finance. 76, 157–166. doi:10.1016/j.qref.2019.05.007
Gravina, A. F., and Lanzafame, M. (2021). Finance, globalisation, technology and inequality: do nonlinearities matter? Econ. Model. 96, 96–110. doi:10.1016/j.econmod.2020.12.026
Hassan, S. T., Batool, B., Zhu, B. Z., and Khan, I. (2022). Environmental complexity of globalization, education, and income inequalities: new insights of energy poverty. J. Clean. Prod. 340, 130735. doi:10.1016/j.jclepro.2022.130735
He, X. P., and Reiner, D. (2016). Electricity demand and basic needs: empirical evidence from China's households. Energy Policy 90, 212–221. doi:10.1016/j.enpol.2015.12.033
Hong, M. P., Wang, K. T., Khudoykulov, K., Trung, L. M., Ngo, G. Q., and Nguyen, T. T. H. (2022). Assessing multidimensional energy poverty and its economic impact on N11 Countries: mediating role of energy efficiency. Front. Energy Res. 11, 153. doi:10.3389/fenrg.2022.900449
Hu, D. B., Zhai, C. Z., and Zhao, S. B. (2023). Does digital finance promote household consumption upgrading? An analysis based on data from the China family panel studies. Econ. Model. 125, 106377. doi:10.1016/j.econmod.2023.106377
Karim, B., Mouyad, A., and Karim, M. (2023). Can remittances alleviate energy poverty in developing countries? new evidence from panel data. Energy Econ. 119, 106527. doi:10.1016/j.eneco.2023.106527
Kelly, A. J., Clinch, P. J., Kelleher, L., and Shahab, S. (2020). Enabling a just transition: a composite indicator for assessing home-heating energy-poverty risk and the impact of environmental policy measures. Energy Policy. 146, 111791. doi:10.1016/j.enpol.2020.111791
Khadijeh, R. C., Reza, P. M., Mehdi, R., and Saeed, G. (2021). Is there a linkage between household welfare and income inequality, and food security to achieve sustainable development goals? J. Clean. Prod. 326, 129390. doi:10.1016/j.jclepro.2021.129390
Latzer, H., and Mayneris, F. (2021). Average income, income inequality and export unit values. J. Econ. Behav. Organ. 185, 625–646. doi:10.1016/j.jebo.2021.03.002
Li, M., Jiang, A., and Ma, J. (2023). Digital transformation and income inequality within enterprises – evidence from listed companies in China. Financ. J. 81, 102133. doi:10.1016/j.pacfin.2023.102133
Lin, B. Q., and Adu, O. M. (2023). Race and energy poverty: the moderating role of subsidies in South Africa. Energy Econ. 117, 106464. doi:10.1016/j.eneco.2022.106464
Liu, Z., Mark, M. S., and Zhang, J. Y. (2023). Capital flows and income inequality. J. Int. Econ. 144, 103776. doi:10.1016/j.jinteco.2023.103776
Luan, B. J., Zou, H., and Huang, J. B. (2023). Digital divide and household energy poverty in China. Energy Econ. 119, 106543. doi:10.1016/j.eneco.2023.106543
Lyu, Y. W., Wu, Y., Wu, G., Wang, W. Q., and Zhang, J. N. (2023). Digitalization and energy: how could digital economy eliminate energy poverty in China? Environ. Impact Assess. Rev. 103, 107243. doi:10.1016/j.eiar.2023.107243
Mari, G., and Keizer, R. (2023). Do high-income households‘label’family cash benefits? Evidence on family expenditures from Australia. Soc. Sci. Res. 113, 102830. doi:10.1016/j.ssresearch.2022.102830
Moore, R. (2012). Definitions of fuel poverty: implications for policy. Energy policy 49, 19–26. doi:10.1016/j.enpol.2012.01.057
Mueller, H. M., Ouimet, P. P., and Simintzi, E. (2017). Within-firm pay inequality. Rev. Financ. Stud. 30 (10), 3605–3635. doi:10.1093/rfs/hhx032
Muhammad, M., Farhad, T. H., and Muhammad, S. (2022). Nexus between financial development and energy poverty in Latin America. Energy Policy. 165, 112925. doi:10.1016/j.enpol.2022.112925
Nguyen, C. P., and Muhammad, A. N. (2021). An inquiry into the nexus between energy poverty and income inequality in the light of global evidence. Energy Econ. 99, 105289. doi:10.1016/j.eneco.2021.105289
Nie, P., Li, Q. G., and Alfonso, S. P. (2021). Energy poverty and subjective well-being in China: new evidence from the China family panel studies. Energy Econ. 103, 105548. doi:10.1016/j.eneco.2021.105548
Papada, L., and Kaliampakos, D. (2016). Measuring energy poverty in Greece. Energy Policy. 94, 157–165. doi:10.1016/j.enpol.2016.04.004
Qian, X. L. (2023). Research on the coordinated development model of marine ecological environment protection and economic sustainable development. J. Sea Res. 193, 102377. doi:10.1016/j.seares.2023.102377
Sefa, A. C., and Russell, S. (2020). Ethnic diversity, energy poverty and the mediating role of trust: evidence from household panel data for Australia. Energy Econ. 86, 104663. doi:10.1016/j.eneco.2020.104663
Shi, T., Yang, S. Y., Zhang, W., and Zhou, Q. (2020). Coupling coordination degree measurement and spatiotemporal heterogeneity between economic development and ecological environment ----Empirical evidence from tropical and subtropical regions of China. J. Clean. Prod. 244, 118739. doi:10.1016/j.jclepro.2019.118739
Shi, X. J., Cui, L., Huang, Z. H., Zeng, P., Qiu, T. W., Fu, L. L., et al. (2023). Impact of internal migration on household energy poverty: empirical evidence from rural China. Appl. Energy. 350, 121780. doi:10.1016/j.apenergy.2023.121780
Sintos, A. (2023). Does inflation worsen income inequality? A meta-analysis. Econ. Syst. 47, 101146. doi:10.1016/j.ecosys.2023.101146
Song, X. L., Yao, T. M., and Wu, X. K. (2023). Digital finance, technological innovation, and carbon dioxide emissions. Econ. Anal. Policy. 80, 482–494. doi:10.1016/j.eap.2023.09.005
Sun, Y. F., Wang, Z. H., Yang, T., Zhang, B., and Wang, B. (2023). Polycentric cities and income polarization in China: does city spatial structure matter? Struct. Chang. Econ. Dyn. 67, 380–387. doi:10.1016/j.strueco.2023.09.007
Tao, Y. Q., Wang, D. J., Ye, Y. W., Wu, H. T., and Zhang, Y. (2023). The role of public environmental concern on corporate social responsibility: evidence from search index of web users. Energy Econ. 126, 107041. doi:10.1016/j.eneco.2023.107041
Trung, T. N., Nguyen, T. T., Hoang, V. N., Wilson, C., and Managi, S. (2019). Energy transition, poverty and inequality in Vietnam. Energy Policy. 132, 536–548. doi:10.1016/j.enpol.2019.06.001
Wan, G. H., Wang, C., Wang, J. X., and Zhang, X. X. (2022). The income inequality-CO2 emissions nexus: transmission mechanisms. Ecol. Econ. 195, 107360. doi:10.1016/j.ecolecon.2022.107360
Wang, K., Wang, Y. X., Li, K., and Wei, Y. M. (2015). Energy poverty in China: an index based comprehensive evaluation. Renew. Sust. Energy Rev. 47, 308–323. doi:10.1016/j.rser.2015.03.041
Wang, Q., Hu, S. L., Li, L. J., and Li, R. (2023). Accelerating urbanization serves to reduce income inequality without sacrificing energy efficiency-Evidence from the 78 countries. Sustain. Cities. Soc. 92, 104477. doi:10.1016/j.scs.2023.104477
Wang, Y., and Lin, B. Q. (2022). Can energy poverty be alleviated by targeting the low income? Constructing a multidimensional energy poverty index in China. Appl. Energy. 321, 119374. doi:10.1016/j.apenergy.2022.119374
Wang, Z. X., and Jv, Y. Q. (2023). Revisiting income inequality among households: new evidence from the Chinese Household Income Project. China. Econ. Rev. 81, 102039. doi:10.1016/j.chieco.2023.102039
Wei, T., Duan, Z. C., and Xie, P. (2023). Spatial disparities and variation sources decomposition of energy poverty in China. J. Clean. Prod. 421, 138498. doi:10.1016/j.jclepro.2023.138498
Wu, H. F., and Xie, Q. C. (2023). Volatility spillovers and Asymmetric effects of Chinese A-share markets—enterprise-Level data Based on high-dimensional social network models. Appl. Econ., 2288051. doi:10.1080/00036846.2023.2288051
Xia, L. K., Wan, L. J., Wang, W. Z., Luo, J., and Yan, J. L. (2023). Energy accessibility via natural resources: do natural resources ensure energy accessibility in low income countries? Resour. Policy. 86, 104145. doi:10.1016/j.resourpol.2023.104145
Xie, L. Y., Hu, X., Zhang, X. Y., and Zhang, X. B. (2022). Who suffers from energy poverty in household energy transition? Evidence from clean heating program in rural China. Energ Econ. 106, 105795. doi:10.1016/j.eneco.2021.105795
Xin, B. G., and Zhang, M. W. (2023). Evolutionary game on international energy trade under the Russia-Ukraine conflict. Energy Econ. 125, 106827. doi:10.1016/j.eneco.2023.106827
Xu, Q., and Zhong, M. R. (2022). The impact of income inequity on energy consumption: the moderating role of digitalization. J. Environ. Manage. 325, 116464. doi:10.1016/j.jenvman.2022.116464
Ye, Y. X., and Koch, S. F. (2023). Towards accessibility or affordability? Multidimensional energy poverty across the South African urban–rural divide. Energy Res. Soc. Sci. 97, 103002. doi:10.1016/j.erss.2023.103002
Zhang, D. Y., Li, J. J., and Han, P. M. (2019). A multidimensional measure of energy poverty in China and its impacts on health: an empirical study based on the China family panel studies. Energy Policy 131, 72–81. doi:10.1016/j.enpol.2019.04.037
Zhang, M., Wang, L. J., Ma, P. P., and Wang, W. W. (2022). Urban-rural income gap and air pollution: a stumbling block or stepping stone. Environ. Impact. Asses. 94, 106758. doi:10.1016/j.eiar.2022.106758
Zhang, S. H., Yang, J., and Feng, C. (2023b). Can internet development alleviate energy poverty? Evidence from China. Energy Policy 173, 113407. doi:10.1016/j.enpol.2022.113407
Zhang, W., You, J. M., and Lin, W. W. (2021). Internet plus and China industrial system's low-carbon development. Renew. Sust. Energy Rev. 151, 111499. doi:10.1016/j.rser.2021.111499
Zhang, Y. M., Wang, F., and Zhang, B. (2023a). The impacts of household structure transitions on household carbon emissions in China. Ecol. Econ. 206, 107734. doi:10.1016/j.ecolecon.2022.107734
Zhao, J., Jiang, Q. Z., Dong, X. C., and Dong, K. Y. (2021). Assessing energy poverty and its effect on CO2 emissions: the case of China. Energy Econ. 97, 105191. doi:10.1016/j.eneco.2021.105191
Zheng, J. J., Dang, Y. J., and Assad, U. (2023). Household energy consumption, energy efficiency, and household income–Evidence from China. Appl. Energy 353, 122074. doi:10.1016/j.apenergy.2023.122074
Zhou, X. X., and Du, J. T. (2021). Does environmental regulation induce improved financial development for green technological innovation in China? J. Environ. Manage. 300, 113685. doi:10.1016/j.jenvman.2021.113685
Keywords: income inequality, Gini coefficient, energy poverty, household income, sustainable development
Citation: Wang D, Fang T and Wang X (2024) Assessing the effect of income inequality on household energy poverty—empirical evidence from China. Front. Energy Res. 11:1290904. doi: 10.3389/fenrg.2023.1290904
Received: 08 September 2023; Accepted: 15 December 2023;
Published: 08 January 2024.
Edited by:
Biagio Fernando Giannetti, Paulista University, BrazilReviewed by:
Fatma Mabrouk, Princess Nourah bint Abdulrahman University, Saudi ArabiaFábio Sevegnani, Paulista University, Brazil
Estevao Salvador Langa, Paulista University, Brazil, in collaboration with reviewer FS
Geraldo Cardoso Oliveira Neto, Federal University of ABC, Brazil
Copyright © 2024 Wang, Fang and Wang. This is an open-access article distributed under the terms of the Creative Commons Attribution License (CC BY). The use, distribution or reproduction in other forums is permitted, provided the original author(s) and the copyright owner(s) are credited and that the original publication in this journal is cited, in accordance with accepted academic practice. No use, distribution or reproduction is permitted which does not comply with these terms.
*Correspondence: Xiaofan Wang, d3hmOTA4OEAxMjYuY29t