 Han Wei
 Yukun Zhang
 Houbin Song
 Hongbo Qiu2
94% of researchers rate our articles as excellent or good
Learn more about the work of our research integrity team to safeguard the quality of each article we publish.
Find out more
ORIGINAL RESEARCH article
Front. Energy Res., 08 January 2024
Sec. Process and Energy Systems Engineering
Volume 11 - 2023 | https://doi.org/10.3389/fenrg.2023.1289263
The compact internal structure of the bulb tubular turbine generator (BTTG) leads to poor ventilation and heat dissipation capability (VHDC). It will result in high-temperature faults and lead to losses for the hydro-power station, if the staff at the hydropower station fail to promptly regulate the external forced air cooling for effective heat dissipation. Thus, a specific and effective ventilation control strategy (VCS) is of utmost importance for the operation of the BTTG. In this study, the finite element method (FEM) was employed to solve the magnetic-flow-thermal coupled field of a 24-MW BTTG. The distribution characteristics of electromagnetic losses and their impact on the temperature field were revealed. Experimental validation was conducted to verify the effectiveness of the numerical results. The response surface methodology (RSM) was employed to design an experimental plan by building upon this foundation. Integrated with a multiobjective genetic algorithm (MOGA), an optimal relationship between ambient temperature, fan flow rate, and heating components’ temperature was established. This relationship serves as the optimized ventilation control strategy for the BTTG. This research provides a theoretical framework for the formulation of operational guidelines to ensure the safe operation of generators.
As the global energy demand continues to increase, high-head areas have largely been developed. The development of low-head areas and ultra-low-head areas for hydropower plant construction is becoming increasingly important (Ceran et al., 2020; Quaranta et al., 2022). The bulb tubular turbine generator (BTTG) with its compact structure is more suitable for rivers and small waterways. As China continues to invest in low-water hydropower plants, BTTGs have become an important focus in the search for clean renewable energy solutions (Liu et al., 2023).
However, the compact structure of the BTTG also reduces its ventilation and heat dissipation capability (VHDC). So far, overheating failures such as fuse of damper windings due to heat generation (Zhan et al., 2017; Gu et al., 2023) and ablation of the surface of magnet poles’ boots (Zhou et al., 2020) have occurred. To reduce the temperature inside the bulb body, cooling equipment is usually installed on the outside of the fixed rotor. However, most hydropower plants do not have a detailed forced-air cooling ventilation control strategy (VCS) at present, which will require manual real-time monitoring and control by workers. Fortunately, in the building of ventilation systems, many scholars have obtained a better VCS combined with numerical calculation software and algorithms. To solve the prediction accuracy and low speed dilemma of the rapid prediction model, Cao and Ren built an efficient online ventilation control strategy based on computational fluid dynamics (CFD) and low-dimensional linear artificial neural networks (Cao and Ren, 2018; Ren and Cao, 2020). Zhu developed an optimal VCS for heating, ventilation, and air conditioning (HVAC) systems based on Cao and Ren. Optimal selection for ventilation rates and supply air temperatures is shown in Faramarzi et al. (2021). Faramarzi and Afshin have studied four VCSs using CONTAM. The power consumption and energy efficiency under linear-DCV control were optimized (Xu et al., 2009). Xu proposed an optimal VCS based on cost function and the genetic algorithm (GA). The strategy balances fresh air in different areas of the building (Zhu et al., 2021b). The algorithm is helpful to the design of the VCS. However, there is less research on the external forced-air cooling VCS of compact generators. Therefore, with reference to the design of the internal VCS of the building, an FEM and optimization method are proposed to design the external forced-air cooling VCS of the generator.
As a common design optimization method, the response surface methodology (RSM) and GA have been widely used in biological, chemical, food, medical, and mechanical manufacturing fields. Especially in the process of motor structure design and performance optimization, Guazzelli et al. used the RSM and GA to design parameters and seek the optimal solution so that the motor performance is improved. The multi-objective genetic algorithm (MOGA) was applied to obtain model prediction torque control (MPTC) for variable speed drive of induction motor weighted factor. Finally, torque fluctuations, flux ripples, and average switching frequencies are reduced to a minimum (Guazzelli et al., 2019). Abunike et al. optimized switched magnetoresistive motors based on genetic polymerization response surfaces and MOGA. The optimized model has a higher efficiency distribution over a wide speed range (Abunike et al., 2022). Pellegrino and Cupertino performed rotor optimization designs of IPM motors over a wide speed range based on the finite element method (FEM) and MOGA and reduced harmonic and rotor core eddy current loss in torque pulsation (Pellegrino and Cupertino, 2010). Chakkarapani et al. improved motor efficiency and torque (Chakkarapani et al., 2019). Zhao et al., by using FEM and MOGA, optimized the permanent magnet design of the periodic-permanent magnet (PPM), which increases torque performance while reducing costs (Zhao et al., 2021).
According to the research progress, the FEM, RSM, and MOGA are used to design the external forced-air cooling VSC. The SFWG24-88/7820 generator was used as the research object. First, based on the FEM, the electromagnetic model and temperature field model are established and compared with the experiment, and the validity of the numerical calculation is proved. Second, the NSGA-II, combined with the RSM, provides a VCS that ensures that the generator temperature is suitable and integrates multiple factors, caused by additional coolers. The novelty of this study is to design the internal ventilation cooling strategy of the generator by means of magnetic flow–thermal coupling. This method can greatly improve the operation reliability of the BTTG and the economy of the hydropower station.
The establishment of the generator’s temperature field requires solving the electromagnetic losses in the electromagnetic field first, by using them as heat sources to ensure the accuracy of thermal flow field calculations.
In this paper, the SFWG24-88/7820 generator is taken as the research subject, and the basic parameters of the generator are shown in Table 1. Based on its periodic structure, the generator can be divided into 22 periodic units, with one periodic unit taken as the research object. The two-dimensional transient electromagnetic field of the BTTG is described using vector magnetic potential Az. The transient electromagnetic field equations of the generator can be expressed as Eq. (1) (Qiu and Fan, 2018; Qiu et al., 2020):
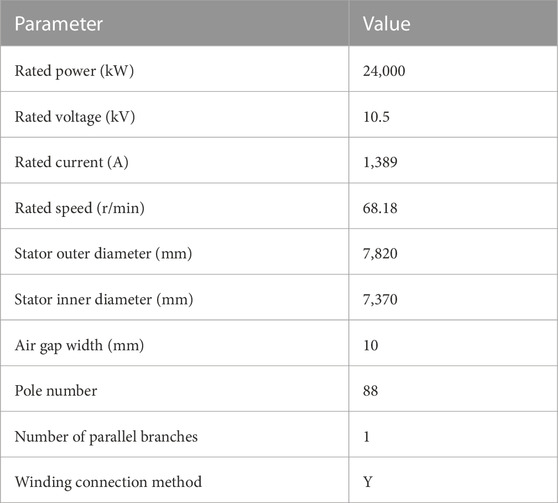
TABLE 1. Cooler design parameters.
where Ω is the solving region; μ is the magnetic conductivity; Jz is the z-axis component of the current density J; Az is the z-axis component of the vector magnetic potential A; σ is the electrical conductivity; Γ1 is an internal and external boundary condition; Γ2 is the periodic boundary condition that solves the region for 1/11. The two-dimensional electromagnetic field model of the generator is established by the FEM, and the distribution of the magnetic field under empty and rated load conditions is shown in Figure 1.
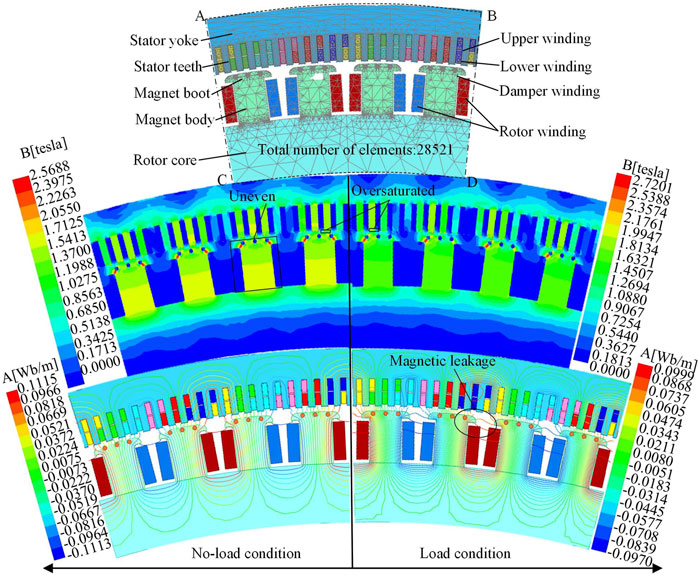
FIGURE 1. Electromagnetic model and magnetic field characteristics of the generator.
From the magnetic flux density distribution in Figure 1, it can be observed that in both no-load and rated load conditions, due to the saturation magnetic density of the stator core material (50W270) being 1.7 T, the stator teeth exhibit magnetic over-saturation. Under no-load conditions, the magnetic flux density distribution of the main body of the magnetic poles is uneven, showing a significant gradient. Under rated load conditions, there is evident magnetic leakage between the rotor windings. These phenomena collectively affect the distribution of generator losses, thus exerting an influence on the distribution of the heat sources. To ensure the accuracy of the electromagnetic model, the obtained data are preprocessed and compared with experimental data, as shown in Figure 2. When the generator operates under both no-load and rated load conditions, the error between experimental data and FEM calculation data does not exceed 7%, confirming the validity of the FEM and of the numerical heat sources.
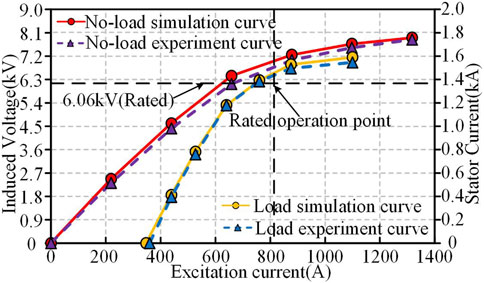
FIGURE 2. Comparison of experimental data and FEM results.
The energy conversion of the BTTG in operation can be summarized as Eq. 2 (Qiu, 2022), where PA is the mechanical power of the turbine which is finally imported into the generator shaft; pFe-s is the core-loss of the stator; pFe-r is the core-loss of the rotor core; pCu-r is the copper loss from windings of rotor flat copper buses; pCu-s is the copper loss form stator windings; The magnetic poles are made of a thin steel sheet, so the core-loss pFe-m will be produced. pEd-b is the eddy current loss as damper windings suppress speed oscillation. pM-l is the mechanical loss due to rotation and ventilation of rotating parts; PE is the final output power of the generator. The electromagnetic loss ratio of the empty and rated load conditions are calculated, as shown in Figure 3. Combined with the electromagnetic losses and geometric volume of the abovementioned heating components, the thermal source of unit volume can be obtained as the boundary condition for the thermal-flow field solution.
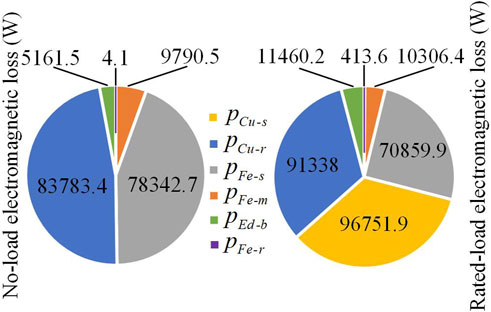
FIGURE 3. Electromagnetic loss ratio of the generator.
The BTTG (24 MW) uses axial and radial closed ventilation cooling. The basic design parameters for the cooler are shown in Table 2. When the generator is running, the pressure generated by the rotor ribs will drive the air, which is in a complex flow state in the radial ventilation channel and air gap of the fixed rotor. At the same time, the original unreasonable structure of the generator caused a certain flow loss, which will affect the VHDC. Therefore, it is necessary to study the flow field of the BTTG and to redesign the unreasonable structure in the wind path. This work can provide theoretical guidance for optimal design of the ventilation cooling system of the BTTG.
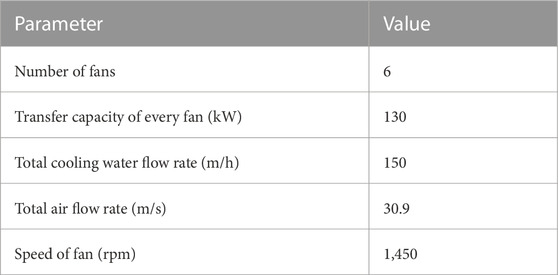
TABLE 2. Cooler design parameters.
The structure of the wind path is modeled according to its design drawings, as shown in Figure 4. Both the stator core and rotor core have radial ventilation vents. When the generator temperature exceeds the limit, the staff will enable the cooler. The cold air is blown by the fans into the position of the rotor ribs, axially from the upstream side through the ribs and then radially into the rotor radial vents, magnetic pole gap, air gap, and stator radial vents. Hot air flows axially from the gap between the stator and the inner wall of the chassis back to the cooler, is cooled by the low-temperature water in the cooler, and is again blown into the generator by fans. The cooler consist of six axial fans and cryogenic cooling water pipes, in which the six axial fans are mounted on the front rack of the main body at intervals of 60° along the circular direction. The upper-layer windings and lower-layer windings, the inside and outside of the stator core, the cooler’s inlet and outlet pipes, thrust tiles, etc., are all equipped with thermometers. These data can be passed to the upper computer, which monitors the staff in real time.
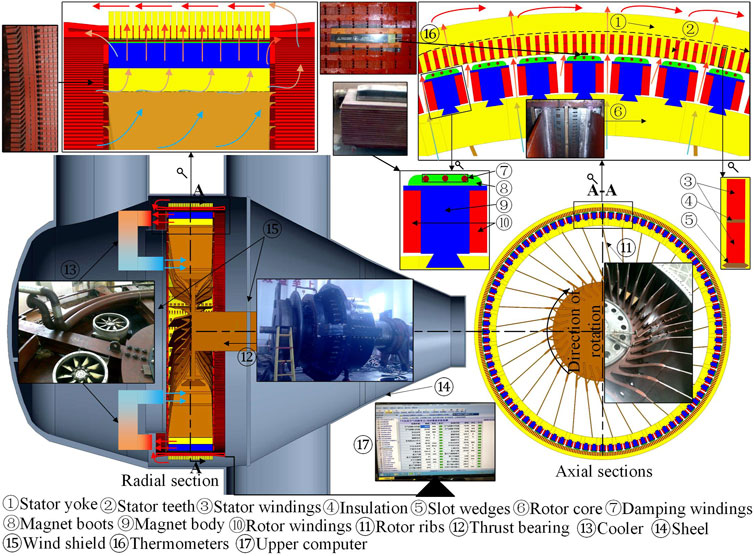
FIGURE 4. Generator structure and wind path.
Due to the periodic nature of the generator structure, the calculation of the 1/11 sector in the direction of the circle can not only save computing resources but also achieve accurate results. Because the generator is usually operated in rated load conditions, the heat sources of the generator are selected as the boundary condition to study the wind path structure. The following simplification and assumptions are made when modeling based on research objectives:
1) Due to the confidentiality of the design drawings of the generator, it is not possible to establish stator ventilation slot steel, and because it is not a research goal, we therefore ignore the effect of the ventilation slot steel on flow and temperature.
2) Ignoring the influence of stator end coil clamps and clamping plates on temperature field. At the same time, the stator windings’ end connection is simplified to ensure that the length of the end protrusion is consistent with the design drawing, but the same slot’s up and down windings are connected.
3) Assuming close fit between the heating parts, regardless of the effect of gap and insulation on heat transfer.
4) Because the generator speed is low, the air flow rate is much less than the speed of sound, so air is considered an incompressible gas. At the same time, the effect of buoyancy and gravity on fluid flow is ignored.
Considering the complexity and irregularity of the computational domains, all domains are discretized into polyhedral grids with fewer cells and higher mesh quality (Tritthart and Gutknecht, 2007). The independence of the grids is tested, where Tis represents the temperature inside the stator, Tlw is the temperature of the lower-layer windings, Tuw is the temperature of the upper-layer windings, and Tos denotes the temperature outside the stator. It is observed that with an increase in the number of grids, the temperatures of the stator core and stator windings gradually decrease and stabilize in the model, as shown in Figure 5. Considering the accuracy of numerical computations and computational costs, the final decision is made to have a total of 22.06 million polyhedral grids within the computational domains. In comparison to 25.42 million grids, this scheme yields a temperature variation rate of less than 3%, implying that the results are independent of grid quantity. The mesh partitioning method of this scheme is adopted for the models discussed in the subsequent sections.
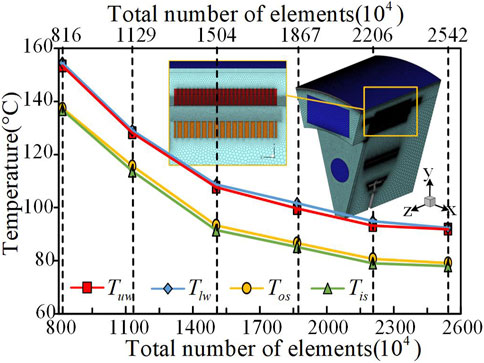
FIGURE 5. Grid-independent test of the generator model.
This paper employs the FEM based on fluid-heat transfer theory to compute the flow field and temperature field of the generator. The FEM utilized in the flow field calculation satisfies the equations of mass conservation, momentum conservation, and energy conservation. Simultaneously, in the temperature field calculation, the three-dimensional heat transfer equations are applied at the interfaces between solid–solid and solid–fluid contact surfaces. The system of equations to be solved is depicted in Eq. 3 (Han et al., 2019; Liu et al., 2020; Han et al., 2021; Li et al., 2022).
where ρ is the density (kg/m3); t represents time (s); u signifies the velocity vector; u, v, and w correspondingly refer to the components in the x, y, and z directions (m/s), respectively; μ is the turbulent viscosity coefficient (kg/m ⋅s); P stands for fluid pressure (Pa); Su, Sv, and Sw denote the generalized source terms in the x, y, and z directions, respectively; T indicates temperature (°C); λ is the thermal conductivity (in W/(m ⋅K)); c represents specific heat capacity [J/(kg ⋅K)]; ST signifies the Joule power density obtained from finite element calculations (W/m3); λx, λy, and λz, respectively, stand for thermal conductivity coefficients in the x, y, and z directions; and qv denotes thermal density (W/m3).
Due to the presence of turbulence in the internal fluid flow of the generator, the SST k − ω model combines the accuracy of the k − ω model in predicting boundary layer behavior under high adverse pressure gradients with the stability of the k − ɛ model in the bulk flow, achieving a better balance between precision and stability Bulat and Bulat (2013); Lin et al. (2014). Therefore, the SST k − ω model provides an improved compromise between accuracy and stability. Moreover, the SST k − ω model exhibits good precision in coupled heat transfer computations (Dang et al., 2018; Tepe, 2021). SIMPLEC is a coherent and enhanced version of the SIMPLE algorithm, widely applicable for numerical simulation of steady state and transient state, turbulent fluid flow, and heat transfer (Van Doormaal and Raithby, 1984). Therefore, for the study of the flow field and temperature field within the generator, numerical simulations are conducted using the SST k − ω turbulent model and the SIMPLEC solution algorithm. This study investigates the steady equilibrium state of the internal fluid within the generator and the dynamic balanced heat transfer within the cooling system. In order to accurately determine the temperature field results, temperature data are collected through thermometers and used as boundary conditions (as shown in Table 3) for the calculations. By calculating the volume of the electromagnetic loss and the corresponding heating part, the heat yield of each part can be calculated, as shown in Figure 6. Damper windings have a heat yield of up to 15.7 kW, followed by stator windings and rotor windings with a heat yield of 46 kW. From the temperature distribution cloud map, it can be seen that because the damper winding and rotor winding are connected to the rotor core, but the rotor part is in a rotating state, the surface air velocity is larger, so the rotor part has a low-temperature region. In addition, the stator winding is partially stationary and the temperature is generally higher. The electromagnetic loss distribution of the generator is accurately analyzed by means of the magnetic current thermal coupling field.
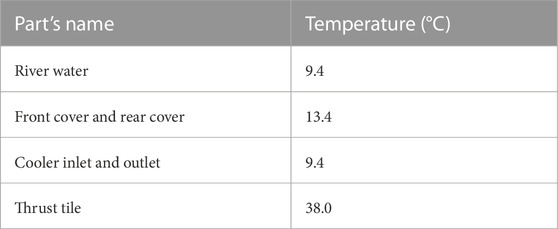
TABLE 3. Boundary condition setting parameters.
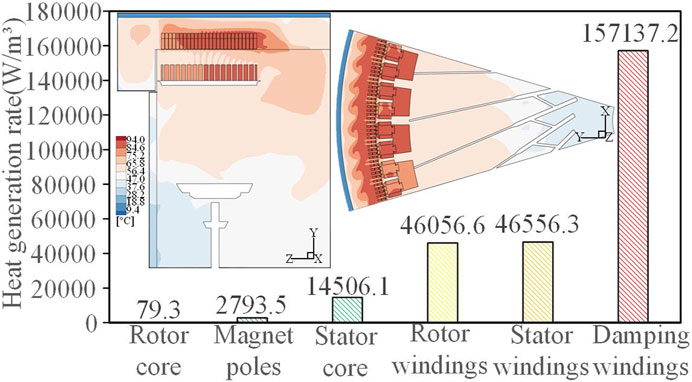
FIGURE 6. Heat yield and temperature distribution of the generator.
The operational data of the Chaijiaxia No.1 generator over a 24-h period are analyzed, as depicted in Figure 7. During the time intervals of 1 AM to 2 AM and 10 AM to 11 AM, the active power output of the generator approaches its rated operational power of 24 MW, indicating that the generator is in a stable rated operational state. By comparing the measured data from this period with the numerical simulation results, a maximum error of 17.2% between the numerical model and experimental outcomes is observed, affirming the validity of the thermal flow field model. Consequently, this model is employed for the subsequent structural redesign numerical simulations.
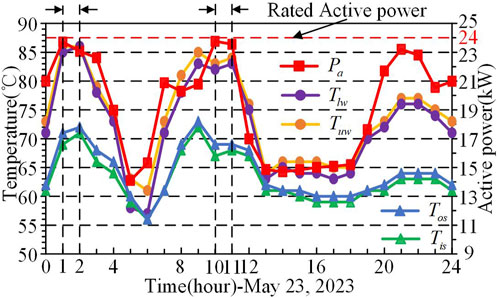
FIGURE 7. Generator 24-h power and temperature variation data.
In this section, a comprehensive framework is constructed to determine the optimal external forced-air cooling VCS within the generator. The complete process diagram of the proposed optimal control strategy is shown in Figure 8. From the process diagram, it can be observed that the generation of the optimal ventilation control strategy involves three modules: initialization design, construction and assessment of the RSM, and multiobjective optimization based on the MOGA. First, design variables and objectives are defined, and experimental points are designed using the two-factor experimental method, followed by numerical computations. Second, based on the numerical computation results, an RSM model with a high degree of fitting is selected, and validation points are generated to verify the RSM. Furthermore, the region with relatively large errors in the RSM is identified, and optimization points are generated to enrich the dataset. Finally, by using the MOGA, the adjusted RSM model is employed to generate the optimal solution, leading to the determination of the Pareto set for different ambient temperatures.
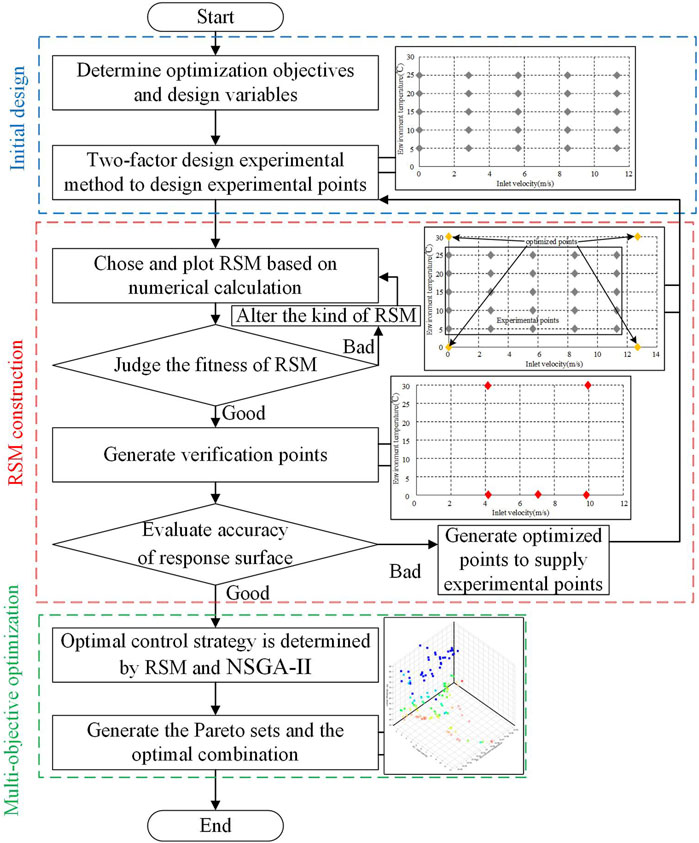
FIGURE 8. Process diagram for the optimal VCS formulation based on the RSM.
Due to variations in latitude and the changing temperatures across seasons, the water temperature will differ, thereby affecting the temperature of the water where the generator is situated. The cooling water for the generator’s cooling system is typically sourced directly or indirectly from the river, and variations in temperature are likely to influence the temperature rise within the generator’s internal components. Relevant hydrological information for Gansu’s Liujiaxia Reservoir, Sichuan’s Jinping Hydroelectric Station, and Hainan’s Songtao Reservoir was obtained according to Qing Fang and Ma (2020); Zhang (2020); Wang (2021). Monthly and seasonal average water temperatures at the same depth for different water bodies, located at the center position of the BTTG studied in this paper, were compiled, as shown in Figure 9.
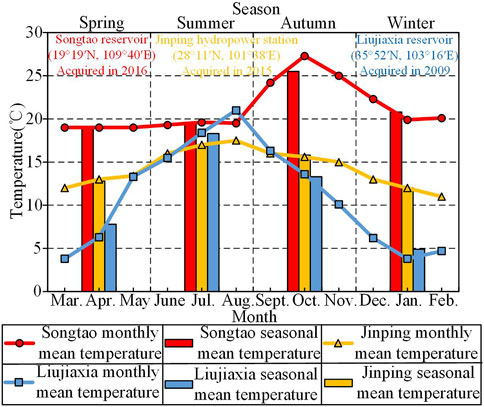
FIGURE 9. Monthly and seasonal average air temperatures for three regions.
Since the research objective is influenced by only two factors: ambient temperature Tenv and the number of cooling fans activated Nf, a two-factor experimental design method was employed for the experimental setup. Considering the seasonal average temperature capable of representing year-round temperature variations, the design range for ambient temperature variation was determined as 5°C–25°C, with a sampling interval of 5°C. Simultaneously, based on the conversion of each fan’s flow rate, the number of fans activated Nf, and the equivalent conversion of the fans’ inlet area into an inlet velocity vfan, the design range for velocity variation was established as 0 to 11.29 m/s, with a sampling interval of 2.82 m/s. The specific experimental design scheme is presented in Table 4.
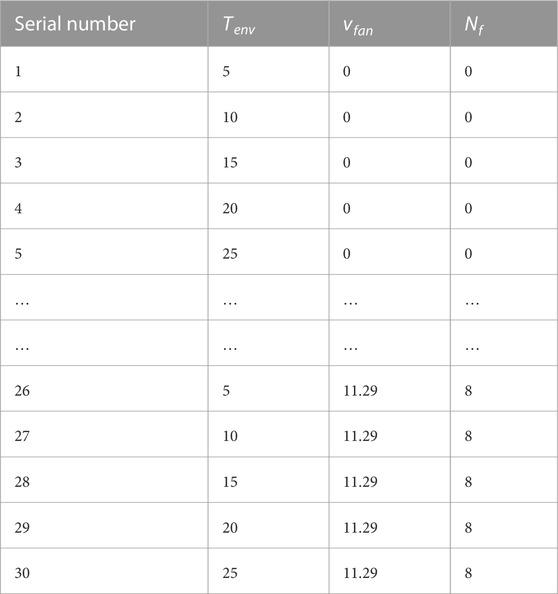
TABLE 4. Design parameters and results of the two-factor design experiment.
In this study, the FEM was employed to compute the flow field and temperature field of the model and compute the numerical values at various temperature measurement points, resulting in corresponding response values. To represent the relationship between design variables and response variables, polynomial regression equations of different orders in the form of the Scheffe linear mixture models can be used to describe this relationship, including linear (first-order) expressions (Eq. 4), quadratic (second-order) expressions (Eq. 5), and cubic (third-order) expressions (Eq. 6) (Piepel et al., 2002).
where
1) Std Dev. is the standard deviation. This value measures the dispersion of a set of data or random variables. For a dataset
where xi represents the value of the i data point and
2) R2 is called the determinant coefficient and is a measure of how well the regression model fits the sample data. The closer R2 is to 1, the better the model fits, and the higher the interpretation of the explanatory variables. Its definition is shown in Eq. 8.
where SSresidual is the sum of squares of residuals, representing the error between the regression model fit and the actual observations; SSmodel is the sum of total squares, indicating the error between the sample data and the overall mean.
3) adj.R2 is an adjusted determinant used to measure how well the regression model fits the sample data. Its mathematical expression is shown in Eq. 9.
where dfresidual is the degree of residual freedom, representing the number of valid observations used in the model minus the estimated number of model parameters and dfmodel is the degree of freedom of the model, representing the number of model parameters.
4) pred.R2 is a predictive determinant used to measure the ability of a regression model to predict unknown data. Its mathematical expression is shown in Eq. 10.
where PRESS is the prediction error and sum of squares to measure the prediction error of the regression model to unknown data.
5) Adeq Precision is used to determine whether the predictive capability of the regression model is sufficiently accurate, as shown in Eq. 11.
Measurement of temperature by observation: inside stator temperature (Tis), lower winding temperature, (Tlw) the upper winding temperature (Tuw), and outside stator temperature (Tos). The distribution trends of the four RSMs are found to be basically consistent, and the reliability and error analysis of different order polynomials is shown in Table 5. According to the above five evaluation indexes and corresponding appropriate value intervals, it is found that the second-order regression equation and the third-order regression equation both meet the requirements of the evaluation interval, with better correlation, applicability, and high accuracy.
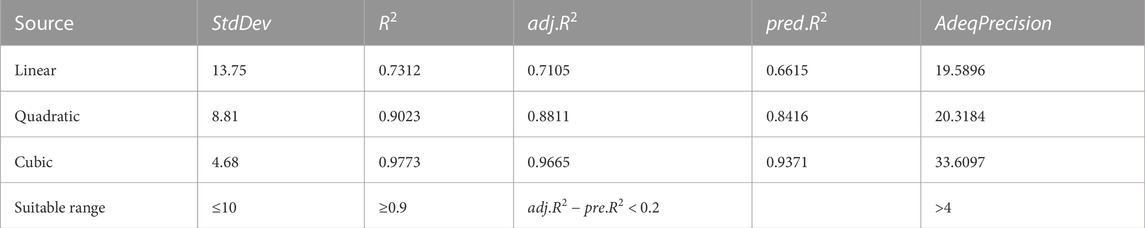
TABLE 5. Analysis of fitting error of polynomial in different orders.
When building an RSM model, it is usually the nonlinear response problem that is characterized as a nonlinear curve or surface throughout the coordinate space Non-probabilistic reliability analysis focuses more on the response relationship within the design interval and less on the response relationship outside the interval Pengya Fang and Wen (2020). The overall interval boundary point needs to be inserted as an optimization point for encrypting RSM data. The optimized RSM is shown in Figure 10. The degree to which the surface fits is known, the first-order linear model is in an underfitting state, and the points above and below the surface are far from the surface, which does not accurately reflect the distribution trend of the sample points. There is a situation of overfitting in the third-order model. Although the experimental points are basically on the surface, the nonlinearity of the surface is too high to reflect the distribution trend of the sample points. Second-order model surfaces reflect the distribution trend of temperature according to the smoother experimental points, so they can be used in the formulation of an optimal ventilation strategy.
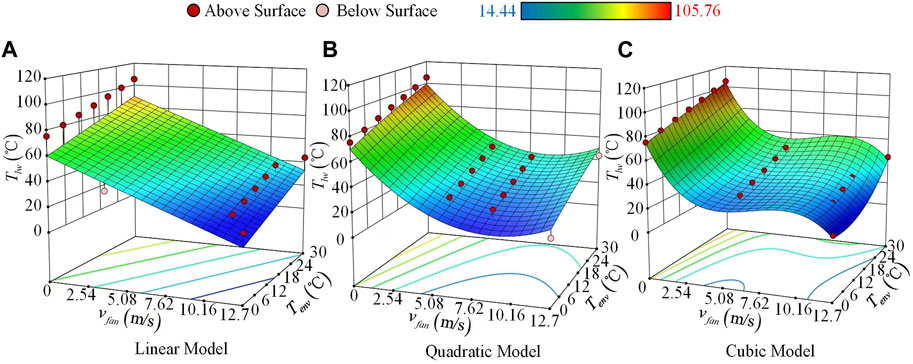
FIGURE 10. RSMs with different order fits. (A) Linear RSM Model. (B) Quadratic RSM Model. (C) Cubic RSM Model.
Based on the results of the analysis, the RSM of the three optimization targets is adjusted locally to make the model more streamlined by removing some of the non-significant items in the polynomials. Second-order fitting regression equations for Nf, Tis, Tos, Tlw, and Tuw are given as Eqs 12–15. By observing the expression of the function, it was found that the coefficient is highly consistent with the form of the argument. The second-order nonlinear relation among ambient temperature, wind speed, and the temperature of the heating component is given in the equations. The second-order term of ambient temperature and the first-order term of wind speed are negatively correlated with the temperature of the heating component. The second-order term of wind speed, the intersection of ambient temperature and wind speed, the first-order term of ambient temperature, and the constant term are positively related to the temperature of the heating parts. Based on the function relation obtained, the theoretical basis for the establishment of the latter mathematical model is provided.
Each solution is treated as an individual in GAs. For each solution, encode it and create a chromosome. Chromosomes undergo an adaptive iteration process and converge to the genetic code that is best suited to survival, which is the best solution to the problem (Guazzelli et al., 2019). However, traditional GAs area search method that does not consider the interaction between design variables, hence susceptible to local optimization (Zhao et al., 2021). The MOGA is a multi-objective optimization problem (MOP) and GA composition. The MOGA is a multi-objective optimization method using Pareto sorting that generates a series of Pareto optimizations based on specific requirements. The MOGA is a more efficient and accessible global optimization than the GA.
MOGAs are commonly used for engineering optimization problems, and different types of MOGAs vary in terms of calculation volume, spatial search coverage, and convergence ability. Among them, the non-dominant sequencing genetic algorithm (NSGA-II) is valued for its better performance in terms of convergence and diversity metrics (Guazzelli et al., 2019). It also creates a random population cluster within the required interval, in which each individual represents a possible solution to the problem. If several parameters need to be optimized, each individual represents a single parameter vector, optimizing the desired parameters simultaneously, as shown in Figure 11. In the iterative genetic process, new individuals are obtained by crossing (maintaining population size and ensuring that new individuals will share the desired quality of their parents), mutations (inserting genetic diversity in the population to avoid local maximums), and screening. Each individual’s multi-objective function is then evaluated, the solution is divided into non-dominant classes, and ranking values are assigned to each class. Choose all solutions for the highest ranked classes to multiply. Select some of the subsequent classes based on the criteria of the elite strategy. The process is repeated until the maximum algebra is set. Finally, it returns the most adaptable individual, which corresponds to the best solution of the problem.
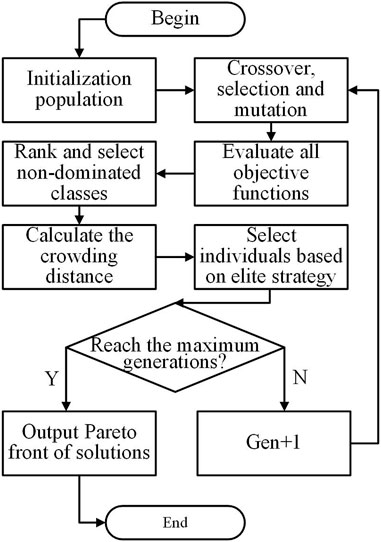
FIGURE 11. Schematic map of NSGA-II.
At present, the hydropower station in the BTTG set inside the external forced-air cooling for heat dissipation and hydropower station stipulated windings, and stator core operating temperature is about 55°C. However, in order to save plant electricity consumption, we ensure the monitored stator core temperature and stator winding temperature do not exceed the operating temperature specified in the operating protocol of 80°C. Only the flow of cooling water in the cooler is adjusted. The generator’s interior is cooled by natural cooling. When the temperature exceeds 80°C, three fans at equal intervals are activated to dissipate the heat. If the temperature continues to increase, six fans are turned on. If the temperature continues to increase, the load on the generator will need to be reduced, and downtime will be required in severe cases. It can be seen that the control strategy of the power station for the fans is relatively simple, and the research has found that the power station in other areas has no good external forced-air cooling VCS. Combined with practical engineering experience, a complete ventilation control strategy needs to consider the following two points:
(1) The opening of fewer fans causes the heat of the heating parts to not be lost in time, thus exceeding the insulation temperature of the components, causing a short-circuit or a fire.
(2) Turn on excessive wind opportunities, resulting in increased power consumption and loss of fan durability. In addition, the temperature difference between the cold air and the heating components causes the formation of a condensate to damage the insulation, causing short-circuits in severe cases.
Quantify the above conditions and ambient temperature as a filtering condition, as shown in Eq. 16. Find the best solution with NSGA-II.
Set the initial population size to 2000, with 400 iterations per time, and set the maximum number of iterations to 20. The entire optimization result generation process is completed in 22 s, while a numerical software-based single-parameter model solving typically takes around 7 h, indicating significant time savings from the MOGA method compared to FEM parameter optimization. At a given temperature, the algorithm gives an optimal set of set optimization goals with better convergence and diversity. Select the point with the smallest error in the optimal set to count the number of blowers that need to be turned on at different ambient temperatures, as shown in Table 6. The number of fans that need to turned on at different ambient temperatures can be obtained, which is the optimal ventilation control strategy.
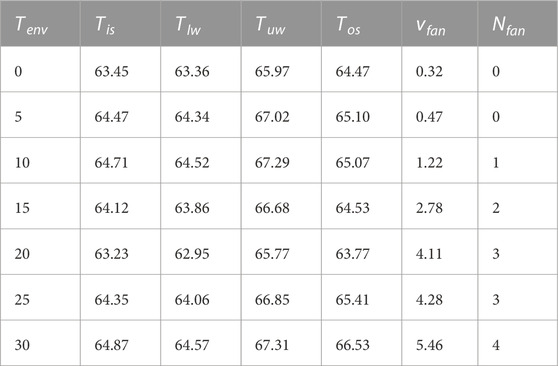
TABLE 6. Results of the optimal ventilation control strategy.
The results of electromagnetic characteristics and temperature field of the generator are obtained by the FEM and validated by experiments. The relationship between ambient temperatures and fans’ flow rate is obtained by means of the RSM and MOGA. The optimal control strategy for external forced-air cooling of the BTTG is obtained.
(1) There is a difference between the electromagnetic characteristics and loss distribution of the generator under the condition of no-load and rated-load. Under the no-load condition, the magnetic density distribution of the rotor magnetic pole body is uneven and stator tooth are also oversaturated. Under the rated-load condition, the stator tooth are also oversaturated, but the magnetic density distribution of the rotor magnetic pole body is uniform. There are obvious magnetic leakage phenomena between rotor magnetic poles. In addition, since the generator reacts for the demagnetic armature, the rated-load condition reduces the stator core loss by 10.6% and the rotor copper consumption by 8.3%. The error between the experiment and the numerical calculation of the coupling field satisfies the requirement of validity. The electromagnetic characteristics of the generator can be obtained by the establishment of the electromagnetic model, and the heat source distribution results are provided for the establishment of the temperature field.
(2) The second-order polynomial RSM was obtained by a two-factor design experiment, and the optimal solution was obtained using the NSGA-II algorithm. The temperature of the monitoring point can be expressed using second-order polynomials with ambient temperature and flow rate of fans, and the form is consistent. In order to keep the internal temperature of the generator in a suitable range, the Pareto solution under restricted conditions can be obtained quickly by using the NSGA-II algorithm compared to the finite element method. Then, according to the solution of air volume equivalent, the corresponding number of fan openings is calculated to get the optimal ventilation control strategy. In the future, the multi-objective optimization algorithm can be used to establish a more detailed operation scheme for the ventilation control strategy by combining numerical calculation and real monitoring data. This operating solution keeps the generator inside at a suitable temperature range, saves electricity consumption at the power plant, and prevents condensate formation.
The original contributions presented in the study are included in the article/Supplementary Materials, further inquiries can be directed to the corresponding authors.
HW: writing–review and editing. YZ: writing–original draft. HS: writing–review and editing. HQ: writing–review and editing. ZG: writing–review and editing. SW: writing–review and editing. WX: writing–review and editing.
The author(s) declare financial support was received for the research, authorship, and/or publication of this article. The authors declare that this study received funding from the National Natural Science Foundation (52179086, 52269022, U2004183, and 52177063), and it was also received funding from the Excellent Young Scholars Project of Henan Province under Grant (232300421070), the University Science and Technology Innovation Talent Support Program of Henan Province under Grant (23HASTIT026), the Science and Technology Project of Henan Province under Grant (232102220080), and the Central Government Guides Local Science and Technology Development Fund Projects (23ZYQA0320).
The author would like to thank the staff of Chaijiaxia Hydroelectric Power Station in Gansu (China) for their help. By discussing the problems related to the BTTG with the staff, the authors had a deeper understanding of them.
Author ZG was employed by Gansu Chaijiaxia Hydropower Co., Ltd.
The remaining authors declare that the research was conducted in the absence of any commercial or financial relationships that could be construed as a potential conflict of interest.
All claims expressed in this article are solely those of the authors and do not necessarily represent those of their affiliated organizations, or those of the publisher, the editors, and the reviewers. Any product that may be evaluated in this article, or claim that may be made by its manufacturer, is not guaranteed or endorsed by the publisher.
Abunike, C. E., Okoro, O. I., and Aphale, S. S. (2022). Intelligent optimization of switched reluctance motor using genetic aggregation response surface and multi-objective genetic algorithm for improved performance. Energies 15, 6086. doi:10.3390/en15166086
Bulat, M., and Bulat, P. (2013). Comparison of turbulence models in the calculation of supersonic separated flows. World Appl. Sci. J. 27 (10), 1263–1266. doi:10.5829/idosi.wasj.2013.27.10.13715
Cao, S.-J., and Ren, C. (2018). *ventilation control strategy using low-dimensional linear ventilation models and artificial neural network. Build. Environ. 144, 316–333. doi:10.1016/j.buildenv.2018.08.032
Ceran, B., Jurasz, J., Wróblewski, R., Guderski, A., Złotecka, D., and Kaźmierczak, Ł. (2020). Impact of the minimum head on low-head hydropower plants energy production and profitability. Energies 13, 6728. doi:10.3390/en13246728
Chakkarapani, K., Thangavelu, T., Dharmalingam, K., and Thandavarayan, P. (2019). Multiobjective design optimization and analysis of magnetic flux distribution for slotless permanent magnet brushless dc motor using evolutionary algorithms. J. Magnetism Magnetic Mater. 476, 524–537. doi:10.1016/j.jmmm.2019.01.029
Dang, D.-D., Pham, X.-T., Labbe, P., Torriano, F., Morissette, J.-F., and Hudon, C. (2018). Cfd analysis of turbulent convective heat transfer in a hydro-generator rotor-stator system. Appl. Therm. Eng. 130, 17–28. doi:10.1016/j.applthermaleng.2017.11.034
Faramarzi, A., Lee, J., Stephens, B., and Heidarinejad, M. (2021). *assessing ventilation control strategies in underground parking garages. Build. Simul. 14, 701–720. doi:10.1007/s12273-020-0677-3
Gu, S.-f., Bian, Z.-y., Zhou, Z.-t., Yang, Y., and Fan, Z.-n. (2023). The disadvantageous influence and improvement measures of stator slot skewed structures on the damper winding loss and stator core loss of tubular hydro-generators. J. Electr. Eng. Technol. 18, 2737–2748. doi:10.1007/s42835-022-01333-7
Guazzelli, P. R. U., de Andrade Pereira, W. C., de Oliveira, C. M. R., de Castro, A. G., and de Aguiar, M. L. (2019). Weighting factors optimization of predictive torque control of induction motor by multiobjective genetic algorithm. IEEE Trans. Power Electron. 34, 6628–6638. doi:10.1109/tpel.2018.2834304
Han, J., Ge, B., and Li, W. (2019). Influence of magnetic permeability of the press plate on the loss and temperature of the end part in the end region of a turbogenerator. IEEE Trans. Industrial Electron. 66, 162–171. doi:10.1109/tie.2018.2826461
Han, J., Jiechen, D., Wang, Y., Wang, C., Ge, B., and Li, W. (2021). Coupled electromagnetic-fluid-thermal analysis for end zone with electric screen in large water-hydrogen-hydrogen cooled turbine generator under different end winding extensions. IEEE Trans. Energy Convers. 36, 2703–2713. doi:10.1109/tec.2021.3061683
Li, W., Cao, Z., and Zhang, X. (2022). Thermal analysis of the solid rotor permanent magnet synchronous motors with air-cooled hybrid ventilation systems. IEEE Trans. Industrial Electron. 69, 1146–1156. doi:10.1109/tie.2021.3057002
Lin, G., Kusterer, K., Ayed, A. H., Bohn, D., and Sugimoto, T. (2014). Conjugate heat transfer analysis of convection-cooled turbine vanes using -re transition model. Int. J. Gas Turbine, Propuls. Power Syst. 6, 9–15. doi:10.38036/jgpp.6.3_9
Liu, B., Peng, Z., Liao, S., Liu, T., and Lu, J. (2023). A multi-objective optimization model for the coordinated operation of hydropower and renewable energy. Front. Energy Res. 11, 1193415. doi:10.3389/fenrg.2023.1193415
Liu, W., Li, W., Luo, S., Huang, X., Li, D., Li, Z., et al. (2020). Influence of a novel stator teeth internal ventilation structure on air-cooled turbo-generator parameters and stator temperature. IEEE Access 8, 122422–122433. doi:10.1109/access.2020.3007339
Nouvellet, P., Bhatia, S., Cori, A., Ainslie, K. E. C., Baguelin, M., Bhatt, S., et al. (2021). Reduction in mobility and covid-19 transmission. Nat. Commun. 12, 1090. doi:10.1038/s41467-021-21358-2
Pathania, S., Sharma, N., and Handa, S. (2017). Optimization of culture conditions using response surface methodology for synergism production of cellulase, xylanase and pectinase by rhizopus delemar f2 under solid state fermentation. J. Pharmacogn. Phytochemistry,Journal Pharmacogn. Phytochemistry.
Pei, Z., Zhao, J., Song, J., Zong, K., He, Z., and Zhou, Y. (2021). Temperature field calculation and water-cooling structure design of coreless permanent magnet synchronous linear motor. IEEE Trans. Industrial Electron. 68, 1065–1076. doi:10.1109/tie.2020.2967707
Pellegrino, G., and Cupertino, F. (2010). “Fea-based multi-objective optimization of ipm motor design including rotor losses,” in Proceedings of the 2010 IEEE Energy Conversion Congress and Exposition, Atlanta, GA, USA, September 2010. doi:10.1109/ecce.2010.5618310
Pengya Fang, S. L., and Wen, Z. (2020). Multi-disciplinary reliability design optimization method based on interval uncertainty. Beijing: Aviation Industry Press.
Piepel, G. F., Szychowski, J. M., and Loeppky, J. L. (2002). Augmenting scheffé linear mixture models with squared and/or crossproduct terms. J. Qual. Technol. 34, 297–314. doi:10.1080/00224065.2002.11980160
Qing Fang, W. S. S. X. B. L., and Ma, J. (2020). Study on numerical simulation of water temperature in songtao reservoir. Water Power 46, 6–11. doi:10.1080/01495728408961817
Qiu, H. (2022). Theory of electrical machines and simulation analysis of electromagnetics field. Chongqing: Chongqing University Press.
Qiu, H., and Fan, X. (2018). The influence of asymmetric pole shoe on synchronous hydro generator: influence of asymmetric pole shoe on synchronous hydro generator. IEEJ Trans. Electr. Electron. Eng. 13, 1654–1659. doi:10.1002/tee.22728
Qiu, H., Zou, X., and Fan, X. (2020). Effect of magnetic slot wedge on the performance of bulb tubular turbine generator. COMPEL - Int. J. Comput. Math. Electr. Electron. Eng. 39, 915–925. doi:10.1108/compel-11-2019-0457
Quaranta, E., Bahreini, A., Riasi, A., and Revelli, R. (2022). The very low head turbine for hydropower generation in existing hydraulic infrastructures: state of the art and future challenges. Sustain. Energy Technol. Assessments 51, 101924. doi:10.1016/j.seta.2021.101924
Ren, C., and Cao, S.-J. (2020). Implementation and visualization of artificial intelligent ventilation control system using fast prediction models and limited monitoring data. Sustain. Cities Soc. 52, 101860. doi:10.1016/j.scs.2019.101860
Tepe, A. (2021). Heat transfer enhancement of fin-tube heat exchangers using punched triangular ramp vortex generator on the fin surface. Int. J. Heat Mass Transf. 174, 121326. doi:10.1016/j.ijheatmasstransfer.2021.121326
Tritthart, M., and Gutknecht, D. (2007). Three-dimensional simulation of free-surface flows using polyhedral finite volumes. Eng. Appl. Comput. Fluid Mech. 1, 1–14. doi:10.1080/19942060.2007.11015177
Van Doormaal, J. P., and Raithby, G. D. (1984). Enhancements of the simple method for predicting incompressible fluid flows. Numer. Heat. Transf. 7, 147–163. doi:10.1080/01495728408961817
Wang, X. (2021). Study on water temperature of high dam Reservoir between cascade hydropower station in upper yellow river. Master’s thesis. Xi’an, China: Xi’an University of Technology. doi:10.27398/d.cnki.gxalu.2021.000822
Xu, X., Wang, S., Sun, Z., and Xiao, F. (2009). *a model-based optimal ventilation control strategy of multi-zone vav air-conditioning systems. Appl. Therm. Eng. 29, 91–104. doi:10.1016/j.applthermaleng.2008.02.017
Zhan, Y., Kong, K., Xu, G., and Zhao, H. (2017). Damper current analysis of hydro-generators considering interbar currents. In Proceedings of the 2017 IEEE Energy Conversion Congress and Exposition (ECCE), Cincinnati, OH, USA, October 2017
Zhang, D. (2020). Research on water temperature regulation technique of large reservoirs based on artificial intelligence algorithm–A case study for jinping-I hydropower station. Ph.D. thesis. Beijing, China: China Institute of Water Resources and Hydropower Research. doi:10.27646/d.cnki.gsldy.2020.000008
Zhao, W., Ma, A., Ji, J., Chen, X., and Yao, T. (2020). Multiobjective optimization of a double-side linear vernier pm motor using response surface method and differential evolution. IEEE Trans. Industrial Electron. 67, 80–90. doi:10.1109/tie.2019.2893848
Zhao, W., Yang, Z., Liu, Y., and Wang, X. (2021). Analysis of a novel surface-mounted permanent magnet motor with hybrid magnets for low cost and low torque pulsation. IEEE Trans. Magnetics 57, 1–4. doi:10.1109/tmag.2021.3057391
Zhou, Z.-T., Yang, Y., Xiao, K., Fan, Z.-N., Bian, Z.-Y., Wen, K., et al. (2020). Analysis and treatment of an overheated ablated fault on the pole shoe surface of a large tubular hydro-generator. IEEE Access 8, 127929–127938. doi:10.1109/access.2020.3008253
Zhu, H., Shen, S., and Wang, X. (2021a). Multiobjective optimization design of outer rotor coreless bearingless permanent magnet synchronous motor. IEEE J. Emerg. Sel. Top. Power Electron. 9, 5489–5498. doi:10.1109/jestpe.2021.3072773
Keywords: bulb tubular turbine generator, ventilation control strategy, finite element method, response surface method, multiobjective genetic algorithm
Citation: Wei H, Zhang Y, Song H, Qiu H, Guan Z, Wang S and Xie W (2024) Design of the external forced air cooling control strategy for the bulb tubular turbine generator based on multi-objective optimization. Front. Energy Res. 11:1289263. doi: 10.3389/fenrg.2023.1289263
Received: 05 September 2023; Accepted: 05 December 2023;
Published: 08 January 2024.
Edited by:
Ellen B. Stechel, Arizona State University, United StatesReviewed by:
Hamid Reza Rahbari, Aalborg University, DenmarkCopyright © 2024 Wei, Zhang, Song, Qiu, Guan, Wang and Xie. This is an open-access article distributed under the terms of the Creative Commons Attribution License (CC BY). The use, distribution or reproduction in other forums is permitted, provided the original author(s) and the copyright owner(s) are credited and that the original publication in this journal is cited, in accordance with accepted academic practice. No use, distribution or reproduction is permitted which does not comply with these terms.
*Correspondence: Han Wei, aGFud2VpQGx1dC5lZHUuY24=; Yukun Zhang, MjEyMDgwNzA0MDA1QGx1dC5lZHUuY24=
Disclaimer: All claims expressed in this article are solely those of the authors and do not necessarily represent those of their affiliated organizations, or those of the publisher, the editors and the reviewers. Any product that may be evaluated in this article or claim that may be made by its manufacturer is not guaranteed or endorsed by the publisher.
Research integrity at Frontiers
Learn more about the work of our research integrity team to safeguard the quality of each article we publish.