- 1CSG Zhuhai Power Grid Corporation, Zhuhai, China
- 2School of Electrical Engineering, Xi’an Jiaotong University, Xi’An, China
The back-to-back frequency converter plays a vital role in the formation of the fractional frequency transmission system Despite their numerous advantages, however, impacted by the unique impedance characteristics of power electronics, the wide-band oscillations occur more frequency as well as more common recently, which have posed great challenges to the system operation and raised great concern over the researchers worldwide. To address this issue and properly investigate the impedance characteristics of the back-to-back frequency converter, this manuscript establishes the small-signal impedance of the back-to-back frequency converter with inner current control loop and outer voltage/power control loop in the synchronous reference (
1 Introduction
Power electronic is a potential technology, which has made significant advance in the power grid with the progress of science. Over the past few years, new energy power generation especially wind power generation has gradually replaced traditional thermal power generation as the main form Liu et al. (2018); Li et al. (2022). Offshore wind power is a new form of power generation which is different from onshore wind power. When it comes to wind conditions, offshore wind power is better than onshore in the following aspects: strong wind speed, less turbulence, stable wind, and less impact on human life, etc. The fractional frequency transmission system (FFTS) is a new type of transmission method, which changes the 50 Hz frequency power to 50/3 Hz frequency power during transmission. The equivalent impedance of transmission lines can be reduced and the power transmission capacity is improved through this type of system (Li et al., 2019; Pan and Wu, 2022; Wang et al., 2006; Wei et al., 2015; Alam et al., 2023; Wang et al., 2013; Wang et al., 2023; Zhang et al., 2022; Wen et al., 2016; Fang et al., 2018). The development of offshore wind power generation has provided a new application to fractional frequency transmission system. The grid-connected technology for offshore wind power generation mainly uses conventional high-voltage AC transmission (HVAC) near shore and higher-voltage DC transmission (HVDC) over longer distances currently. Hence, the fractional frequency transmission has a broad developmental prospect in the application of offshore wind power grid (Zhang et al., 2017; Luo et al., 2020).
On the other hand, the fractional frequency transmission system contains large amount of power electronics whose interaction with transmission lines and other power electronics may cause serious broadband oscillation problems (Sun et al., 2019; Wang et al., 2014; Wang et al., 2018; Zhang et al., 2020). To deal with the system instability issue, the state-space analysis method is a common practice. However, it encounters the curse of dimensionality and requires access to the detailed information of the whole system. Hence, impedance-based stability assessment method, as an emerging stability analysis method, has been fully applied in analyzing system stability. The aforementioned method assess stability by measured impedance which can effectively protect trade secret and user privacy (Xu et al., 2015; Pinares and Bongiorno, 2016; Wen et al., 2016; Cao et al., 2022).
Different from traditional interlinking converters (Xiong et al., 2016), the back-to-back frequency converter have both industrial and fractional frequency ports and serve as interfacing media to interconnect industrial and fractional frequency grids. If the industrial or fractional frequency impedance is utilized to assess the stability of a grid-tied interlinking converter system, the coupling interaction between the industrial and fractional frequency sides of the interlinking converter cannot be effectively analyzed. In (Zhang et al., 2021), a hybrid AC/DC admittance is proposed. If the converter is stable when operating standalone, the hybrid AC/DC admittance is guaranteed to not contain any right half-plane (RHP) pole. According to the research method of establishing hybrid impedance in (Zhang et al., 2021), a hybrid impedance considering both industrial and fractional frequency ports is proposed in the following manuscript.
In this paper, the small-signal impedance model of the back-to-back frequency converter is established according to the research method posted in Zhang et al. (2022), and the General Nyquist Criterion (GNC) is applied when analyzes the stability of system (Cao et al., 2017; Wen et al., 2017). The small-signal impedance model simplifies the analysis process by making the stability of the system dependent on the parameters of the converter itself and the output impedance of the AC grids connected to both ports (Liao and Wang, 2020). The simulation is verified by MATLAB/Simulink software to prove the correctness of the established model, and the stability analysis of the grid-tied interlinking converter system is carried out by the established impedance model.
The rest of this paper includes four sections. Section 2 shows the main circuit diagram and corresponding controller system of the back-to-back frequency converter. Section 3 shows the establishment of the back-to-back frequency converter small-signal model. Then, by using the determinant-based GNC, Section 4. Assesses the stability of a grid-tied interlinking converter system. Section 5 presents simulation results to verify the proposed model. Section 6 is the conclusion.
2 Main circuit diagram and corresponding controller system
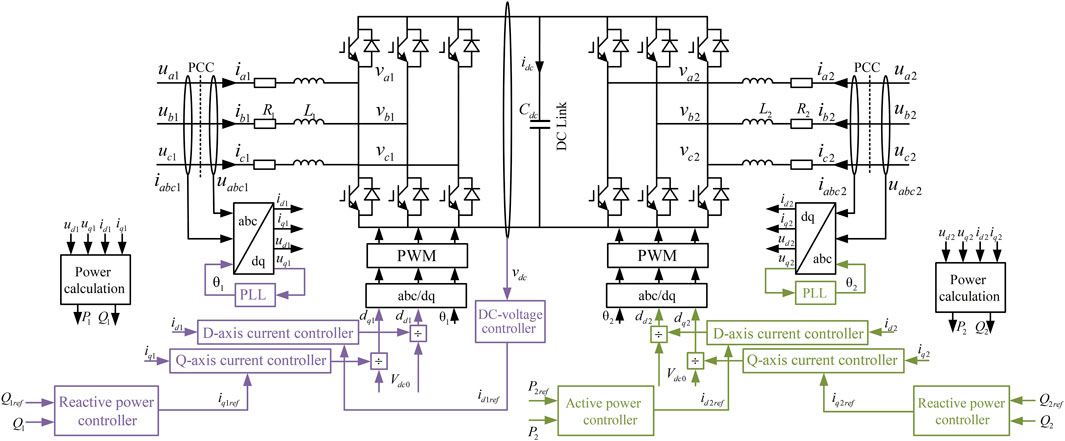
Figure 1 shows the circuit diagram of a back-to-back frequency converter along with its controller system, including an inner current control loop and an outer voltage/power control loop. With respect to Figure 1, the back-to-back frequency converter consists of two AC/DC converters and a DC intermediate link. The left-hand-side AC/DC converter takes charge of the industrial frequency side while the right-hand-side AC/DC converter is responsible for the fractional frequency side. These two AC/DC converters are coupled together through the DC intermediate link whose equivalent capacitor is
With respect to Figure 1, The dynamics of each side of the converter is governed by.
where
where
where
While the inner current control loops of the industrial and fractional frequency sides are consistent, their outer control loops are different. Notice that a stable DC voltage of the intermediate DC link is the suppressed premise for the security and steady operation of the back-to-back frequency converter. To this end, by labeling the reactive power injected to the PCC of the industrial frequency side as
where
The outer control loop of the fractional frequency side changes with different control objectives. For example, when the fractional frequency port is connected to wind farms or photovoltaics, the fractional frequency side of the back-to-back frequency converter is controlled as a V/f mode. In contrast, when the fractional frequency port is connected to hydropower stations, the fractional frequency side of the back-to-back frequency converter can be controlled by P/Q control mode. Note that the control mode does not impact the following system stability analysis. Without loss of generality, the fractional frequency port is controlled by a P/Q control mode within this manuscript. Correspondingly, the outer control loop of the fractional frequency side is expressed by
where
3 Establishment of the back-to-back frequency converters small-signal model
3.1 Small-signal model of main circuit
To analysis the stability of a hybrid industrial/fractional frequency.
System, the traditional approach is to treat the hybrid industrial/fractional frequency system as a single industrial (fractional) frequency system. However, the coupling interaction between the industrial and fractional frequency sides cannot be effectively analyzed in this way. To thoroughly address such issue, a hybrid impedance taking both industrial and fractional frequency sides of the converter into consideration is proposed in the following manuscript.
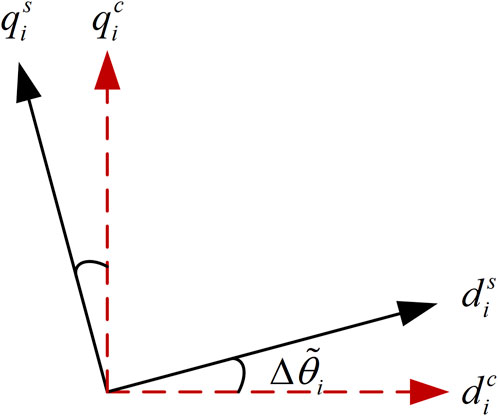
Impacted by the dynamics of synchronization, the system has two frames: one is the system
where
3.2 Influence of PLL
Phase-locked loop (PLL) plays a key role in locking the phase angle of PCC phase voltages and therefore, ensuring that the converter stays synchronized with the grid (Fang et al., 2018). In a steady state, the controller
By approximating cos
Similarly, the relationships between the modulation signal and voltage in the system and controller
Under steady-state conditions, the relationship of variables in two frames is shown as follows:
As Figure 3 shows, the PLL output angle is
where
Define
By substituting for
(9), (10), and (11) are further expressed by
3.3 Controller and PWM modulation
Based on the converter modulation process, the terminal voltage of the converter is related to the modulation signal in the system
Frame as
By canceling the steady-state values and considering small-signal perturbations, (22) is derived as
where
Note that the industrial frequency side is coupled together with the fractional frequency side through the DC intermediate link. Once a disturbance occurs on one side, it will propagate to the other side through the DC voltage of the intermediate DC link. According to the basis of energy conservation and neglecting the switching losses caused by PWM modulation, it is noted that the sum of the reactive power of the three-phase circuit is zero, so that between the DC and AC sides of the converter, there is
By canceling the steady-state values and considering small-signal perturbations,
Together with (23) and (25), the small-signal perturbation of the converter terminal voltage is derived as
where
The back-to-back frequency converter is controlled by an outer voltage/power controller. For the power flow control case, as shown in Zhao and Guo (2009), the active and reactive power are obtained by calculating the voltage and current in
By doing linearization to (30) and considering (25), the small-signal representation of the DC voltage and power is described as (31).
Where
According to (3), the small-signal representation of the inner current control loop is described as
Where
According to (4) and (5), the small-signal representation of the outer voltage/power control loop is described as
where
3.4 Small-signal model of the back-to-back frequency converter
The small-signal model of the back-to-back frequency converter with inner current control loop and outer voltage/power control loop is shown in Figure 4, where
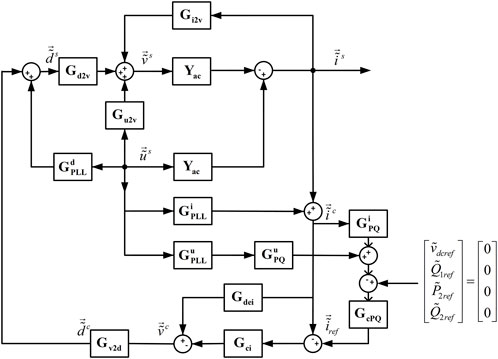
FIGURE 4. Small-signal model of the back-to-back frequency converter with inner current control loop and outer voltage/power control loop.
Solving the equations represented by Figure 4, the output impedance of the back-to-back frequency converter is
where
4 Stability analysis using the proposed model
For Single Input Single Output (SISO) systems, the traditional Nyquist stability criterion can be used to discriminate the stability. However, for Multiple Input Multiple Output (MIMO) systems, the traditional Nyquist stability criterion cannot be applied. The General Nyquist Criterion (GNC) is a generalization of the Nyquist stability criterion to MIMO systems. For MIMO systems, the characteristic equations of the system are established, and the stability criterion is performed by drawing the generalized Nyquist curve.
One line diagram representation of the back-to-back frequency converter system under study is shown in Figure 5.
As reported by Wen et al. (2015), when using impedance-basis stability analysis for a grid-tied converter system, Nyquist stability criterion is based on the impedance ratio of the grid-side impedance and the converter impedance as
Since the grid voltage can be assumed to be stable without the converter and the converter to be stable when the grid impedance is zero, the grid-tied converter system is stable if the satisfies the GNC. According to the GNC, system stability can be determined by checking whether the Nyquist diagram encircles point.
5 Simulation result
5.1 Verification of the back-to-back frequency converter small-signal model
Based on the theoretical derivation of the small-signal impedance of the back-to-back converter, the circuit model of the converter is established in the MATLAB/Simulink environment and the small-signal impedance measurement can be performed. To obtain the value of the small-signal impedance of the back-to-back converter, four linearly independent small-signal voltages and small-signal currents are measured as shown in Wen et al. (2015). The first sinusoidal perturbation signal with certain frequency is generated on the
Hence, the measured impedance of the back-to-back frequency converter can be derived as
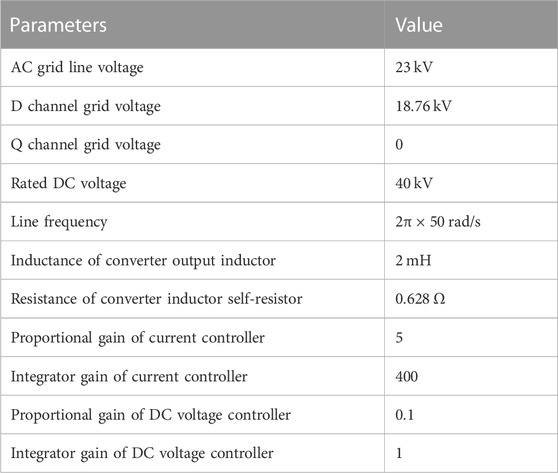
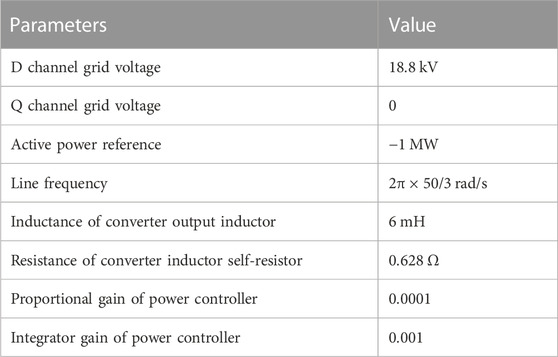
Using the system and control parameter values listed in Table.
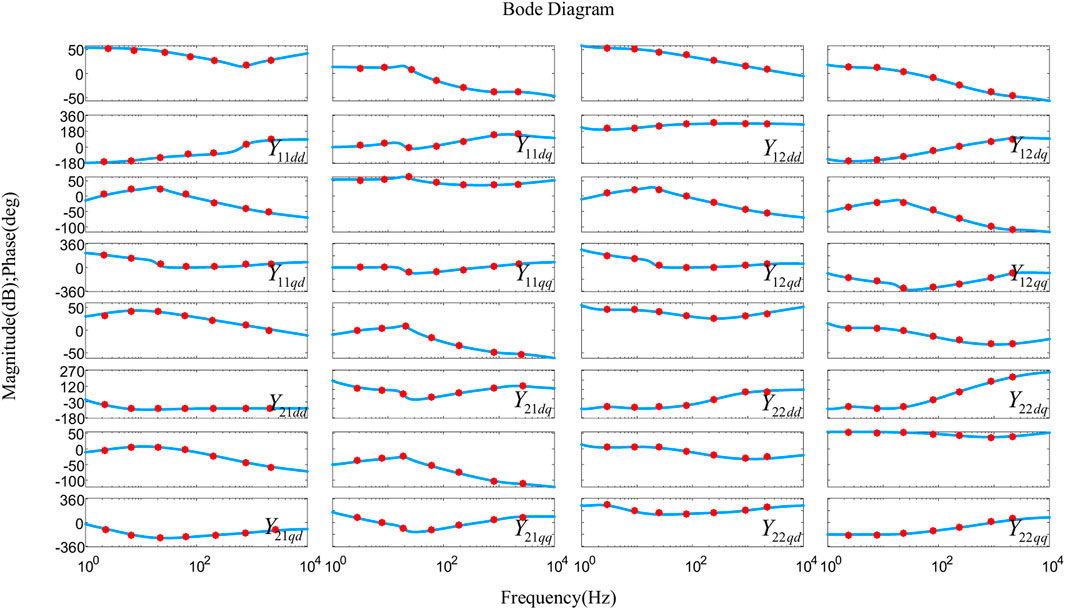
Table 1 and Table 2, the Bode diagram of the converter is plotted in Figure 6. The blue lines show the calculated impedance based on (40), whereas the red dots are the measured impedance. It can be figured out that the red dots match to the impedance curves, verifying the effectiveness and accuracy of the back-to-back frequency converter small-signal model. Notice that when the small-signal disturbance voltage is added, a corresponding small-signal disturbance current is generated and the whole converter remains in stable operation. Hence, the small-signal impedance can be measured only when the converter can operate independently and stably.
5.2 Verification of the stability analysis
Figure 7 Shows the time-domain simulation results of the back-to-back frequency converter. In the simulation, the converter system is stable from 0 to 2.5 s. At 2.5 s, the proportional gain of inner current controller at industrial frequency port
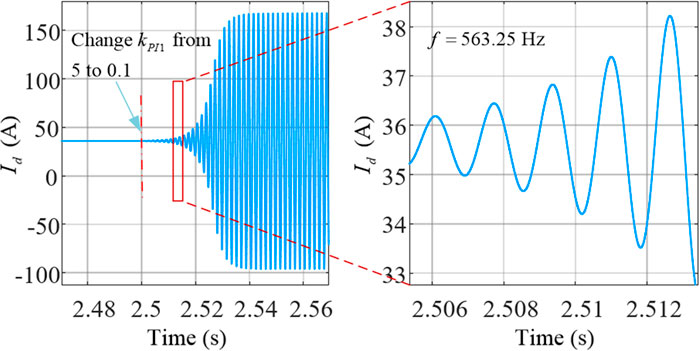
FIGURE 7.
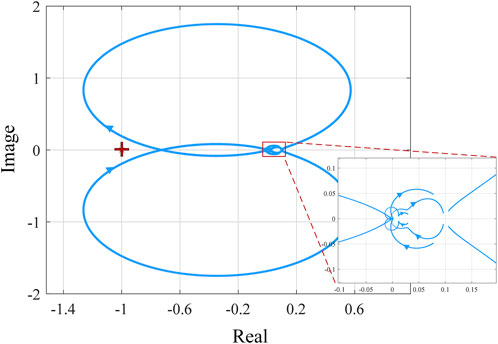
Applying GNC to impedance ratio
The proportional gain of the outer DC voltage controller can also affect the stability of the system. Figure 10 shows the time-domain simulation results of the back-to-back frequency converter. In the simulation, the converter system is stable from 0 to 2.5 s. At 2.5 s, the proportional gain of outer DC voltage controller at industrial frequency port
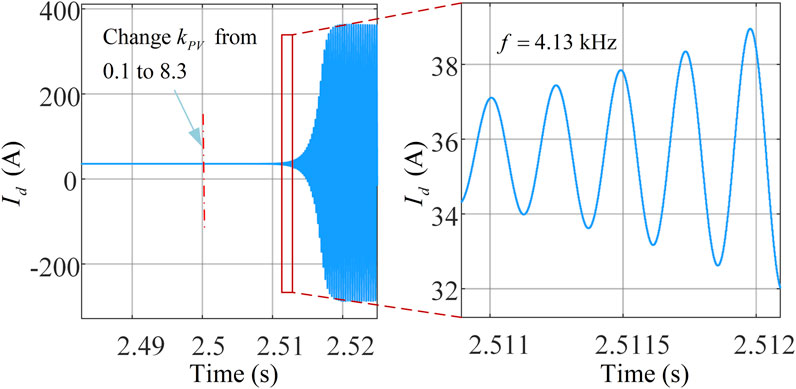
FIGURE 10.
Applying GNC to impedance ratio L, stability conditions can be seen in Figure 11. The closer the pole is to the imaginary axis, the more unstable the system is. When
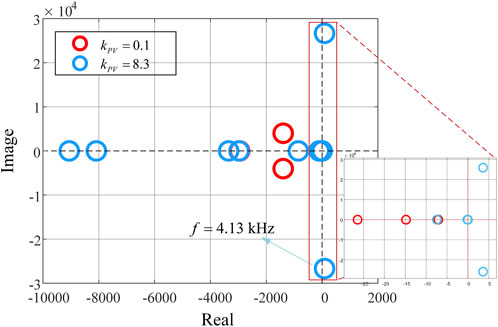
FIGURE 11. The pole distribution map of the closed-loop system with different DC voltage controller parameters.
6 Conclusion
This paper focuses on the analysis of the back-to-back frequency converter with inner current control loop and outer voltage/power control loop. Firstly, the small-signal impedance model of the converter used for fractional frequency transmission system is proposed. Then, the stability analysis of the grid-tied interlinking converter system is conducted which divides the system into two parts: the grids connected to both ports of the converter and the converter. The stability of the whole system is determined by the open-loop transfer function based on the small-signal impedance model, and according to the GNC, the stability can be obtained by judging whether system’s characteristic loci encloses point
Data availability statement
The original contributions presented in the study are included in the article/Supplementary Material, further inquiries can be directed to the corresponding author.
Author contributions
ZC: Writing–review and editing. JH: Writing–original draft. JC: Writing–review and editing. DG: Writing–review and editing. HZ: Writing–original draft. XW: Writing–review and editing.
Funding
The author(s) declare financial support was received for the research, authorship, and/or publication of this article. This work was supported by the Technology Project of the China Southern Power Grid [030400KK52220025 (GDKJXM20220764)].
Conflict of interest
Authors ZC, JC, and DG were employed by the company CSG Zhuhai Power Grid Corporation.
The remaining authors declare that the research was conducted in the absence of any commercial or financial relationships that could be construed as a potential conflict of interest.
Publisher’s note
All claims expressed in this article are solely those of the authors and do not necessarily represent those of their affiliated organizations, or those of the publisher, the editors and the reviewers. Any product that may be evaluated in this article, or claim that may be made by its manufacturer, is not guaranteed or endorsed by the publisher.
References
Alam, M. S., Chowdhury, T. A., Dhar, A., Al-Ismail, F. S., Choudhury, M. S. H., Shafiullah, M., et al. (2023). Solar and wind energy integrated system frequency control: a critical review on recent developments. Energies 16 (2), 812. doi:10.3390/en16020812
Cao, W., Ma, Y., Wang, F., Tolbert, L. M., and Yang, L. (2017). D-Q impedance based stability analysis and parameter design of three-phase inverter-based AC power systems. IEEE Trans. Industrial Electron. 64 (7), 6017–6028. doi:10.1109/TIE.2017.2682027
Cao, Y., Zhou, B., Chung, C. Y., Shuai, Z., Hua, Z., and Sun, Y. (2022). “Dynamic modelling and mutual coordination of electricity and watershed networks for spatio-temporal operational flexibility enhancement under rainy climates,” in IEEE Transactions on Smart Grid, Smart Grid, IEEE Transactions on, IEEE Trans. Smart Grid, 3450–3464. doi:10.1109/TSG.2022.3223877
Fang, J., Li, X., Li, H., and Tang, Y. (2018). “Stability improvement for three-phase grid-connected converters through impedance reshaping in quadrature-axis,” in IEEE Transactions on Power Electronics, Power Electronics, IEEE Transactions on, IEEE Trans. Power Electron 33 (10), 8365–8375. doi:10.1109/TPEL.2017.2777972
Li, J., Zhang, X., Wu, Z., Zhou, S., and Chen, M. (2019). “Grid interconnection via fractional frequency transmission system,” in 2019 9th International Conference on Power and Energy Systems (ICPES), Power and Energy Systems (ICPES), 2019 9th International Conference On, December, 1–6. doi:10.1109/ICPES47639.2019.9105624
Li, Z., Ma, Z., Yi, C., Zhang, X., Cheng, X., and Zhang, Y. (2022). Systems metabolic engineering of Corynebacterium glutamicum for high-level production of 1,3-propanediol from glucose and xylose. ACEEE 70, 79–88. doi:10.1016/j.ymben.2022.01.006
Liao, Y., and Wang, X. (2020). Impedance-based stability analysis for interconnected converter systems with open-loop RHP Poles. IEEE Trans. Power Electron. 35 (4), 4388–4397. doi:10.1109/TPEL.2019.2939636
Liu, H., Xie, X., and Liu, W. (2018). “An oscillatory stability criterion based on the unified dq-frame impedance network model for power systems with high-penetration renewables,” in IEEE Transactions on Power Systems, Power Systems, IEEE Transactions on, IEEE Trans. Power Syst, 3472–3485. doi:10.1109/TPWRS.2018.2794067
Luo, J., Zhang, X., Xue, Y., Gu, K., and Wu, F. (2020). “Harmonic analysis of modular multilevel matrix converter for fractional frequency transmission system,” in IEEE Transactions on Power Delivery, Power Delivery, IEEE Transactions on, IEEE Trans. Power Delivery, 1209–1219. doi:10.1109/TPWRD.2019.2939312
Pan, W., and Wu, X. (2022). “Design of DSOGI-PLL for power converters tied to fractional frequency transmission system,” in Proceedings of 2022 IEEE 5th International Electrical and Energy Conference, CIEEC, 5056–5060. doi:10.1109/CIEEC54735.2022.9845998
Pinares, G., and Bongiorno, M. (2016). Modeling and analysis of VSC-based HVDC systems for DC network stability studies. IEEE Trans. Power Deliv. 31 (2), 848–856. doi:10.1109/TPWRD.2015.2455236
Sun, J. (2011). “Impedance-based stability criterion for grid-connected inverters,” in IEEE Transactions on Power Electronics, Power Electronics, IEEE Transactions on, IEEE Trans. Power Electron, 3075–3078. doi:10.1109/TPEL.2011.2136439
Sun, J., Wang, G., Du, X., and Wang, H. (2019). “A theory for harmonics created by resonance in converter-grid systems,” in IEEE Transactions on Power Electronics, Power Electronics, IEEE Transactions on, IEEE Trans. Power Electron, 3025–3029. doi:10.1109/TPEL.2018.2869781
Wang, G., Du, X., Wang, H., and Sun, J. (2018). “A theory for resonance-generated harmonics of grid-connected converters,” in 2018 IEEE 19th Workshop on Control and Modeling for Power Electronics (COMPEL), Control and Modeling for Power Electronics (COMPEL), 2018 IEEE 19th Workshop, June 1, 2018, 1–6. doi:10.1109/COMPEL.2018.8460109
Wang, H., Lei, H., and Pei, X. (2023). Research on an adaptive compound control strategy of a hybrid compensation system. Processes 11 (7), 2109. doi:10.3390/pr11072109
Wang, X., Blaabjerg, F., Chen, Z., and Wu, W. (2013). “Modeling and analysis of harmonic resonance in a power electronics based AC power system,” in 2013 IEEE Energy Conversion Congress and Exposition, Energy Conversion Congress and Exposition (ECCE) (2013 IEEE), 5229–5236. doi:10.1109/ECCE.2013.6647408
Wang, X., Blaabjerg, F., and Wu, W. (2014). Modeling and analysis of harmonic stability in an AC power-electronics-based power system. IEEE Trans. Power Electron. 29 (12), 6421–6432. doi:10.1109/TPEL.2014.2306432
Wang, X., Cao, C., and Zhou, Z. (2006). Experiment on fractional frequency transmission system. IEEE Trans. Power Syst. 21 (1), 372–377. doi:10.1109/TPWRS.2005.860923
Wei, X., Wang, X., Meng, Y., and Liu, S. (2015). Experiment on grid connection of wind turbines in fractional frequency wind power generation system. Proc. CSEE 5, 1089–1096. doi:10.13334/j.0258-8013.pcsee.2015.05.009
Wen, B., Boroyevich, D., Burgos, R., Mattavelli, P., and Shen, Z. (2015). “Small-signal stability analysis of three-phase AC systems in the presence of constant power loads based on measured d-q frame impedances,” in IEEE Transactions on Power Electronics, Power Electronics, IEEE Transactions on, IEEE Trans. Power Electron 30 (10), 595263. doi:10.1109/TPEL.2014.2378731
Wen, B., Boroyevich, D., Burgos, R., Mattavelli, P., and Shen, Z. (2016). Analysis of D-Q small-signal impedance of grid-tied inverters. IEEE Trans. Power Electron. 31 (1), 675–687. doi:10.1109/TPEL.2015.2398192
Wen, B., Boroyevich, D., Burgos, R., Mattavelli, P., and Shen, Z. (2017). “Inverse nyquist stability criterion for grid-tied inverters,” in IEEE Transactions on Power Electronics, Power Electronics, IEEE Transactions on, IEEE Trans. Power Electron, 1548–1556. doi:10.1109/TPEL.2016.2545871
Wen, B., Dong, D., Boroyevich, D., Burgos, R., Mattavelli, P., and Shen, Z. (2016). “Impedance-based analysis of grid-synchronization stability for three-phase paralleled converters,” in IEEE Transactions on Power Electronics, Power Electronics, IEEE Transactions on, IEEE Trans. Power Electron, 26–38. doi:10.1109/TPEL.2015.2419712
Xiong, L., Zhuo, F., Wang, F., Liu, X., Chen, Y., Zhu, M., et al. (2016). “Static synchronous generator model: a new perspective to investigate dynamic characteristics and stability issues of grid-tied PWM inverter,” in IEEE Transactions on Power Electronics, Power Electronics, IEEE Transactions on, IEEE Trans. Power Electron, 6264–6280. doi:10.1109/TPEL.2015.2498933
Xu, L., Fan, L., and Miao, Z. (2015). DC impedance-model-based resonance analysis of a VSC–HVDC system. IEEE Trans. Power Deliv. 30 (3), 1221–1230. doi:10.1109/TPWRD.2014.2367123
Zhang, H., Mehrabankhomartash, M., Saeedifard, M., Zou, Y., Meng, Y., Wang, X., et al. (2021). Impedance analysis and stabilization of point-to-point HVDC systems based on a hybrid AC–DC impedance model. IEEE Trans. Ind. Electron. 68 (4), 3224–3238. doi:10.1109/TIE.2020.2978706
Zhang, H., Meng, Y., Wang, X., Wang, X., Mehrabankhomartash, M., and Saeedifard, M. (2022). Stability analysis of a grid-tied interlinking converter system with the hybrid AC/DC admittance model and determinant-based GNC. IEEE Trans. Power Deliv. 37 (2), 798–812. doi:10.1109/TPWRD.2021.3071323
Zhang, H., Wang, X., Mehrabankhomartash, M., Saeedifard, M., Meng, Y., and Wang, X. (2022). Harmonic stability assessment of multiterminal DC (MTDC) systems based on the hybrid AC/DC admittance model and determinant-based GNC. IEEE Trans. Power Electron. 37 (2), 1–65. doi:10.1109/TPEL.2021.3103797
Zhang, X., Fu, S., Chen, W., Zhao, N., Wang, G., and Xu, D. (2020). “A symmetrical control method for grid-connected converters to suppress the frequency coupling under weak grid conditions,” in IEEE Transactions on Power Electronics, Power Electronics, IEEE Transactions on, IEEE Trans. Power Electron, 13488–13499. doi:10.1109/TPEL.2020.2991185
Zhang, X., Wang, X., Wang, X., Ning, L., Feng, C., Zhao, B., et al. (2017). “Selection of the rated frequency for fractional frequency offshore wind power system,” in 2017 IEEE Conference on Energy Internet and Energy System Integration, EI2 2017–Proceedings 2018–January, June 28, 2017, 1-6–6. doi:10.1109/EI2.2017.8245643
Keywords: the back-to-back frequency converter, hybrid industrial/fractional frequency system, impedance-based stability analysis, determinant-based GNC, oscillatory stability
Citation: Cai Z, Han J, Chen J, Gan D, Zhang H and Wang X (2023) Analysis of D-Q small-signal impedance of back-to-back frequency converter. Front. Energy Res. 11:1288847. doi: 10.3389/fenrg.2023.1288847
Received: 05 September 2023; Accepted: 20 October 2023;
Published: 02 November 2023.
Edited by:
Yonghui Liu, Hong Kong Polytechnic University, Hong Kong SAR, ChinaReviewed by:
Yang Qi, Northwestern Polytechnical University, ChinaShenquan Liu, South China University of Technology, China
Bokang Zhou, Florida State University, United States
Copyright © 2023 Cai, Han, Chen, Gan, Zhang and Wang. This is an open-access article distributed under the terms of the Creative Commons Attribution License (CC BY). The use, distribution or reproduction in other forums is permitted, provided the original author(s) and the copyright owner(s) are credited and that the original publication in this journal is cited, in accordance with accepted academic practice. No use, distribution or reproduction is permitted which does not comply with these terms.
*Correspondence: Haitao Zhang, aHR6aGFuZ2VlQHhqdHUuZWR1LmNu
 Zhongqi Cai1
 Jizhi Han
 Haitao Zhang