 Yisong Tan
 Shixun Li
 Limin Ren
95% of researchers rate our articles as excellent or good
Learn more about the work of our research integrity team to safeguard the quality of each article we publish.
Find out more
ORIGINAL RESEARCH article
Front. Energy Res. , 07 December 2023
Sec. Sustainable Energy Systems
Volume 11 - 2023 | https://doi.org/10.3389/fenrg.2023.1286341
Introduction: Overhead transmission line vibration is detrimental to the normal operation of the power grid. It is necessary to remotely monitor overhead transmission lines with sensors in normal operation, and sensors require a constant source of energy. Harvesting energy from transmission line vibrations is an excellent solution to power these sensors.
Methods: A low-frequency and low-amplitude vibration energy harvester is proposed, analyzed, produced and experimented in this study. A main constituent of the energy harvester is an outer support, an inner support, four one-way bearings, a bevel gear system and a DC generator. The harvester converts the linear reciprocating motion of the line into reciprocating swing at first and then converts it into fixed-direction rotation. Theoretical analyses are conducted to determine the harvester performance factors. Finally, the harvester is fabricated and tested.
Results: The test results are in good accordance with the simulation results. At the vibrating speed as 0.48 m/s, the maximum output power and output voltage are 4.2 W and 24.7 V, respectively. The weather sensor and video recorder installed on the transmission line are powered by the harvester.
Discussion: The energy harvester also effectively suppresses the vibration of transmission lines and has great potential in the constructions of smart grids. The harvester provides a feasible solution for harvesting line vibration energy and suppressing line breeze vibration simultaneously.
The monitoring and handling of faults in overhead transmission lines has been a difficult problem in the constructions of smart grids (Kwasi Anane et al., 2021; Shu et al., 2022; Zhao et al., 2022). Because of the long length and remoteness of transmission lines, the prevention of accidents requires considerable manpower and material resources for regular inspections and checks (Liu et al., 2023). Therefore, it is important to monitor the operation status of transmission lines in real time (Yang et al., 2017; Paul and Chang, 2019; Gao et al., 2023).
Wind and electromagnetic effects between overhead transmission lines will cause transmission lines to be in a long-term low frequency and low amplitude vibration state (Tan et al., 2021). The long-term vibration of transmission lines intensifies the line clip wear, which is detrimental to the safe and stable operation of the power grid. Presently, dampers are usually installed to consume part of the energy of vibration (Kakou et al., 2021; Roy and Kundu, 2021). However, it would be very beneficial to extract and convert energy from transmission line vibration into electrical energy for monitoring equipment (Gao et al., 2022a). Additional sensors on overhead transmission lines can transmit the weather information near transmission lines in real time, as well as remotely video monitor the operation of transmission lines (Zhang et al., 2023). Having these data will greatly improve the efficiency of transmission line inspection.
The latest work on transmission line energy harvesting involves self-powered detection devices by harvesting the energy around the transmission line to power the sensors. The purpose of this work is to solve the problem of difficulty in supplying power to the sensors mounted on the transmission line and at the same time to mitigate the vibration of the transmission line. Energy around overhead transmission lines that can be harvested mainly includes electromagnetic, solar, wind and energy generated by transmission line vibration.
First, electromagnetic energy harvesting is the preferred method used in the industry. The electromagnetic energy harvesters mainly use electromagnetic induction to harvest electrical energy from transmission lines (Zangl et al., 2008; Moghe et al., 2009; He et al., 2013; Yuan et al., 2015). Electromagnetic energy harvesters are unable to harvest energy when the grid outages for maintenance, resulting in sensors being unable to monitor the line conditions at this time. Therefore, the method of electromagnetic induction has limitations.
The second common method is to utilize solar energy. Solar panels are widely used, and solar energy harvesting technology is very sophisticated (Matsui et al., 2018; Wang et al., 2022b; Chen et al., 2023; Navarro et al., 2023). There have been attempts related to solar cells in the current powering of transmission line sensors. The overhead transmission lines are prone to ice cover, discharge and other abnormalities in cold temperatures, windstorms and other inclement weather. Therefore, transmission lines need monitoring in inclement weather. However, solar panel usage is very dependent on weather and underperforms in inclement weather (Wang et al., 2022a). Therefore, solar panels may not be a good choice.
Direct wind energy collection is the third method tried in the industry. Direct harvesting of wind energy requires good wind resources (Yang et al., 2021; Pan et al., 2022; Castellano-Aldave et al., 2023; Jung and Schindler, 2023). This method originated with wind scoops on transmission line towers that measured wind speed. Wind energy harvesters generally require start-up wind speeds of 3.5 m/s or more (Fan and Zhu, 2019; Gao et al., 2022b; Swisher et al., 2022). Therefore, wind energy harvesters have difficulty harvesting energy from breezy weather, which accounts for a relatively large portion of actual conditions.
Harvesting vibration energy from overhead transmission lines is the most recent approach proposed in the industry. When the wind speed exceeds 0.5 m/s, transmission lines vibrate and generate large energy due to the Karman vortex formed by the breeze (Kubelwa et al., 2021; Tang et al., 2022; Wu et al., 2022). The transmission line vibration frequency caused by the wind is generally approximately 4 Hz. If the energy of the vibrations in the transmission line is extracted and converted to power the sensors, the wear and tear of the wire clamps will also be reduced. (Foti and Martinelli, 2018). Therefore, energy generated by transmission line vibration is a high-quality energy source for self-powered sensors installed on overhead transmission lines.
In recent years, power grid companies have also begun to try to add ice-cover detection sensors to transmission lines, using solar energy for power supply. As we have analyzed solar energy, solar energy is not able to carry out better power supply under adverse meteorological conditions. In contrast, the method we use has the following three advantages: for the need of low ambient wind speeds, it can work in any bad weather, and it does not put an extra burden on the power grid.
According to these analyses, this paper proposes a low-frequency and low-amplitude vibration energy harvester (LVEH) for overhead transmission lines. The energy harvesting capability of the LVEH was comprehensively studied. Compared to common solar panels and electromagnetic energy harvesters, the LVEH not only has higher output voltage and power but also efficiently converts energy that negatively affects grid operation into useable energy. The framework, generator, operating principle, analysis, fabrication and tests are described in Section 2. Section 3 describes and analyzes the results of the tests in detail. Finally, in Section 4, conclusions are provided.
The main contributions and advantages of our study are as follows:
(1) A low-frequency and low-amplitude energy harvester is proposed for harvesting vibration energy from overhead transmission lines to power sensors. Compared to other energy harvesting devices, LVEH advocates harvesting low frequency energy that is more compatible with the actual operating conditions of overhead transmission lines. The LVEH converts linear reciprocating motion into swing at first and then converts swing into fixed direction rotation. In addition, the generator shell and its spindle speed are equal in magnitude and opposite in direction.
(2) Unlike other energy harvesters that are designed to rotate only the end gears in one way, the LVEH utilizes a special design that allows all gears to rotate in one way. The traditional bidirectional energy harvester only makes the generator spindle rotate in one direction. The frequent direction change of that type of harvester will shorten the gear life span due to rigid shock. The energy stored in gear rotation will be wasted or even burdened for the next direction change. In contrast, the special design of the LVEH enables all gears to rotate in one way and always have two driven gears that can fluctuate the adjustment of two output gears separately. This allows the LVEH to output a stable voltage and a more stable output voltage with a lower vibration frequency. The LVEH achieves a stable voltage output percentage of 76.3% when the vibration frequency is 4 Hz.
(3) A third advantage of LVEH is that it can dampen vibrations in transmission lines without burdening the grid. Compared with the harvesters in (Yuan et al., 2021; Jin et al., 2022), which acquire energy from the grid, the LVEH guarantees the safety and quality of the grid power. At the same time, the LVEH dissipates the kinetic energy of the line and extends the service life of the transmission line accordingly.
The main goal of this work is to develop a low-amplitude and low-frequency energy harvester for overhead transmission lines to harvest the energy from line vibrations. As shown in Figure 1, the LVEH is installed on high-voltage line towers and is connected to the transmission lines by a vibrating rod. The energy harvested from the LVEH is capable of powering the sensors that are relevant for monitoring the operation status of the transmission line, such as weather sensors and fault video recorders.
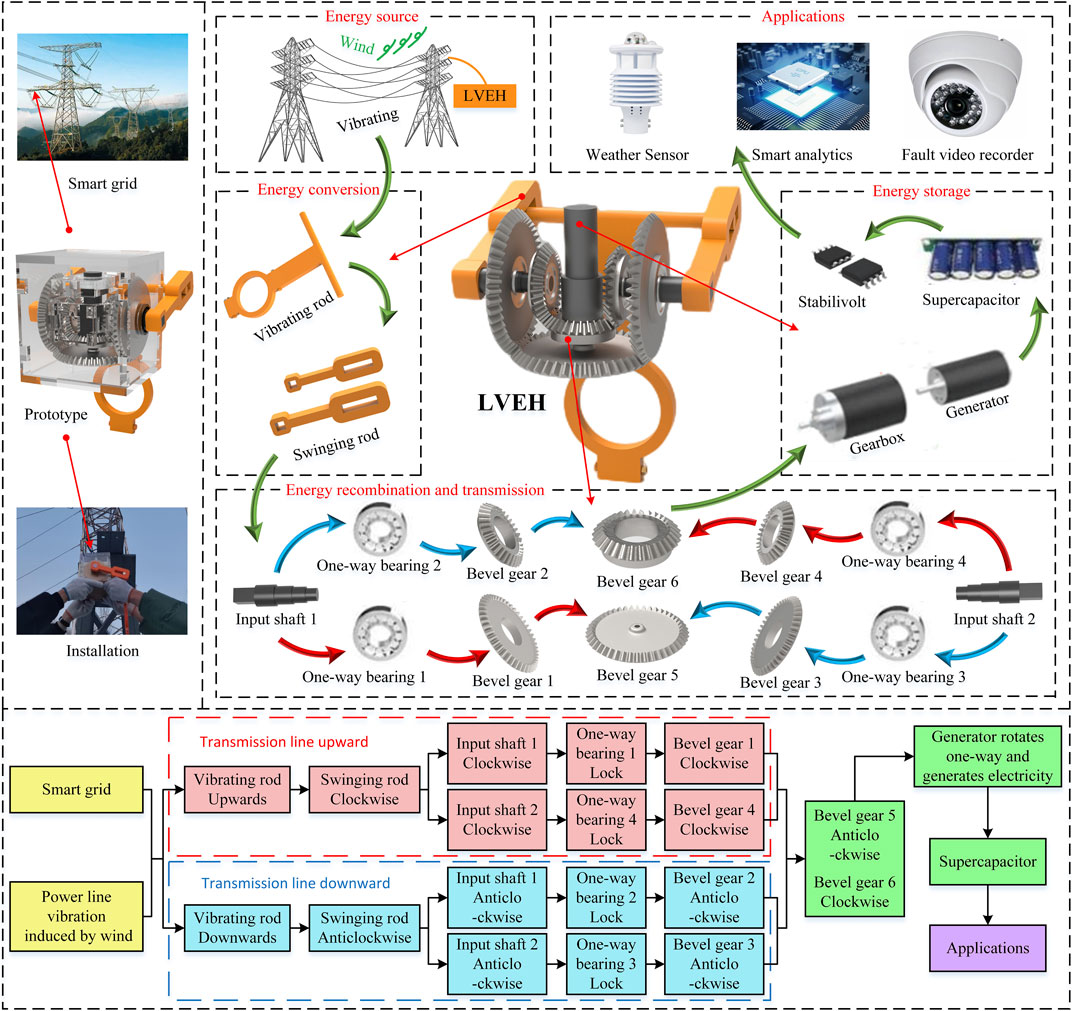
FIGURE 1. Framework for the low frequency and low amplitude vibration energy harvester (LVEH).
There are five steps to completing energy harvesting. The first step is the energy source: the transmission line is subjected to low-frequency, low-amplitude vibration for a long period of time under the excitation of the breeze. The LVEH is deployed on a power tower. The vibration of the transmission is changed to a reciprocating swing by the LVEH. The third step is energy recombination and transmission. The reciprocating swing is converted in unidirectional rotation by the special designed mechanism in the LVEH. The fourth step is energy storage. The power from the generator is stored in a supercapacitor. The final step is the application. The captured energy is used to power the sensors deployed on the transmission lines.
The LVEH converts transmission line vibration into reciprocating swing with the use of a vibrating rod in cooperation with a swing rod. The reciprocating swing is converted into one-way rotation by the cooperation of four one-way bearings, two solid shafts and six bevel gears. The composition in these structures effectively solves the reciprocating motion of the transmission line. After motion conversion, the low frequency of line vibration is overcome using the gearbox to increase the speed of the generator of the energy harvester. Finally, a voltage regulator circuit and a supercapacitor are deployed to stage and storage output energy.
The generator is the core component of the LVEH. As shown in Figure 2, the LVEH uses a DC brush generator (Maxon 118753, Sachseln, Switzerland) with the advantages of small size, light weight and high efficiency. Because transmission lines vibrate with a low frequency and a low amplitude, it is necessary to increase the generator rotation speed. Therefore, a gearbox (Maxon 166169, Sachseln, Switzerland) was added in front of the DC generator to increase the rotation speed of the generator. The gearbox and the generator parameters are shown in Table 1.
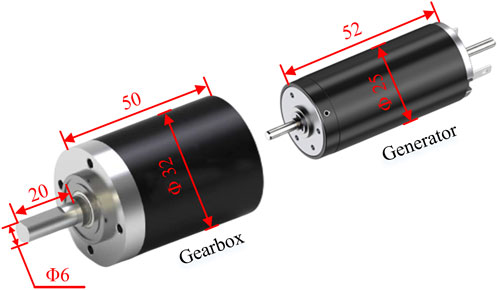
FIGURE 2. DC generator and gearbox.
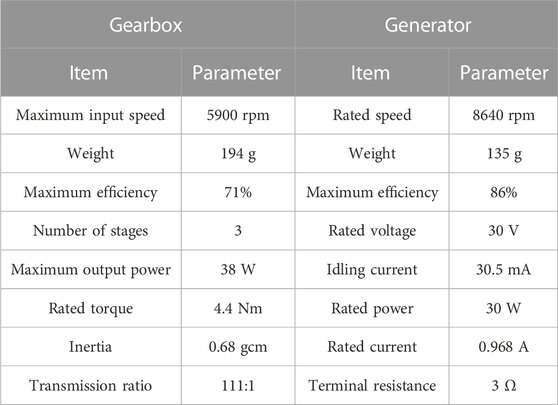
TABLE 1. Key parameters of the gearbox and the generator.
The critical component of the LVEH is a special design that converts energy from transmission line vibration into electrical energy. The operating principle of the LVEH and names of each component are shown in Figure 3.
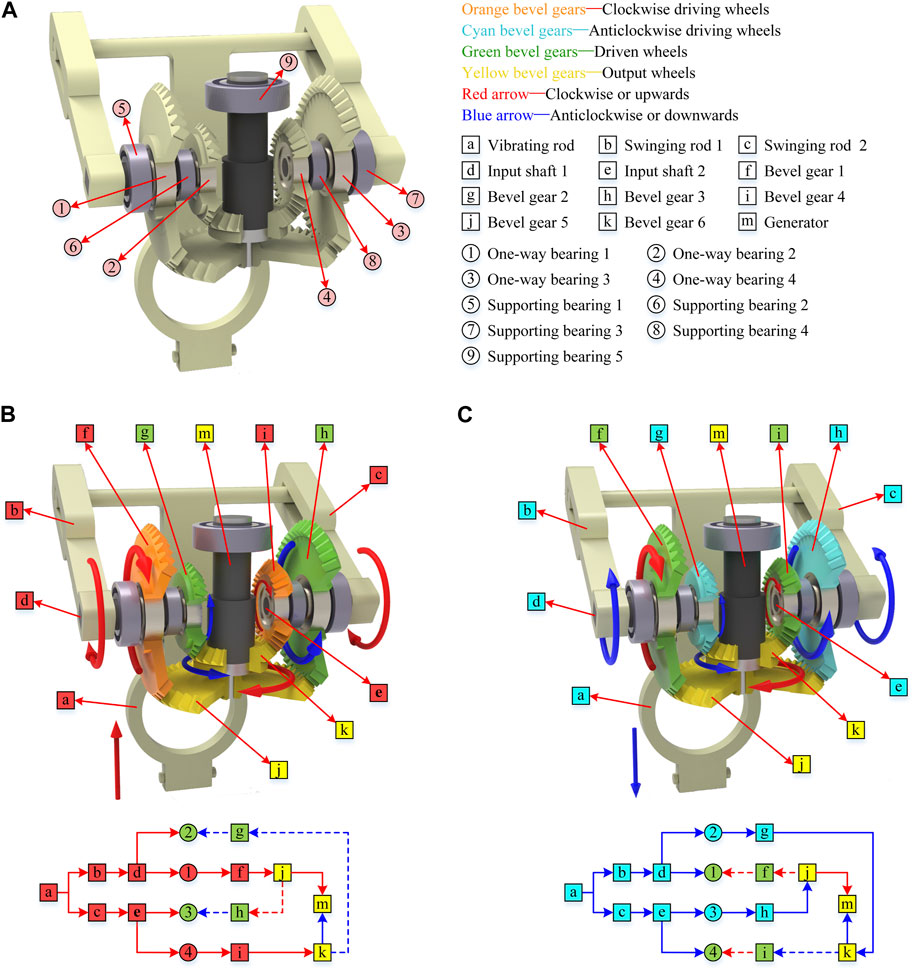
FIGURE 3. Operating principles of the LVEH. (A) Location of the bearings and names of the individual components of the LVEH. (B) Upward transmission process in the direction of vibration. (C) Downward transmission process in the direction of vibration.
Figure 3A shows the function and position of each bearing in the LVEH, of which 1–4 are one-way bearings and 5-9 are support bearings. When overhead transmission lines start to vibrate, their vibration direction can be divided into upward and downward motion. Figure 3B depicts the motion transmitting procedure of the LVEH when transmission lines vibrate in the upward direction. The vibrating rod follows the transmission line upward and pushes one end of the swing rods to make two swing rods drive input shaft 1 and input shaft 2 into clockwise rotation. As shown in Table 2, at this time, one-way bearing 1 and 4 are in a locked state, and one-way bearing 2 and 3 are in a free state. Input shaft 1 drives bevel gear 1 clockwise through one-way bearing 1, enabling clockwise rotation of bevel gear 5, which is tightly connected to the generator spindle. Meanwhile, input shaft 2 drives bevel gear 4 clockwise through one-way bearing 4, enabling counterclockwise rotation of bevel gear 6, which is tightly connected to the generator shell. The generator spindle and its shell rotate in opposite directions with equal speed.

TABLE 2. One-way bearing working state.
Figure 3C depicts the transmitting procedure of the LVEH when transmission lines vibrate in the downward direction. Vibrating the rod downward with the transmission line enables two swinging rods to drive input shaft 1 and input shaft 2 to rotate counterclockwise. As shown in Table 2, at this time, one-way bearing 2 and 3 are in a locked state, and one-way bearing 1 and 4 are in a free state. Input shaft 1 drives bevel gear 2 counterclockwise through one-way bearing 2, enabling counterclockwise rotation of bevel gear 6, which is tightly connected to the generator shell. Meanwhile, input shaft 2 drives bevel gear 3 counterclockwise through one-way bearing 3, enabling still counterclockwise rotation of bevel gear 5, which is tightly connected to the generator spindle.
In summary, as shown in Figure 3, all the bevel gears and the generator of the LVEH will rotate in the designed fixed direction. Regardless of the upward or downward vibration direction from the transmission line, the shell and the spindle of the generator are equivalent in rotational speed and opposite in direction.
The analytical model of the LVEH is shown in Figure 4. Figures 4A, B depict the input of the LVEH when the direction of vibration is upward and downward, respectively. The instantaneous velocity v of transmission line vibration can be orthogonally decomposed into vn and vt. vn is the linear velocity of the swing rod, which can be expressed as
where θ is the angle between the vibration rod and swing rod.
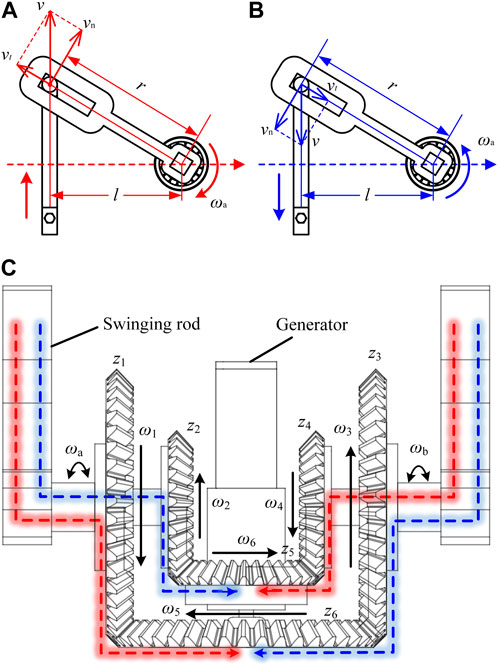
FIGURE 4. Mechanical analysis of the LVEH. (A) Line upward. (B) Line downward. (C) Energy transfer path.
The rotational speeds of two input shafts can be further obtained as
where ωa is the rotational speed of input shaft 1, ωb is the rotational speed of input shaft 2, r is the swing radius of the swing rod, and l is the distance from the swing rod to the input shaft.
The input shaft drives the bevel gear train via one-way bearings. Figure 4C describes the energy transfer path of the LVEH. Bevel gear 5 is driven by bevel gear 1 when the line vibrates upward. It is driven by bevel gear 3 as the line vibrates downward. The rotation speed ω5 of bevel gear 5 can be expressed by the following equation:
where i51 is the gear ratio from bevel gear 5 to bevel gear 1, i53 is the gear ratio from bevel gear 5 to bevel gear 3, and zi is the number of teeth in gear i.
Bevel gear 6 is driven by bevel gear 4 when the line vibrates upward. It is driven by bevel gear 2 as the line vibrates downward. The rotation speed ω6 of bevel gear 6 can be expressed by the following equation:
where i64 is the gear ratio from bevel gear 6 to bevel gear 4, and i62 is the gear ratio from bevel gear 6 to bevel gear 2.
Gear 5 is connected to the generator spindle, and gear 6 is connected to the generator shell. Gear 5 and gear 6 rotate in opposite directions. Therefore, the rotational speed ωg of the generator spindle relative to the generator shell is
From Eq. 5, it can be seen that the rotation speed of the generator is mainly related to l, θ, v and the number of teeth of each bevel gear. and ωg is positively related to v but negatively related to l.
The open-circuit voltage V0 of the generator can be shown as
where K is the generator voltage constant.
The total power Pg of the generator can be shown as
where Rload is the load resistance, Rg is the resistance of the generator.
The output energy of the generator, Eg is
The input power PI supplied to the LVEH by the transmission line can be expressed as
where F is the input force.
The energy extracted by LVEH from transmission line vibrations can be expressed as
where EI is the input energy.
Mechanical efficiency is defined as the ratio of the output power to the input power when the machinery is operating in a steady state. Therefore, the mechanical efficiency of LVEH can be expressed by Eqs. 8, 10 as
The analysis of the LVEH provides two valuable insights. At first, according to Eq. 6, it can be concluded that the open-circuit voltage of LVEH is determined by the vibration speed of the transmission line. The second is that the mechanical efficiency of the LVEH increases with increasing vibration speed based on Eq. 11. These two insights are verified at the test part.
To better verify the capability of the LVEH in energy harvesting, a full-scale prototype of the LVEH was fabricated. Figure 5 shows the physical prototype of the LVEH. Figure 5A shows the main measurements of LVEH are 200 mm × 140 mm × 160 mm (length × width × height). The external support of the LVEH is made of an acrylic sheet, the main material of the internal support is polylactic acid, and all the bevel gears are made of nylon. Figure 5B shows the internal situation of the LVEH.

FIGURE 5. Physical prototype of the LVEH. (A) LVEH prototype. (B) Internal view of the LVEH.
Figure 6 shows the field installation and test of the LVEH. Figure 6A shows the LVEH prototype. Figure 6B shows that the field test of the LVEH was performed at the Northeast Electric Power University Transmission and Transformation Experimental Center located in 126°30′45″E, 43°49′51″N. Figure 6C shows the northeast electric power university experimental center of transmission and transformation. The LVEH is installed on the high-voltage line tower, as shown in Figures 6D, E. The LVEH supplies power to the sensor, and the sensors transmit the collected data to the main control room, as shown in Figure 6F. This enables real-time telemetry of the operating status of overhead transmission lines.
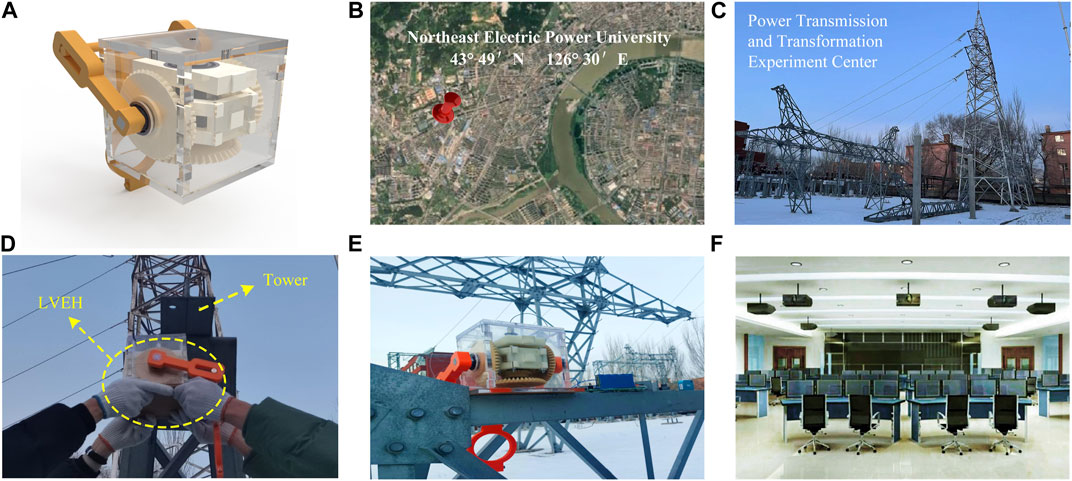
FIGURE 6. LVEH field installation and testing. (A) LVEH prototype. (B) Location of Northeast Electric Power University Transmission and Transformation Experimental Center. (C) Experimental Center. (D) LVEH installation in progress. (E) Installation completed. (F) Master Control room.
According to the experimental needs, an experimental system for obtaining relevant performance data of the LVEH was developed and assembled. Figure 7 shows the bench test system of the LVEH. The experimental system is mainly composed of a crank slider mechanism. A mechanical structure sketch is shown in Figure 7A. The relationship between the slider displacement s and the crank rotation angle α can be obtained as
where the crank length is x, and the connecting rod length is y.
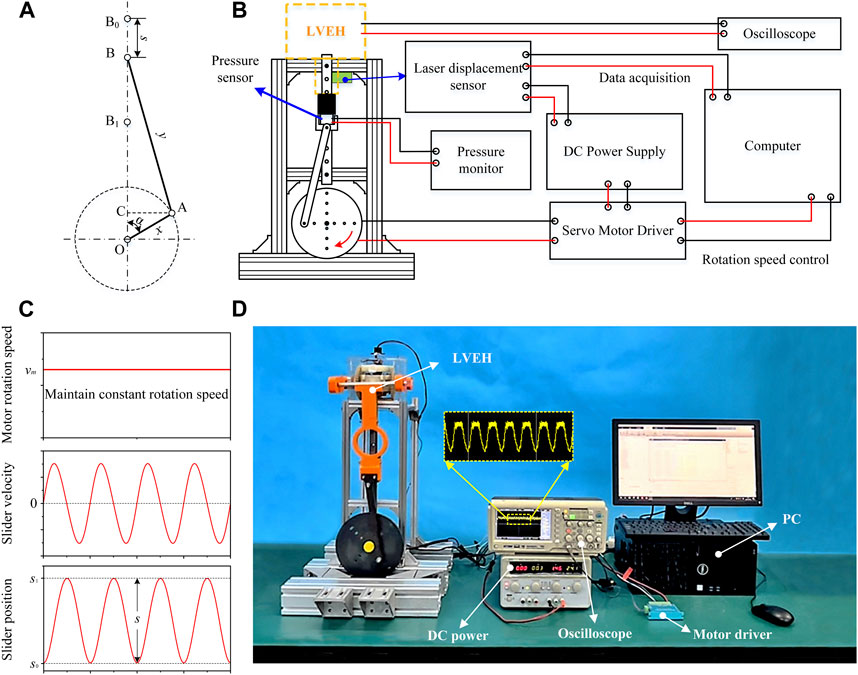
FIGURE 7. Bench test system for the LVEH. (A) Crank slider mechanism schematic, (B) Wiring diagram of the test platform. (C) Bench test system motion characteristics. (D) Photograph of the test platform.
The relationship between the instantaneous velocity vs of the slider and the crankshaft speed ωm can be expressed as
Figure 7B shows the wiring diagram of the test platform. The voltage waveforms of the LVEH are collected by an oscilloscope (ADS1302CEL, Guangdong, China). The displacement of the slider is measured in real time by a laser rangefinder (GJD-01, Shenzhen, China). The vibration rod of the LVEH is connected to the slider of the bench test system by a pressure sensor (AR-DN101, Changzhou, China). A DC servo motor driver (RMDS-106, Shenzhen, China) is used to drive the motor (Z5D90-24GU-M, Dongguan, China). A computer is used to control the motor rotation speed and to receive and record the real-time data from sensors. The computer and the motor driver communicate via the RS232 bus. The control program for the servo motor in the computer is created in MATLAB 2019. The data received by the sensors are shown in Figure 7C, which verifies the correctness of Eqs. 12, 13. Figure 7D shows a physical photo of the test platform.
Figure 8 shows the voltage stabilized circuit and energy storage. Figure 8A shows the circuit diagram. The LVEH stores harvested energy in the supercapacitor directly. To prevent the generator from failing due to current backflow, we add a diode between the LVEH and supercapacitor. The energy stored in the supercapacitor stabilizes the voltage through the LM2596 module before supplying energy to the sensor. The LM2596 module supports adjustable output. The 40 V input can be adjusted to a stable output of 0–37 V, thus enabling the supply of energy to different types of sensors. Figure 8B shows a physical picture of the energy storage and voltage regulator circuit.
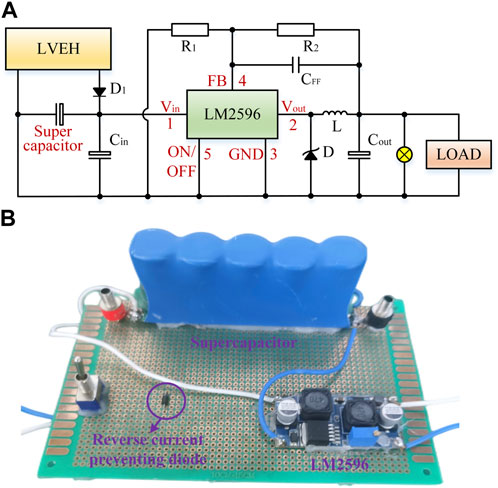
FIGURE 8. The circuit diagram of energy storage and voltage stabilized. (A) Circuit diagram. (B) Physical picture.
Figure 9 shows the power generation performance tests of the LVEH. The relationship between time and the open-circuit for different vibration frequencies is shown in Figure 9A. The vibration amplitude during the test was set to 6 cm, and the vibration frequencies were set to 1 Hz, 2 Hz, 3 Hz and 4 Hz.

FIGURE 9. The power generalion performance tests of the LVEH. (A) Plot of open-circuit vollage versus time at different vibration frequencies. (B) Percentage of stable voltage at different vibration frequencies. (C) Load voltage versus resistance. (D) Load current versus resistance. (E) Load power versus resistance. (F) Output power of the LVEH under different vibration speeds. (G) Angle between the vibrating rod and swing rod of the LVEH in relation to the open-circuit voltage.
As shown in Figure 9A, the open-circuit voltage of the LVEH increases gradually with increasing vibration frequency. The average voltage of the LVEH is 4.7 V when the vibration frequency is 1 Hz. As the vibration frequency increases to 4 Hz, the average voltage of the LVEH reaches 24.7 V, which is 5.26 times more than that at 1 Hz.
The vibration velocity v can be expressed by the vibration frequency f as
where s is the amplitude.
The relationship between the vibration frequency and the open-circuit voltage can be obtained from Eqs. 5, 6, 14 as
From Eq. 15, it can be seen that the open-circuit voltage increases with increasing vibration frequency. This is consistent with the measurement results in Figure 9A.
Figure 9A also shows that as the vibration frequency increases, the voltage waveform tends to stabilize. The open-circuit voltage fluctuation amplitude of the LVEH is 9.2 V when the vibration frequency is 1 Hz. As the vibration frequency increases to 4 Hz, the open-circuit voltage fluctuation amplitude of the LVEH decreases to 2.8 V, which is 69.57% less than the voltage fluctuation amplitude at 1 Hz.
The reason for this phenomenon is that the LVEH has a special design of all gears rotating in one way. This design enables all the gears of the LVEH to keep rotating with their stored kinetic energy at the instant when the transmission line vibration direction changes, thus driving the generator for uninterrupted one-way rotation. The energy stored in the bevel gear can be expressed as
where Ei is the energy stored in bevel gear i, Ji is the rotational inertia of bevel gear i, and ωi is the angular velocity of bevel gear i.
On the one hand, it can be obtained from Eq. 16 that the energy stored in the gears will increase as the frequency of vibration increases. This enables the bevel gear system to have enough energy to maintain the rotation of the generator during transmission line vibration changes. On the other hand, as the vibration frequency increases, the time required for the vibration to change direction decreases. This means that less energy needs to be stored in the gears to keep the generator rotating. It can be concluded that the voltage tends to stabilize as the vibration frequency increases.
To provide a better description of the correlation between the vibration frequency and open-circuit voltage stability, the percentage of stabilized voltage at the four vibration frequencies is further shown in Figure 9B. The percentage of stabilized voltage is 17.2% at 1 Hz. When the vibration frequency is 4 Hz, the percentage of stable voltage reaches 76.3%. Compared to 1 Hz, the percentage of stable voltage increases by 4.43 times at a vibration frequency of 4 Hz.
The stable output voltage of the LVEH relieves the processing pressure of the back-end circuit and has a positive effect. This is consistent with the design philosophy of the LVEH.
Figures 9C–E shows the load characteristics of the LVEH. Figure 9C shows the relationship between the load voltage and the load resistance at four vibration frequencies. From Figure 9C, it can be seen that the load voltage increases with increasing load resistance. For the vibration frequency of 4 Hz, the resistance increases from 0 Ω to 300 Ω, making the load voltage increase from 0 V to 24.75 V.
The relationship between the load voltage Vload and the load resistance Rload can be expressed as
where Rg is the internal resistance of the generator.
Eq. 17 shows that the load voltage increases with the load resistance This is consistent with the results in Figure 9C.
Figure 9D shows the relationship between the load current and the load resistance at four vibration frequencies. From Figure 9D, it can be seen that as the load resistance rises, the load current reduces. For a vibration frequency of 4 Hz, increasing the resistance from 3 Ω to 300 Ω reduces the load current from 4.17 A to 0.08 A.
The relationship between the load current Iload and the load resistance Rload can be expressed as
Eq. 18 shows that as the load resistance rises, the current reduces. This is consistent with the results in Figure 9D.
Figure 9E shows the relationship between the load power and load resistance at four vibration frequencies. Figure 9E shows that for a vibration frequency of 4 Hz, increasing the resistance from 0 Ω to 3 Ω increases the load power from 0 W to 52.08 W. Continuing to increase the resistance from 3 Ω to 300 Ω reduces the load power from 52.08 W to 2.04 W. That is, the load power rises first and then reduces with increasing load resistance. The maximum value of load power occurs when the load resistance is equal to the internal resistance of the generator.
The relationship between the load power Pload and the load resistance Rload can be expressed as
The rate of change of the load power can be expressed as
From Eq. 19, it can be obtained that as the load resistance increases, the load power increases first and then decreases. From Eq. 20, it can be obtained that the load power is maximum when the load resistance is equal to the generator internal resistance. The maximum value of the load power Pmax can be expressed as
These results are consistent with the results in Figure 9E.
In summary, the load characteristics show that the LVEH has good electrical performance and has the ability to power the sensors.
Figure 9F shows the power curve of the LVEH. The actual power curve of the LVEH is obtained by measuring its output power at different vibration speeds. Figure 9F shows that as the vibration frequency increases from 0 m/s to 2.7 m/s, the output power increases from 0 W to 30.6 W. The LVEH reaches a maximum output power of 30.6 W when the vibration frequency exceeds 2.18 m/s. The design power curve of the LVEH can be obtained from Eq. 5 and the generator power curve provided by the generator manufacturer. As shown in Figure 9F, the actual power fits well with the design power, and the actual power is slightly lower than the design power. The reason for this phenomenon is that the LVEH loses part of the power in the process of converting energy due to friction and so on.
In general, the power curve provides a very visual representation of the relationship between the output and the input of the LVEH. The power curve gives the required vibration speed to achieve a predetermined power.
From Eq. 5, it can be seen that the rotation speed of the generator is mainly related to l, θ, v and the number of teeth of each bevel gear. Through the orthogonal experimental design method, we take 10 values for each of the 9 parameters l, θ, v and the number of teeth of each bevel gear, and conduct a total of 90 experiments to show that θ has the greatest influence on the voltage transformation. Therefore, the angles θ need to be tested individually.
Figure 9G shows the angle between the vibrating and swinging rods of the LVEH in relation to the open-circuit voltage. As shown in Figure 9G, 1220 data points were collected when the angle was between 60° and 120°, and these data were fitted to obtain the experimental curve. The experimental curve in Figure 9G shows that increasing the angle from 60° to 90° makes the voltage increase from 22.1 V to 25.6 V. As the angle continues to increase from 90° to 120°, the voltage decreases from 25.6 V to 22.1 V. That is, at 90°, the voltage takes the maximum value of 25.6 V, which is a 15.8% increase in voltage compared to 60° and 120°.
An analysis of variance (ANOVA) was performed on the data collected from each angle to derive a picture of the collected data. Eq. 22 is the formula for the variance. The maximum value of the variance is 0.39 less than 1 by calculating the data from each installation angle individually. Therefore, these data obtained through testing have good stability.
where S2 is the variance, n is the number of samples, xi is a sample numbered i, and
The relationship between the angle and the voltage can be expressed as
The theoretical curve can be obtained based on Eq. 23. The experimental curve fits well with the theoretical curve.
In summary, the LVEH is installed with an angle near 90° to obtain the maximum output voltage. This provides a guide for the actual installation of the LVEH.
The power and efficiency of the LVEH versus the transmission line vibration speed are shown in Figure 10. In Figure 10, the output power is obtained from the power sensor (UD18, Shenzhen, China), and the input power is measured based on Eq. 9. With the transmission line vibration speed increases, the output and input power both increase. When the vibration speed increased from 0.3 m/s to 1.5 m/s, the input power increased from 3.39 W to 42.01 W, a 12.39-fold increase. The output power increased from 1.85 W to 26.7 W, a 14.43-fold increase. The LVEH efficiency also increases from 54.57% to 63.56%.
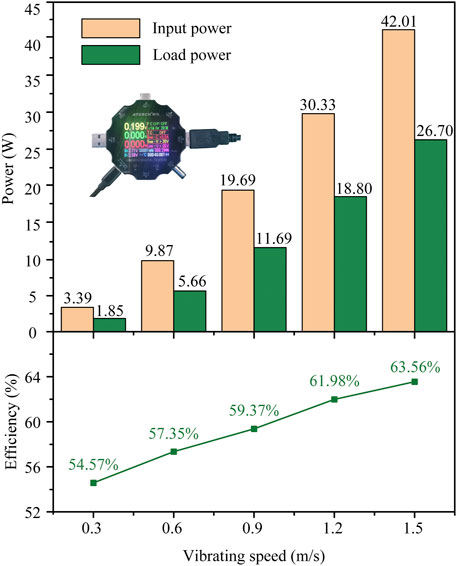
FIGURE 10. Power and efficiency versus transmission line vibrating speed.
The load power of the LVEH is
Differentiating Eq. 24 provides the rate of change of load power versus vibration speed as
Differentiating Eq. 9 provides the rate of change of input power versus vibration speed as
From Eqs 25, 26, it can be concluded that the input power increases much slower than the load power as the vibration speed increases. Therefore, the efficiency of the LVEH increases with increasing vibration speed.
In short, the LVEH has a high efficiency that enables it to harvest low frequency and low amplitude energy, which is consistent with our design philosophy.
Figure 11 shows the force and power provided by the LVEH to suppress vibration at different vibration speeds. The force applied to the transmission line by the LVEH provides negative power to the vibration of the line. As the vibration speed increases, the LVEH provides more resistance to line vibration and absorbs more power. As the transmission line vibrating speed increases from 0 m/s to 1.5 m/s, the force of the LVEH to suppress transmission line vibration increases from 0 N to 28 N. The power to absorb transmission line vibration increases from 0 W to 42.01 W.
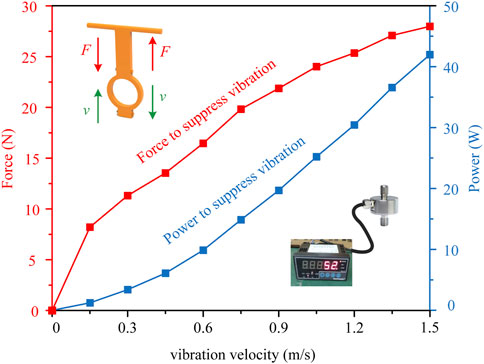
FIGURE 11. The force and power provided by the LVEH to suppress vibration at different vibration speeds.
The kinetic energy Ek1 of the transmission line vibration before the installation of the LVEH can be expressed as
where m is the weight of the transmission line, and v1 is the vibration speed of the line before the LVEH is installed.
After the installation of the LVEH, the kinetic energy Ek2 of the transmission line vibration can be expressed as
where v2 is the vibration speed of the line after the LVEH is installed.
It can be obtained that v2 is smaller than v1 by Eqs 27, 28. Therefore, the LVEH can reduce the vibration of transmission lines.
In summary, the LVEH always provides a force to the transmission line in the opposite direction of its vibration, and this force provides negative power and serves as a suppression. Therefore, the LVEH can relieve the vibration of the transmission line and achieve the purpose of extending the service life of the line.
The various applications of the LVEH are verified in Figure 12. As shown in Figure 12A, the energy harvested by the LVEH is stored in a supercapacitor and used in power monitoring devices and weather sensors. Figure 12B shows photographs of the experimental site taken by the monitoring equipment during daytime and nighttime. This shows that the LVEH is able to harvest energy to power monitoring devices, and these devices are able to monitor the states of operation of the transmission lines for all days.
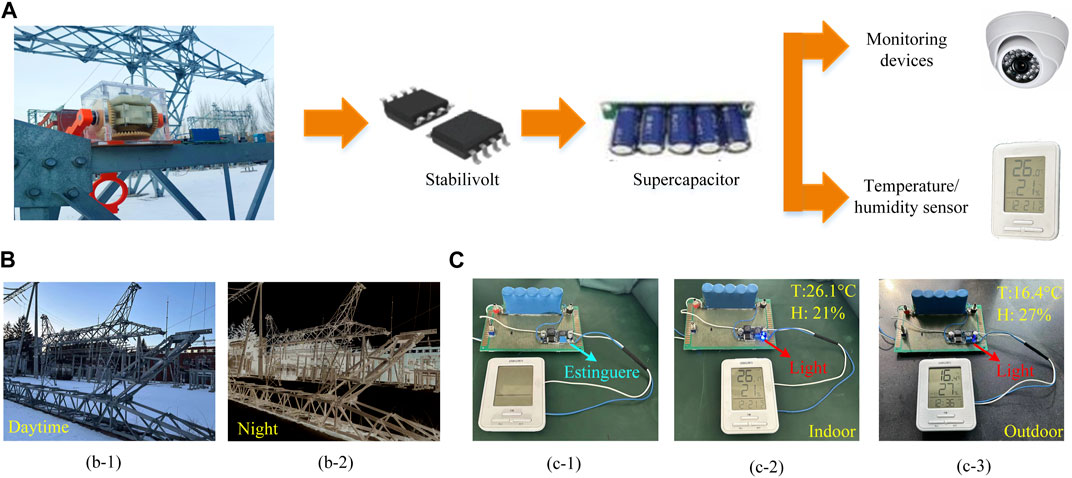
FIGURE 12. Applications of the LVEH. (A) LVEH harvests energy from transmission line vibration for use in humidity and temperature sensors and monitoring devices. (B) The image captured by the monitoring device, (b-1) Photo taken by the monitoring device in daytime, (b-2) Photo taken by the monitoring device at night. (C) LVEH powering the humidity and temperature sensor. (c-1) Unpowered status, (c-2) indoor status, (c-3) outdoor status.
Figure 12C shows the LVEH powering a weather sensor both indoors and outdoors. It can be observed that the sensor detects a change in temperature and humidity from indoor to outdoor. It also shows that the LVEH can power weather sensors, and then the sensors can detect the states of the environments near the transmission lines.
In Table 3, the energy harvesting performance of the LVEH is compared with several similar energy harvesters. The power, voltage, current, energy conversion efficiency and energy harvesting components are compared. As Table 3 shows, the LVEH has a power of 4.2 W, a voltage of 24.7 V, and an energy conversion efficiency of 56.24%, all of which are higher than the other harvesters. Therefore, our LVEH has advantages in power, voltage and energy conversion efficiency.

TABLE 3. Comparison of the LVEH with the energy harvesters in similar works.
An overhead transmission line vibration energy harvester (LVEH) is proposed. The optimal mounting position of the LVEH’s vibrating rod is at an angle of 90° to the swing rod. The maximum output power and voltage are 4.2 W and 24.7 V when the vibrating speed is 0.48 m/s. The LVEH can effectively supply continuous power to weather sensors, video recorders and other equipment. Compared to traditional energy harvesting devices installed on transmission lines, the LVEH collects energy with high power regardless of the direction of transmission line vibration up or down, and at the same time, the LVEH does not consume power from the grid and can also mitigate transmission line vibration. All these advantages make the LVEH show great potential in the construction of smart grids.
In the testing of LVEH, the safety in high voltage environments is the first problem we need to consider. The second problem is the electromagnetic compatibility of the LVEH, which is in a strong magnetic field generated by the high voltage. Our future work will focus on these two aspects in order to promote the practical applications of LEVH in smart grids.
The raw data supporting the conclusion of this article will be made available by the authors, without undue reservation.
YT: Conceptualization, Writing–review and editing. SL: Investigation, Methodology, Writing–original draft, Software, Supervision. WZ: Investigation, Writing–original draft. SW: Investigation, Writing–original draft. YZ: Visualization, Writing–original draft. YH: Visualization, Writing–original draft. LR: Supervision, Writing–review and editing.
The author(s) declare financial support was received for the research, authorship, and/or publication of this article. The authors gratefully acknowledge the support of the National Natural Science Foundation of China (No. 52205302), Natural Science Foundation of Jilin Province (20220101242JC, 20230101321JC) and the Science and Technology Program of the Education Department of Jilin Province (JJKH20230108KJ, JJKH20230109KJ). The asterisk indicates the author to whom all correspondence should be directed.
The authors declare that the research was conducted in the absence of any commercial or financial relationships that could be construed as a potential conflict of interest.
All claims expressed in this article are solely those of the authors and do not necessarily represent those of their affiliated organizations, or those of the publisher, the editors and the reviewers. Any product that may be evaluated in this article, or claim that may be made by its manufacturer, is not guaranteed or endorsed by the publisher.
Castellano-Aldave, C., Carlosena, A., Iriarte, X., and Plaza, A. (2023). Ultra-low frequency multidirectional harvester for wind turbines. Appl. Energy 334, 120715. doi:10.1016/j.apenergy.2023.120715
Chen, Z., Yiliang, X., Hongxia, Z., Yujie, G., and Xiongwen, Z. (2023). Optimal design and performance assessment for a solar powered electricity, heating and hydrogen integrated energy system. Energy 262, 125453. doi:10.1016/j.energy.2022.125453
Fan, Z., and Zhu, C. (2019). The optimization and the application for the wind turbine power-wind speed curve. Renew. Energy 140, 52–61. doi:10.1016/j.renene.2019.03.051
Foti, F., and Martinelli, L. (2018). A unified analytical model for the self-damping of stranded cables under aeolian vibrations. J. Wind Eng. Ind. Aerodyn. 176, 225–238. doi:10.1016/j.jweia.2018.03.028
Gao, S., Zeng, X., Tao, B., Ke, T., Feng, S., Chen, Y., et al. (2023). Self-powered sensing of power transmission lines galloping based on piezoelectric energy harvesting. Int. J. Electr. Power Energy Syst. 144, 108607. doi:10.1016/j.ijepes.2022.108607
Gao, S., Zeng, X., Zhang, G., Zhang, J., Chen, Y., Feng, S., et al. (2022a). Triboelectric–electromagnetic hybridized module for energy harvesting of power transmission lines galloping and self-powered galloping state monitoring. Nano Energy 101, 107530. doi:10.1016/j.nanoen.2022.107530
Gao, Y., Ma, S., Wang, T., Miao, C., and Yang, F. (2022b). Distributed onshore wind farm siting using intelligent optimization algorithm based on spatial and temporal variability of wind energy. Energy 258, 124816. doi:10.1016/j.energy.2022.124816
He, W., Li, P., Wen, Y., Zhang, J., Yang, A., Lu, C., et al. (2013). Piezoelectric energy harvester scavenging AC magnetic field energy from electric power lines. Sensors Actuators, A Phys. 193, 59–68. doi:10.1016/j.sna.2012.12.042
Jin, X., Yuan, Z., Shi, Y., Sun, Y., Li, R., Chen, J., et al. (2022). Triboelectric nanogenerator based on a rotational magnetic ball for harvesting transmission line magnetic energy. Adv. Funct. Mat. 32, 2108827. doi:10.1002/adfm.202108827
Jung, C., and Schindler, D. (2023). Efficiency and effectiveness of global onshore wind energy utilization. Energy Convers. Manag. 280, 116788. doi:10.1016/j.enconman.2023.116788
Kakou, P., Bukhari, M., Wang, J., and Barry, O. (2021). On the vibration suppression of power lines using mobile damping robots. Eng. Struct. 239, 112312. doi:10.1016/j.engstruct.2021.112312
Kubelwa, Y. D., Swanson, A. G., Papailiou, K. O., and Dorrell, D. G. (2021). On the Euler-Lagrange formalism to compute power line bundle conductors subject to aeolian vibrations. Mech. Syst. Signal Process. 163, 108099. doi:10.1016/j.ymssp.2021.108099
Kwasi Anane, P. O., Huang, Q., Bamisile, O., and Ayimbire, P. N. (2021). Fault location in overhead transmission line: a novel non-contact measurement approach for traveling wave-based scheme. Int. J. Electr. Power Energy Syst. 133, 107233. doi:10.1016/j.ijepes.2021.107233
Liu, Z., Gao, H., and Luo, S. (2023). Non-unit protection for long-distance LCC-HVDC transmission lines based on waveform characteristics of voltage travelling waves. Int. J. Electr. Power Energy Syst. 150, 109079. doi:10.1016/j.ijepes.2023.109079
Matsui, T., Sai, H., Bidiville, A., Hsu, H. J., and Matsubara, K. (2018). Progress and limitations of thin-film silicon solar cells. Sol. Energy 170, 486–498. doi:10.1016/j.solener.2018.05.077
Moghe, R., Yang, Y., Lambert, F., and Divan, D. (2009). “A scoping study of electric and magnetic field energy harvesting for wireless sensor networks in power system applications,” in Proceedings of the 2009 IEEE Energy Conversion Congress and Exposition, San Jose, CA, USA, September 2009 (IEEE), 3550–3557. doi:10.1109/ECCE.2009.5316052
Navarro, M. A., Oliva, D., Ramos-Michel, A., and Haro, E. H. (2023). An analysis on the performance of metaheuristic algorithms for the estimation of parameters in solar cell models. Energy Convers. Manag. 276, 116523. doi:10.1016/j.enconman.2022.116523
Pan, H., Jia, C., Li, H., Zhou, X., Fang, Z., Wu, X., et al. (2022). A renewable energy harvesting wind barrier based on coaxial contrarotation for self-powered applications on railways. Energy 258, 124842. doi:10.1016/j.energy.2022.124842
Paul, S., and Chang, J. (2019). Design of novel electromagnetic energy harvester to power a deicing robot and monitoring sensors for transmission lines. Energy Convers. Manag. 197, 111868. doi:10.1016/j.enconman.2019.111868
Roy, S., and Kundu, C. K. (2021). State of the art review of wind induced vibration and its control on transmission towers. Structures 29, 254–264. doi:10.1016/j.istruc.2020.11.015
Shu, S., Gai, X., Qiu, H., Tao, Y., and Huang, Y. (2022). An energy harvesting reactor for high voltage overhead insulated shield wires considering randomness of meteorological conditions. Energy 253, 124116. doi:10.1016/j.energy.2022.124116
Swisher, P., Murcia Leon, J. P., Gea-Bermúdez, J., Koivisto, M., Madsen, H. A., and Münster, M. (2022). Competitiveness of a low specific power, low cut-out wind speed wind turbine in North and Central Europe towards 2050. Appl. Energy 306, 118043. doi:10.1016/j.apenergy.2021.118043
Tan, Y., Lu, G., Cong, M., Wang, X., and Ren, L. (2021). Scavenging energy from wind-induced power transmission line vibration using an omnidirectional harvester in smart grids. Energy Convers. Manag. 238, 114173. doi:10.1016/j.enconman.2021.114173
Tang, X., Hou, W., Zheng, Q., Fang, L., Zhu, R., and Zheng, L. (2022). Self-powered wind sensor based on triboelectric nanogenerator for detecting breeze vibration on electric transmission lines. Nano Energy 99, 107412. doi:10.1016/j.nanoen.2022.107412
Wang, N., Ni, L. L., Wang, A., Shan, H. S., Jia, H. Z., and Zuo, L. (2022a). High-efficiency photovoltaic-thermoelectric hybrid energy harvesting system based on functionally multiplexed intelligent thermal management. Energy Convers. Manag. 272, 116377. doi:10.1016/j.enconman.2022.116377
Wang, Z., Liu, Z., Zhang, C., Yang, D., Cheng, P., and Shuai, Y. (2022b). Notched nanoring wideband absorber for total solar energy harvesting. Sol. Energy 243, 153–162. doi:10.1016/j.solener.2022.07.026
Wu, H., Wang, J., Wu, Z., Kang, S., Wei, X., Wang, H., et al. (2022). Multi-parameter optimized triboelectric nanogenerator based self-powered sensor network for broadband aeolian vibration online-monitoring of transmission lines. Adv. Energy Mat. 12, 1–13. doi:10.1002/aenm.202103654
Yang, F., Du, L., Chen, W., Li, J., Wang, Y., and Wang, D. (2017). Hybrid energy harvesting for condition monitoring sensors in power grids. Energy 118, 435–445. doi:10.1016/j.energy.2016.11.037
Yang, K., Abdelkefi, A., Li, X., Mao, Y., Dai, L., and Wang, J. (2021). Stochastic analysis of a galloping-random wind energy harvesting performance on a buoy platform. Energy Convers. Manag. 238, 114174. doi:10.1016/j.enconman.2021.114174
Yuan, S., Huang, Y., Zhou, J., Xu, Q., Song, C., and Thompson, P. (2015). Magnetic field energy harvesting under overhead power lines. IEEE Trans. Power Electron. 30, 6191–6202. doi:10.1109/TPEL.2015.2436702
Yuan, Z., Wei, X., Jin, X., Sun, Y., Wu, Z., and Wang, Z. L. (2021). Magnetic energy harvesting of transmission lines by the swinging triboelectric nanogenerator. Mat. Today Energy 22, 100848. doi:10.1016/j.mtener.2021.100848
Zangl, H., Bretterklieber, T., and Brasseur, G. (2008). “Energy harvesting for online condition monitoring of high voltage overhead power lines,” in Proceedings of the 2008 IEEE Instrumentation and Measurement Technology Conference, Victoria, BC, Canada, May 2008 (IEEE), 1364–1369. doi:10.1109/IMTC.2008.4547255
Zhang, L., Ruan, J., Du, Z., Huang, D., and Deng, Y. (2023). Transmission line tower failure warning based on FBG strain monitoring and prediction model. Electr. Power Syst. Res. 214, 108827. doi:10.1016/j.epsr.2022.108827
Zhao, J., Zhang, H., Zou, H., Pan, J., Zeng, C., Xiao, S., et al. (2022). Probability prediction method of transmission line icing fault based on adaptive relevance vector machine. Energy Rep. 8, 1568–1577. doi:10.1016/j.egyr.2022.02.018
Keywords: energy harvester, overhead transmission line, smart grid, low-frequency and low-amplitude, vibration suppression
Citation: Tan Y, Li S, Zhang W, Wang S, Zhou Y, He Y and Ren L (2023) Converting energy from overhead transmission line vibrations using a low-frequency and low-amplitude harvester in a smart grid. Front. Energy Res. 11:1286341. doi: 10.3389/fenrg.2023.1286341
Received: 31 August 2023; Accepted: 22 November 2023;
Published: 07 December 2023.
Edited by:
Yirui Wang, Ningbo University, ChinaReviewed by:
Shangce Gao, University of Toyama, JapanCopyright © 2023 Tan, Li, Zhang, Wang, Zhou, He and Ren. This is an open-access article distributed under the terms of the Creative Commons Attribution License (CC BY). The use, distribution or reproduction in other forums is permitted, provided the original author(s) and the copyright owner(s) are credited and that the original publication in this journal is cited, in accordance with accepted academic practice. No use, distribution or reproduction is permitted which does not comply with these terms.
*Correspondence: Limin Ren, cmVubGltaW5AbmVlcHUuZWR1LmNu
Disclaimer: All claims expressed in this article are solely those of the authors and do not necessarily represent those of their affiliated organizations, or those of the publisher, the editors and the reviewers. Any product that may be evaluated in this article or claim that may be made by its manufacturer is not guaranteed or endorsed by the publisher.
Research integrity at Frontiers
Learn more about the work of our research integrity team to safeguard the quality of each article we publish.