 Mengxuan Yan
 Zhanlian Li
 Chun Sing Lai
 Zhuoli Zhao
 Ahmed F. Zobaa
 Loi Lei Lai
 Zebing Shi4
- 1School of Automation, Guangdong University of Technology, Guangzhou, China
- 2Jiangmen Power Supply Bureau of Guangdong Power Grid Co Ltd., Jiangmen, China
- 3Department of Electronic and Electrical Engineering, Brunel University London, Uxbridge, United Kingdom
- 4China Southern Power Grid Co. Ltd., Guangzhou, China
The operational cost of a microgrid is significantly influenced by the response of storage systems and the complexities of the power market’s tariff structures. This paper addresses the challenges arising from the coexistence of new market entries and traditional tariffs, which contribute to a complex market environment. To tackle this issue, the paper establishes a microgrid market environment encompassing four types of tariffs. By modeling the response of electric storage and cold storage in a microgrid, the study formulates a non-linear mixed-integer optimization problem. Numerical studies are then conducted to verify the model and analyze market performance. The results reveal a trade-off in behavior among different market entries when optimizing the total cost of microgrid operation. These findings shed light on the complexities and trade-offs involved in microgrid operational cost optimization within a diverse market environment, offering valuable insights for market participants.
1 Introduction
Power market deregulation brings competitive trading to generation and consumer areas. Multiple market participants from both sides are allowed to submit their bids and are matched by market operators (Tabar et al., 2019; Tian et al., 2023). Unlike a regulated power market, deregulated trading may contain more uncertainties, which leads to a higher risk. Thus, a deregulated power market may contain multiple sub-markets to hedge the risk of uncertainties, such as a wholesale market, spot market, capacity market, and several ancillary markets in PJM (Rabiee et al., 2016; Fan et al., 2022; MansourLakouraj et al., 2022). In general, power market deregulation will improve the entire efficiency of power system operation and management. It can also promote the latest technologies by constructing specified market structures (He et al., 2016; Chen et al., 2021; Zhang et al., 2023).
Energy management in a microgrid has become an important issue in recent studies. Nowadays, energy management strategies are growing rapidly (Zhao et al., 2023). In this paper, a new energy management strategy has been proposed for a hybrid microgrid, including demand response and the internal power market (Al-Awami et al., 2017). In this regard, a configuration of multiple markets is considered in the proposed method, and interactions between the consumers, microgrid, and incentive strategies are included in the presented planning (Garcia-Torres et al., 2020; Huang et al., 2020). Due to the presence of various types of consumers, such as critical and normal loads, different power tariffs and contracts are utilized in energy management. Energy storage is an attractive area for academic and industrial researchers. It presents significant capabilities in power system efficiency enhancement, renewable energy integration, and demand response (Zhao et al., 2012; Zhao and Ding, 2017; Lin et al., 2019; Wang et al., 2021). It also improves the stability and reliability of the power grid (Zhao et al., 2017). Energy storage is also popular in microgrid operations. In a microgrid, energy storage helps in reducing risks due to the intermittence of renewable energy (Kwon et al., 2016; Olabi, 2017; Khaloie et al., 2021; Li et al., 2021). A coalitional game model for the trading of a biomass power plant (BPP) integrated with PV and wind farms was proposed (Khalilpour and Vassallo, 2016; Zhang et al., 2017a; Lai and McCulloch, 2017). It reported the need to have a different method to calculate the energy generation cost due to the installation of energy storage in solar energy production (Lai and McCulloch, 2016). The sizing requirements of solar PV and storage systems need to be considered in relation to biogas power plants. Solar irradiance could be affected by fluctuations introduced by passing clouds. The analysis of these fluctuations with regard to solar energy production could be focused by studying the instantaneous clearness index.
Demand response is another application of energy storage in minimizing the difference between peak and valley loads (Hakimi and Moghaddas-Tafreshi, 2014a; Zhang et al., 2017b; Lai et al., 2017c). Lai et al. (2017a) and Lai et al. (2017b) reported the future of energy storage applications with a focus on large-scale solar energy penetration. Chen et al. (2013), Amrollahi and Bathaee (2017) and Liu et al. (2018) reported the impact of energy storage degradation costs. Vehicle to Grid (V2G) technology is also a popular area for energy storage utilization. As an energy storage unit, batteries of electric vehicles (EVs) participate in microgrid peak shaving and frequency modulation (Lai and McCulloch, 2016; Lai et al., 2017a; Lai et al., 2017b). Gough et al. (2017) proposed an energy storage system (ESS) to minimize the total operation cost of the microgrid. The proposed model constructs an ESS with both electrical and cooling storage to simulate performance in the energy market (Hakimi and Moghaddas-Tafreshi, 2014b; Zidan et al., 2015; Valinejad et al., 2020; Rostamnezh et al., 2022).
By reviewing the aforementioned materials, at least three areas for improvement have been identified:
1. Decision makers in the microgrid and energy storage sectors face the challenge of choosing from multiple markets while aiming to minimize operating costs. In order to navigate these complex market entries, it is crucial to consider both market opportunities and tariff capability distribution. By assessing the available market opportunities and understanding the distribution of tariffs, decision makers can optimize their strategies for achieving minimum operating costs.
2. Microgrids in China have multiple market entries, including markets created by recent evolution and existing traditional tariffs. New regulations may lead to different storage responses in microgrids.
3. In many research works (Jiang et al., 2022), the cold generation in a cooling system is linearly modeled with boundary constraints and a steady coefficient of performance (COP). Chillers of cold generations operate non-linearly with non-steady-state COP.
The main contributions of this work are as follows:
• This paper presents a complex market environment for the microgrid with up to four different parallel tariffs. This environment represents a transition period in the initial stage of change.
• Both electricity and thermal network operations for storage response analysis have been considered. A dynamic COP from historical operational data was developed. Furthermore, this paper considers the pumping power switching mechanism in a cooling system with logical variables. These logical variables create the optimization of a cooling network and formulate a non-linear mixed-integer programming problem.
• Practically, different tariffs may not prevent the same economic values from generating multiple minimum points for optimization. In this case, not all local optimal solutions have a high industrial potential for change in behavior. This paper introduces a new regulation term in the objective function for less behavioral variation to increase the industrial implementation potential of the model.
• Numerical investigation is implemented for model verification and further analysis. Three different studies are selected for impact analysis from different market tariffs. The results show that trading-off occurs in response to storage toward different market entries.
This paper is organized as follows: multiple microgrid market entries are introduced in Section 2. Relevant storage response modeling and simulation construction are shown in Section 3. Section 4 gives a numerical study for storage response analysis. The conclusion is provided in Section 5.
2 Multiple market entries for a microgrid
2.1 Dynamic daily electricity price
In the retail section of catalog price, time-of-use (TOU) is implemented.
In the latest power market evolution, trading of contracts for differences (CFDs) is introduced. For price difference (PD) trading, bilateral negotiation (BN) and monthly bidding (MB) are constructed. A BN market is a yearly market that allows consumers and power plants to deploy transactions. Their trading willingness will be submitted to the power dispatch center for feasibility verification. The submission of BN takes place once a year. In an MB market, power consumption bids and generation bids are received. The market operators match bids with the consideration of dispatch feasibility. The submission of MB takes place once a month. For a dynamic daily price scheme, such as TOU, PD is compensated to give prices for each hour so that the shape of TOU remains the same to fulfill the requirements in catalog price (CP). Eq. 1 gives the power consumption cost with CP based on PD.
where
2.2 Capacity-based charging (CBC)
Two-part tariff is a pricing scheme for electricity in China. The first part is the daily electricity price mentioned previously. The second part is the basic price or capacity price, which is charged on CNY/kVA or CNY/kW. In Hong Kong, basic price is also called demand charge. The basic price is charged on the monthly maximum consumer injecting power or the maximum capacity of a consumer-based local transformer. In recent years, there has been an evolution in the power market, with the advancement of new technologies and the implementation of new policies aimed at promoting sustainable energy practices. Eq. 3 gives the cost generated from the basic price.
where
2.3 Macro-renewable generation promoting ancillary services (MRGPAS)
The market construction of ancillary services is one of the main tasks of power market deregulation in China. Unlike traditional ancillary services, this ancillary service market is specially designed for power peak shaving in supporting renewable generation. Energy storage inside consumers can trade mainly with wind power plants or solar power plants on the ancillary service trading platform to reduce the amount of abandoned wind/solar generation (Xu et al., 2012).
Wind/solar generation abandonment is an obvious phenomenon that occurs in the preliminary stage of renewable power development. For example, in wind generation, when the load decreases, the generation capability of thermal power plants is reduced with higher priority under power dispatch regulation in China. The reason for this is that the marginal cost of generation in wind farms is zero, and the government promotes the development of renewable energy. However, thermal units have lower operational bounds. The generation of thermal plants cannot be reduced over this bound for the start and stop of large cost of units. When a lower bound of thermal units is reached, wind generation abandonment occurs. As load reduction usually occurs at nighttime, wind generation abandonment and the trading chances of MRGPAS for electricity storage usually occur at night. In some MRGPAS markets, electricity storages of consumers’ microgrids can only trade with wind/solar power plants (Kumar and Palanisamy, 2020).
In a MRGPAS market, owners of electricity storages and power plants should submit their bids to the trading platform. The information includes the compensation price, trading time and time length, charging power, and 15-min time step load curves. The market operator matches bids from electricity storages and wind power plants with the consideration of grid operational constraints. When bids are matched, the storage should be charged with a certain compensation price. MRGPAS markets in some provinces have upper and lower limits for the compensation price. The upper and lower limits of the compensation price in a typical market in China are 0.2 CNY/kWh and 0.1 CNY/kWh, respectively. Eq. 4 gives the cost generated from MRGPAS.
where
2.4 Distributed solar generation feedback tariff
To enhance clean power generation and support relevant local industries, the Chinese government provides its first bi-directional tariff for microgrids on distributed PV generation. Consumers with distributed PV have two sub-tariff selections. The first sub-tariff is named full feed-in tariff (FFI). The PV operator is required to feed-in all its capacity to the power grid with specified installed protection and meters. The connection point of PV is not inside consumers in FFI, and consumer behavior is fully decoupled with PV generation variation. Therefore, FFI does not influence operation of the microgrid. The second sub-tariff is named surplus feed-in tariff (SFI). In SFI, consumers will consume PV generation as a priority. If surplus PV generation exists, this surplus capacity can be fed into the grid. In SFI, consumer behavior and PV time series generation will influence each other. Consumers with distributed PV can select either FFI or SFI. This paper mainly focuses on SFI modeling for its high integration capability with storage response. Eq. 5 gives the cost generated from SFI.
In Eq. 6, PV_cha represents the cost generated from the PV tariff. The cost generated from SFI is constructed in two parts. The first part, Comp, is from the compensation of governmental policy (Chen et al., 2013). The Chinese government offers compensation for all power generated under the full feed-in tariff (FFI) and surplus feed-in tariff (SFI). The second part, Ben, is the benefit from the surplus capacity feeding into the grid at the consumer side for SFI only. Eq. 7 calculates Comp and Ben, where negative 1 represents customer benefit.
In Eq. 7, PRsub represents the price of government compensation. PRcoal represents the local price of electricity generated from desulfurized fire coal. Gbt represents the PV generation power (kW) at the tth time step. Details of Gbt are given in Equations 8 and (9).
where the function Min_sele( ) receives two scalar inputs and outputs the lower value. The reason for choosing the function Min_sele is that SFI only admits the power generated from the SFI PV panel to feed into the grid. If the feed-in power load is larger than Ggent, the extra section is not admitted. The ratio Rt gives the benefit from the consumer to the grid.
Turning to microgrid cost with high industrial implementation potential, the aim of the microgrid is to satisfy the operational requirements with a minimum cost for industrial and commercial consumers. The objective function of microgrid operation is given in Eq. 10.
It is assumed that there are J periods within 1 day. The dynamic daily electricity price in each period is the same. Then,
Tariffs may not prevent all economic equivalence of all daily time periods. For example, the price value is the same under TOU for the same period. Even real-time prices may contain periods with similar price levels. In this period with similar economic equivalence, different response schemes with the same total consumption may have the same cost, leading to multiple optimal points of optimization. Some of these optimal points may contain high response fluctuation between different time periods that consumers find difficult to follow. A fluctuation regulation term is added to the objective function Eq. 11 to reject the solution with high fluctuation so that the potential for consumer implementation is increased.
3 Response of electric/thermal storage
3.1 Microgrid electrical network
Figure 1 introduces a typical electrical network of a large group of consumers.
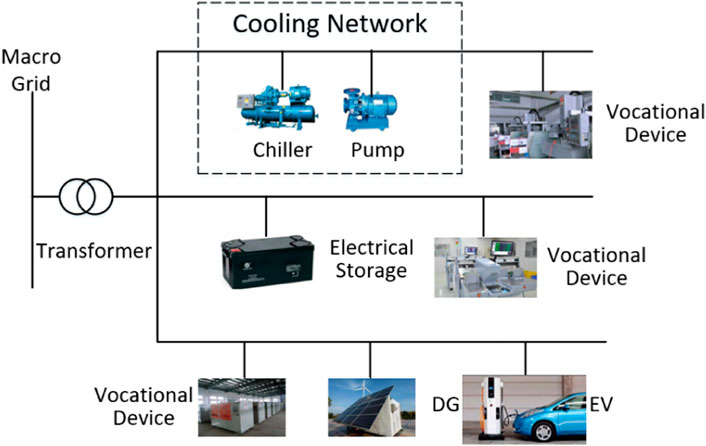
FIGURE 1. Electrical network in a typical large group of consumers.
Figure 1 shows a typical microgrid of a large group of consumers with the following devices: devices for manufacturing or other vocational devices, electricity storage, and distributed generation, including PV and electric-supported equipment in a cooling network. Eq. 12 gives the total power load from the electrical network.
where
3.1.1 Electricity storage response
Naturally, the operation of the electricity storage must be within its physical limit. The first limit is that the rate of charging or discharging should satisfy the storage’s security. Eq. 14 introduces the limit as constraints. In Eq. 15,
where
The second limit is that the energy stored in electricity storage must be within its maximum and minimum limits. Eq. 15 shows this limit.
where
If the consumer joins MRGPAS and has contracted with power plants at the specified time, the power of charging is fixed by the constraints detailed in the bid and contracts. Eq. 16 introduces this constraint.
3.2 Microgrid cooling network
A typical cooling network for a large group of consumers is shown in Figure 2.
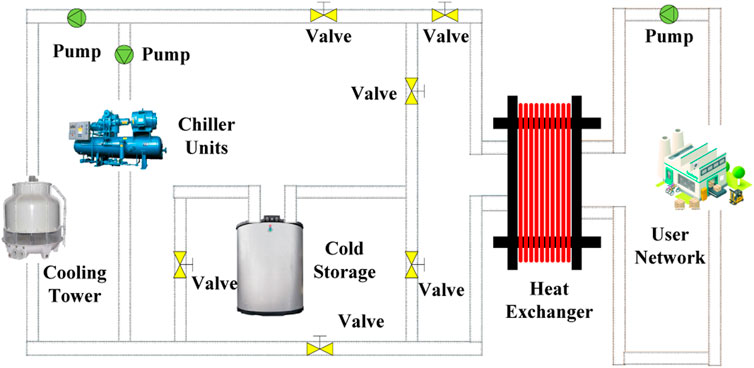
FIGURE 2. Cooling network in a typical large group of consumers.
The cooling network is for the generation and transmission of cold from chillers to consumers’ space. From Figure 2, chiller units are the only cold generation system in the network. The cold generated will be passed to the user network to satisfy the cooling requirement or be stored in cold storage.
3.3 Dynamic transformation rate from electrical power to cooling power
Cold is initially generated by chillers in a cooling network. COP is widely preferred to evaluate a chiller’s cold generation efficiency. Eq. 17 gives this relationship.
COP is not a constant. It will change while
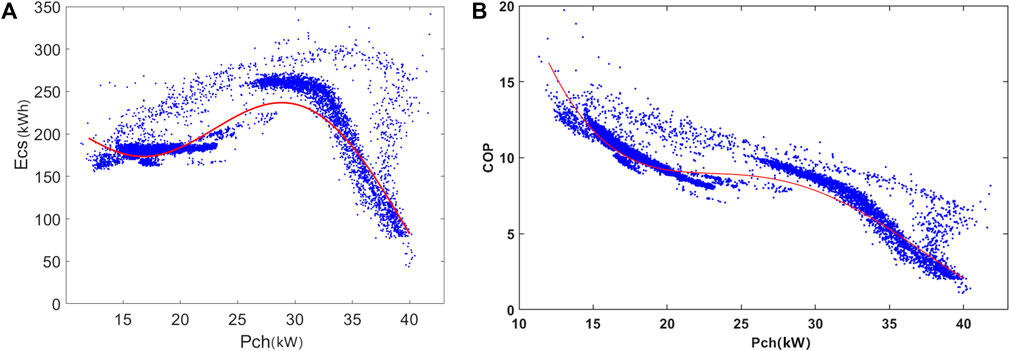
FIGURE 3. Operational statistics of cold generation in chillers. (A) Operational statistics among Ecs and Pch. (B) Operational statistics among COP and Pch.
As shown in Figure 3, COP decreases nonlinearly while
Moreover, the power of each chiller should not exceed its rated working range given in Eq. 19.
On a certain day, the requirement of time series indoor temperature depends on the requirements of vocational work, so the time series cold requirement is constant. To balance the cold generation and consumption, the cooling network should satisfy the requirement given in Eq. 20.
where
In Figure 2, the power exchanging speed of cold storage can be controlled by thermal energy exchanging areas through switching the corresponding valves, so the control of charging/discharging rate in cold storage can be given by Eq. 21.
Eq. 22 gives the limits for cold storages, where
Eq. 22 shows that cold storage cannot exceed its maximum and minimum operational limits at any time of the day.
For an electric vehicle charging station, the probability density function (PDF) of the arrival time of EVs is described by Eq. 23:
where
The daily load demand of EV charging is related to the daily driving mileage and charging duration. In general, the daily travel mile of an EV is considered to obey a normal distribution, and its PDF is described by Eq. 24:
where
4 Numerical study and analysis
4.1 Material and methods
To analyze the storage impact under multiple market accesses and verify model feasibility, a numerical study with practical data is implemented. The device’s power load time series under general operation is selected from a typical factory. The TOU tariff data used in this study were sourced from the official website of the Guangdong Provincial Development and Reform Commission in China. The compensation bid price of MRGPAS is assumed to be at its lowest limit, that is, 0.1 CNY/kWh. This assumption ensures the minimum benefit and the participation of the target factory in MRGPAS. MRGPAS also provides a bottom limit for participating electricity storage’s maximum charging/discharging rate, which is 10 MW.
The cooling system in this target factory contains three sub-cooling units. Each unit includes eight chillers connecting together on the same flowing pipe. Each chiller is associated with an independent pump. The total cooling requirement is collected from a typical day in summer in the factory’s historical data.
The target factory has one flywheel electric power storage group and one phase-changing cold power storage. The relevant boundary conditions in the numerical study are given in Table 1. As stochastic optimization is one of the typical methods for microgrid planning, the genetic algorithm is selected to solve the optimization. MATLAB GA Global Optimization Toolbox was used to carry out the study. The crossover rate was set at 0.8, while the mutation rate was at 0.01. The numerical study was carried out in MATLAB (version R2019a) on a computer with an AMD Ryzen 71,700 Eight-Core Processor, 3.00 GHz, and 8.0 GB of RAM.
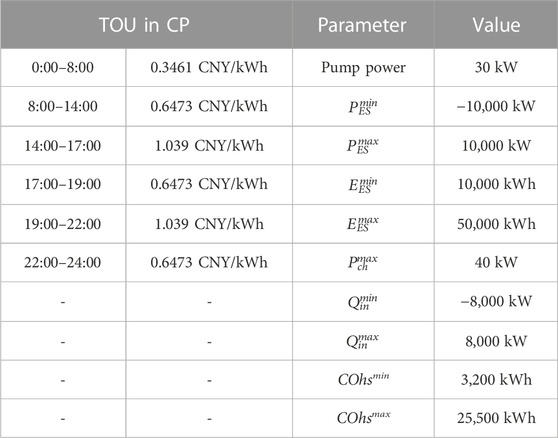
TABLE 1. Relevant boundary conditions of the numerical study.
4.2 Case 1: storage performance on binary market accesses: TOU with price difference and capacity-based charging
Case study 1 aims to demonstrate the storage performance when the microgrid joins dynamic daily electricity price and CBC together. Figures 5A–D show the optimization results.
From Figures 5A–D, the following three main points are observed:
Dynamic daily electricity price promotes storages to charge when the price is low and discharge when the price is high. The energy stored in both storages increases when the price is low and decreases when the price is high. The reason for this is that the cost of the microgrid will be decreased by consuming cheaper energy.
Different PD values will not influence the storage performance. As shown in Figure 4, results under different PD values are nearly the same. The reason for this is that the optimal cost of the microgrid under TOU only depends on the shape of the price curve. Because the same PD is added to the price level at each hour, shifting the price curve entirely will not change the relationship of price between any two time points. Therefore, time with a lower price will always be lower in different PD values, and different PD values will not influence the cost from CBC. Thus, catalog price with PD will not influence the storage performance.
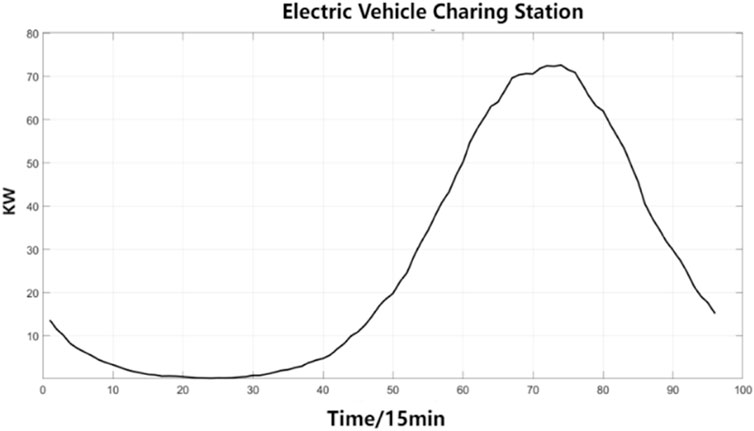
FIGURE 4. Electric vehicle power consumption.
The discharging rate of energy storage systems does not reach its maximum in price-peak time. Figure 4 shows that the absolute value of the discharging rate is still smaller than the storage’s maximum discharging rate. There is a remaining discharging capability in price-peak time. The reason for this is that the marginal cost from CBC will increase faster than cost reduction under TOU if the discharging rate increases in price-peak time.
4.3 Case 2: storage behavior in three-traffic market accesses: TOU with price difference, CBC, and MRGPAS
Case study 2 demonstrates the storage performance when the microgrid is under three-market accesses together. Considering that MRGPAS has a focus on renewable power generation, the bid of MRGPAS is assumed to happen at nighttime, for most wind generation abandonment occurs at night. Figures 5A–D and Table 2 give the result of optimization on different time lengths of MRGPAS participation. From MRGPAS requirements, cold storage is not allowed to join MRGPAS.
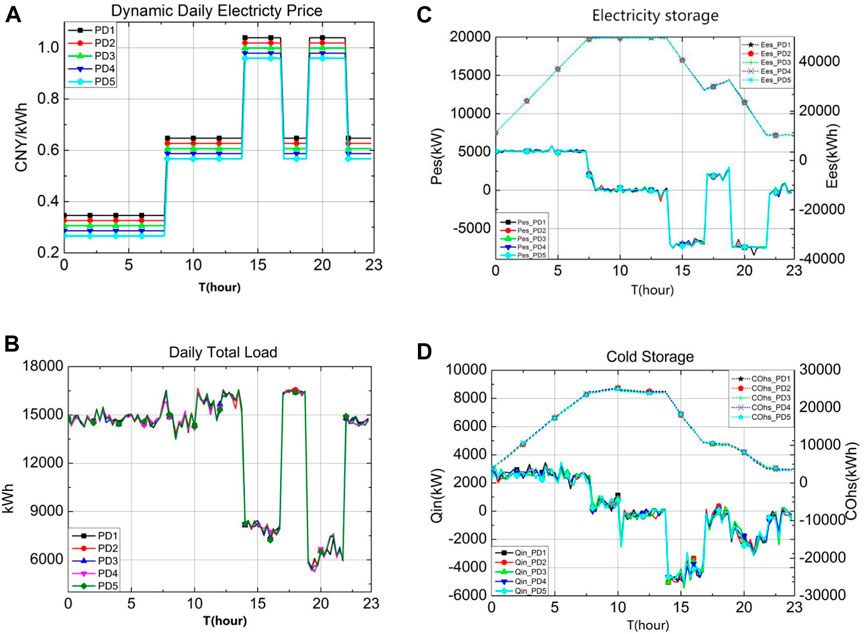
FIGURE 5. Optimization result of storage performance in case study 1. (A) Dynamic daily electricty Price (B) Daily total load (C) Electricity storage performance (D) Cold storage performance.
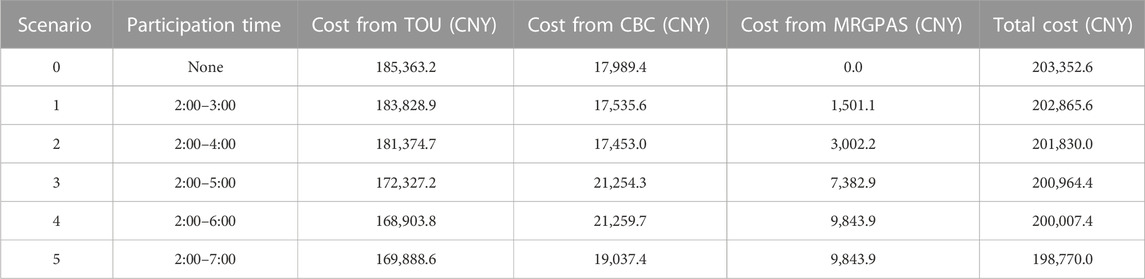
TABLE 2. Cost analysis under different MRGPAS participation time periods.
From Figures 6A, B, the following two points can be seen.
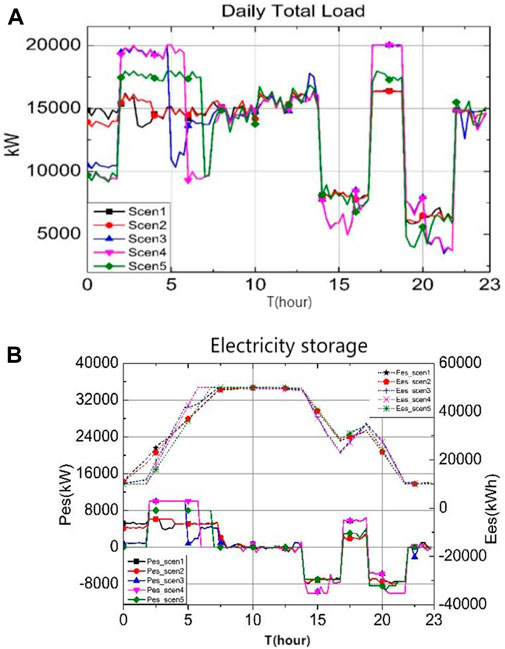
FIGURE 6. Result of storage performance optimization in case study 2. (A) Daily total load (B) Electricity storage performance.
At the time of MRGPAS trading, the charging rate of electrical storage is higher than the charging rate outside of MRGPAS trading time at night. The reason for this is that charging within the MRGPAS bid will generate extra revenue from the MRGPAS market other than charging under the daily dynamic price tariff. Therefore, a greater amount of charging rate is shifted into MRGPAS trading time in all scenarios. This means that choosing to release the control of electricity storage to charge in MRGPAS trading will lead to a lower cost than charging under the daily dynamic price.
The charging rate of electric storage will rise to a higher level than the charging rate outside the MRGPAS trading time at night when the length of trading time is not less than 3 h. When the length of trading time is larger than or equal to 3 h, the charging rate within trading time will have a significant increase. This phenomenon is due to the comparison between the marginal cost in CBC and that of MRGPAS trading. A detailed analysis is given in Figures 7A–D.
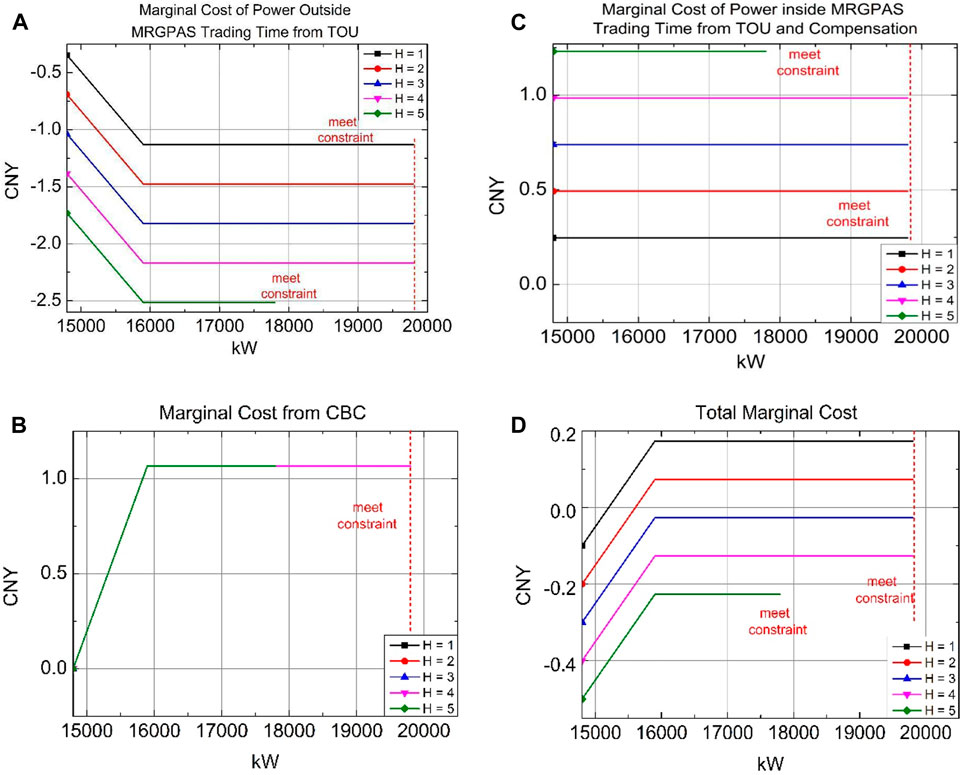
FIGURE 7. Marginal cost variation under three-market accesses. (A) Marginal cost of Powepr outside MRGPAS trading time from TOU. (B) Marginal cost from CBC. (C) Marginal cost of power inside MRGPAS trading time from TOU and compensation. (D) Total marginal cost.
Due to the compensation from the MRGPAS market, power shifts from outside the MRGPAS trading time to the trading time, which can generate extra benefits from MRGPAS. This shifting will increase the reference power and cost of CBC.
In addition, the load in the target period is limited to a threshold in case study 1 when the marginal cost of CBC becomes positive. Therefore, when charging power inside the MRGPAS trading time increases at night, the threshold of load limitation in the target period could be increased. Thus, the remaining capability in price-peak time can be shifted to the time between 17:00 and 19:00, which can reduce the cost further. When MRGPAS trading is larger than or equal to 3 h, the sum of MRGPAS compensation and threshold releasing will be larger than the cost increase of CBC. Thus, more charging power can be added inside the MRGPAS trading time. Reflecting on Figure 7 d), the marginal cost of H≥3 is negative, and so the cost will be decreased.
Figure 8 show the comparison of optimal cost under different trading time lengths. It shows that increasing the time length of the MRGPAS trading time will decrease the microgrid’s cost. Analysis of this case study shows that the time length of the MRGPAS bid will influence the cost in all three markets and thus influence the storage performance.
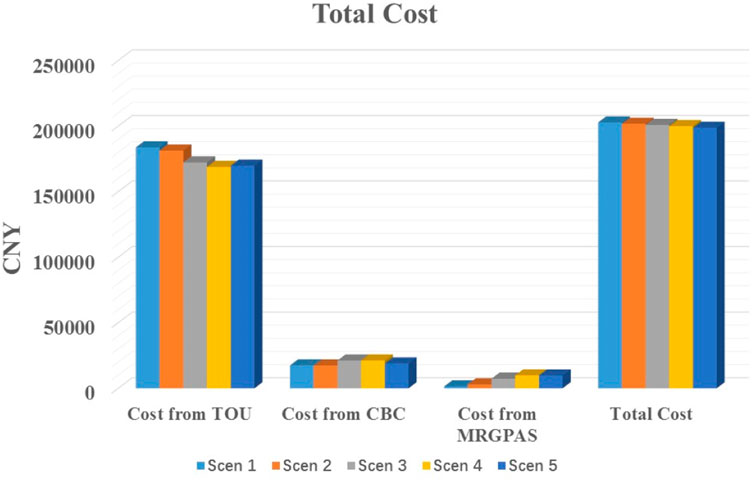
FIGURE 8. Cost variation details under three-market accesses.
4.4 Case 3: storage performance in four-market accesses
When the microgrid is integrated with distributed solar generation, less power from the grid is needed. This case study integrates all four-market accesses together for microgrid analysis. A typical daily generation capacity variation is shown in Figures 9A, B. Figures 9A, B and Table 3 give the results of solar generation. Scenario 5 from case study 3 is selected for MRGPAS access in this case study.
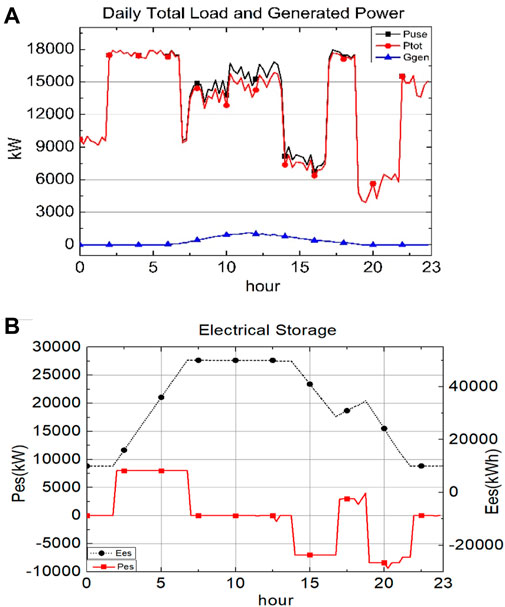
FIGURE 9. Microgrid operation under four-market accesses. (A) Daily total load and generated power. (B) Response behavior of electrical storage.
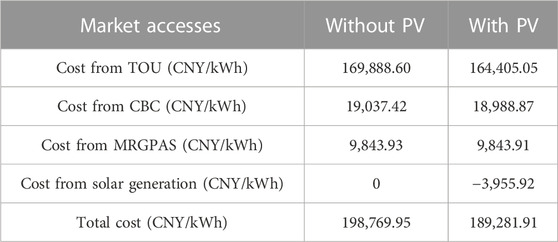
TABLE 3. Microgrid cost analysis under four-market accesses.
From Figures 9A, B, solar generation integration in a large network of consumers will compensate for an obvious section of the power consumption between 8:00 and 19:00. Between 14:00 and 17:00, the price reaches the maximum level in TOU; therefore, storages and PV panels will output their electricity to decrease the total load. Finally, the cost from TOU will be reduced from 169,888 CNY/day to 164,405 CNY/day for solar generation, and the microgrid will receive approximately 4,000 CNY/day as governmental compensation. Generally, solar power generation mainly occurs in the daytime. Thus, it only duplicates with the discharging of storage. The CBC reference and MRGPAS do not occur within these areas, and thus, solar power generation will not influence the response behavior of storage.
5 Conclusion
This paper presents market models with four different types of tariffs for the microgrid market environment. The performance of both electricity storage and cold storage systems is modeled to formulate a non-linear mixed-integer programming problem. The numerical study shows that different market accesses will influence the storage system’s response together. A trade-off of different market participation occurs on storage performance. However, generally, a microgrid with energy storage systems will achieve a reduced cost with more market participation. From the study and discussion, a better insight was provided into energy trading within a microgrid, including energy storage. A future work based on standard development could be considered.
Data availability statement
The raw data supporting the conclusions of this article will be made available by the authors, without undue reservation.
Author contributions
MY: conceptualization, data curation, investigation, methodology, writing–original draft, and writing–review and editing. ZL: conceptualization, formal analysis, investigation, methodology, and writing–original draft. CL: conceptualization, formal analysis, investigation, resources, and writing–review and editing. ZZ: conceptualization and writing–review and editing. AZ: writing–review and editing. LL: funding acquisition, methodology, resources, supervision, writing–original draft, and writing–review and editing. ZS: data curation, formal analysis, project administration, and writing–review and editing.
Funding
The author(s) declare that financial support was received for the research, authorship, and/or publication of this article. This research was supported by the National Natural Science Foundation of China (62206062) and the Guangdong Basic and Applied Basic Research Foundation (2021A1515010742).
Conflict of interest
Author MY was employed by Jiangmen Power Supply Bureau of Guangdong Power Grid Co Ltd. Author ZS was employed by China Southern Power Grid Co. Ltd.
The remaining authors declare that the research was conducted in the absence of any commercial or financial relationships that could be construed as a potential conflict of interest.
The author(s) declared that they were an editorial board member of Frontiers, at the time of submission. This had no impact on the peer review process and the final decision.
Publisher’s note
All claims expressed in this article are solely those of the authors and do not necessarily represent those of their affiliated organizations, or those of the publisher, the editors, and the reviewers. Any product that may be evaluated in this article, or claim that may be made by its manufacturer, is not guaranteed or endorsed by the publisher.
References
Al-Awami, A. T., Amleh, N. A., and Muqbel, A. M. (2017). Optimal demand response bidding and pricing mechanism with fuzzy optimization: application for a virtual power plant. IEEE Trans. Industry Appl. 53 (5), 5051–5061. doi:10.1109/tia.2017.2723338
Amrollahi, M. H., and Bathaee, S. M. T. (2017). Techno-economic optimization of hybrid photovoltaic/wind generation together with energy storage system in a stand-alone micro-grid subjected to demand response. Appl. energy 202, 66–77. doi:10.1016/j.apenergy.2017.05.116
Chen, T. H., Hsieh, T. Y., Yang, N. C., Yang, J. S., and Liao, C. J. (2013). Evaluation of advantages of an energy storage system using recycled EV batteries. Int. J. Electr. Power & Energy Syst. 45 (1), 264–270. doi:10.1016/j.ijepes.2012.08.037
Chen, W., Qiu, J., Zhao, J., Chai, Q., and Dong, Z. Y. (2021). Bargaining game-based profit allocation of virtual power plant in frequency regulation market considering battery cycle life. IEEE Trans. Smart Grid 12 (4), 2913–2928. doi:10.1109/tsg.2021.3053000
Fan, W., Huang, L. L., Cong, B., Degejirifu, , Tan, Z., and Xing, T. (2022). Research on an optimization model for wind power and thermal power participating in two-level power market transactions. Int. J. Electr. power & energy Syst. 134, 107423. doi:10.1016/j.ijepes.2021.107423
Garcia-Torres, F., Bordons, C., Tobajas, J., Marquez, J. J., Garrido-Zafra, J., and Moreno-Munoz, A. (2020). Optimal schedule for networked microgrids under deregulated power market environment using model predictive control. IEEE Trans. Smart Grid 12 (1), 182–191. doi:10.1109/tsg.2020.3018023
Gough, R., Dickerson, C., Rowley, P., and Walsh, C. (2017). Vehicle-to-grid feasibility: a techno-economic analysis of EV-based energy storage. Appl. energy 192, 12–23. doi:10.1016/j.apenergy.2017.01.102
Hakimi, S. M., and Moghaddas-Tafreshi, S. M. (2014a). Optimal planning of a smart microgrid including demand response and intermittent renewable energy resources. IEEE Trans. Smart Grid 5 (6), 2889–2900. doi:10.1109/tsg.2014.2320962
Hakimi, S. M., and Moghaddas-Tafreshi, S. M. (2014b). Optimal planning of a smart microgrid including demand response and intermittent renewable energy resources. IEEE Trans. Smart Grid 5 (6), 2889–2900. doi:10.1109/tsg.2014.2320962
He, G., Chen, Q., Kang, C., Xia, Q., and Poolla, K. (2016). Cooperation of wind power and battery storage to provide frequency regulation in power markets. IEEE Trans. Power Syst. 32 (5), 3559–3568. doi:10.1109/tpwrs.2016.2644642
Huang, H., Nie, S., Lin, J., Wang, Y., and Dong, J. (2020). Optimization of peer-to-peer power trading in a microgrid with distributed PV and battery energy storage systems. Sustainability 12 (3), 923. doi:10.3390/su12030923
Jiang, Z., Hlanze, P., and Cai, J. (2022). Optimal predictive control of phase change material-based energy storage in buildings via mixed-integer convex programming. Appl. Therm. Eng. 215, 118821. doi:10.1016/j.applthermaleng.2022.118821
Khalilpour, K. R., and Vassallo, A. (2016). A generic framework for distributed multi-generation and multi-storage energy systems. Energy 114, 798–813. doi:10.1016/j.energy.2016.08.029
Khaloie, H., Toubeau, J. F., Vallée, F., Lai, C. S., and Lai, L. L. (2021). An innovative coalitional trading model for a biomass power plant paired with green energy resources. IEEE Trans. Sustain. Energy 13 (2), 892–904. doi:10.1109/tste.2021.3138777
Kumar, G. V. B., and Palanisamy, K. (2020). A review of energy storage participation for ancillary services in a microgrid environment. Inventions 5 (4), 63. doi:10.3390/inventions5040063
Kwon, S., Ntaimo, L., and Gautam, N. (2016). Optimal day-ahead power procurement with renewable energy and demand response. IEEE Trans. Power Syst. 32 (5), 3924–3933. doi:10.1109/tpwrs.2016.2643624
Lai, C. S., Jia, Y., Lai, L. L., Xu, Z., McCulloch, M. D., and Wong, K. P. (2017b). A comprehensive review on large-scale photovoltaic system with applications of electrical energy storage. Renew. Sustain. Energy Rev. 78, 439–451. doi:10.1016/j.rser.2017.04.078
Lai, C. S., Jia, Y., McCulloch, M. D., and Xu, Z. (2017a). Daily clearness index profiles cluster analysis for photovoltaic system. IEEE Trans. Industrial Inf. 13 (5), 2322–2332. doi:10.1109/tii.2017.2683519
Lai, C. S., Jia, Y., Xu, Z., Lai, L. L., Li, X., Cao, J., et al. (2017c). Levelized cost of electricity for photovoltaic/biogas power plant hybrid system with electrical energy storage degradation costs. Energy Convers. Manag. 153, 34–47. doi:10.1016/j.enconman.2017.09.076
Lai, C. S., and McCulloch, M. D. (2016). Sizing of stand-alone solar PV and storage system with anaerobic digestion biogas power plants. IEEE Trans. Industrial Electron. 64 (3), 2112–2121. doi:10.1109/tie.2016.2625781
Lai, C. S., and McCulloch, M. D. (2017). Levelized cost of electricity for solar photovoltaic and electrical energy storage. Appl. energy 190, 191–203. doi:10.1016/j.apenergy.2016.12.153
Li, X., Wang, L., Yan, N., and Ma, R. (2021). Cooperative dispatch of distributed energy storage in distribution network with PV generation systems. IEEE Trans. Appl. Supercond. 31 (8), 1–4. doi:10.1109/tasc.2021.3117750
Lin, J., Kahrl, F., Yuan, J., Liu, X., and Zhang, W. (2019). Challenges and strategies for electricity market transition in China. Energy Policy 133, 110899. doi:10.1016/j.enpol.2019.110899
Liu, Z., Chen, Y., Zhuo, R., and Jia, H. (2018). Energy storage capacity optimization for autonomy microgrid considering CHP and EV scheduling. Appl. Energy 210, 1113–1125. doi:10.1016/j.apenergy.2017.07.002
MansourLakouraj, M., Shahabi, M., Shafie-khah, M., and Catalão, J. P. (2022). Optimal market-based operation of microgrid with the integration of wind turbines, energy storage system and demand response resources. Energy 239, 122156. doi:10.1016/j.energy.2021.122156
Olabi, A. G. (2017). Renewable energy and energy storage systems. Energy 136, 1–6. doi:10.1016/j.energy.2017.07.054
Rabiee, A., Farahani, H. F., Khalili, M., Aghaei, J., and Muttaqi, K. M. (2016). Integration of plug-in electric vehicles into microgrids as energy and reactive power providers in market environment. IEEE Trans. Industrial Inf. 12 (4), 1312–1320. doi:10.1109/tii.2016.2569438
Rostamnezhad, Z., Mary, N., Dessaint, L. A., and Monfet, D. (2022). Electricity consumption optimization using thermal and battery energy storage systems in buildings. IEEE Trans. Smart Grid 14 (1), 251–265. doi:10.1109/tsg.2022.3194815
Tabar, V. S., Ghassemzadeh, S., and Tohidi, S. (2019). Energy management in hybrid microgrid with considering multiple power market and real time demand response. Energy 174, 10–23. doi:10.1016/j.energy.2019.01.136
Tian, X., Chen, W., and Hu, J. (2023). Game-theoretic modeling of power supply chain coordination under demand variation in China: a case study of Guangdong Province. Energy 262, 125440. doi:10.1016/j.energy.2022.125440
Valinejad, J., Marzband, M., Korkali, M., Xu, Y., and Saad Al-Sumaiti, A. (2020). Coalition formation of microgrids with distributed energy resources and energy storage in energy market. J. Mod. Power Syst. Clean Energy 8 (5), 906–918. doi:10.35833/mpce.2019.000116
Wang, C., Zhang, Z., Abedinia, O., and Farkoush, S. G. (2021). Modeling and analysis of a microgrid considering the uncertainty in renewable energy resources, energy storage systems and demand management in electrical retail market. J. Energy Storage 33, 102111. doi:10.1016/j.est.2020.102111
Xu, Z., Guan, X., Jia, Q. S., Wu, J., Wang, D., and Chen, S. (2012). Performance analysis and comparison on energy storage devices for smart building energy management. IEEE Trans. Smart Grid 3 (4), 2136–2147. doi:10.1109/tsg.2012.2218836
Zhang, T., Qiu, W., Zhang, Z., Lin, Z., Ding, Y., Wang, Y., et al. (2023). Optimal bidding strategy and profit allocation method for shared energy storage-assisted VPP in joint energy and regulation markets. Appl. Energy 329, 120158. doi:10.1016/j.apenergy.2022.120158
Zhang, X., Chen, H., Xu, Y., Li, W., He, F., Guo, H., et al. (2017a). Distributed generation with energy storage systems: a case study. Appl. Energy 204, 1251–1263. doi:10.1016/j.apenergy.2017.05.063
Zhang, X., Hug, G., Kolter, J. Z., and Harjunkoski, I. (2017b). Demand response of ancillary service from industrial loads coordinated with energy storage. IEEE Trans. Power Syst. 33 (1), 951–961. doi:10.1109/tpwrs.2017.2704524
Zhao, H., Hong, M., Lin, W., and Loparo, K. A. (2017). Voltage and frequency regulation of microgrid with battery energy storage systems. IEEE Trans. smart grid 10 (1), 414–424. doi:10.1109/tsg.2017.2741668
Zhao, T., and Ding, Z. (2017). Cooperative optimal control of battery energy storage system under wind uncertainties in a microgrid. IEEE Trans. Power Syst. 33 (2), 2292–2300. doi:10.1109/tpwrs.2017.2741672
Zhao, X., Lyon, T. P., and Song, C. (2012). Lurching towards markets for power: China’s electricity policy 1985–2007. Appl. energy 94, 148–155. doi:10.1016/j.apenergy.2012.01.035
Zhao, Z., Xu, J., Guo, J., Ni, Q., Chen, B., and Lai, L. L. (2023). Robust energy management for multi-microgrids based on distributed dynamic tube model predictive control. IEEE Trans. Smart Grid, 1. (Early Access). doi:10.1109/tsg.2023.3290191
Keywords: coordinated operation, natural gas network, electrical network, credit rank indicator, microgrid
Citation: Yan M, Li Z, Lai CS, Zhao Z, Zobaa AF, Lai LL and Shi Z (2023) Energy management considering multiple power markets and microgrid storage. Front. Energy Res. 11:1285270. doi: 10.3389/fenrg.2023.1285270
Received: 29 August 2023; Accepted: 02 November 2023;
Published: 22 November 2023.
Edited by:
Hailong Li, Central South University, ChinaReviewed by:
Zequn Yang, Central South University, ChinaJunwei Yang, City University of Hong Kong, Hong Kong SAR, China
Copyright © 2023 Yan, Li, Lai, Zhao, Zobaa, Lai and Shi. This is an open-access article distributed under the terms of the Creative Commons Attribution License (CC BY). The use, distribution or reproduction in other forums is permitted, provided the original author(s) and the copyright owner(s) are credited and that the original publication in this journal is cited, in accordance with accepted academic practice. No use, distribution or reproduction is permitted which does not comply with these terms.
*Correspondence: Chun Sing Lai, Y2h1bnNpbmcubGFpQGJydW5lbC5hYy51aw==