 Weiguo Chen1,2
 Xiangtang Chen
 Yi Sun
- 1College of Business, Quzhou University, Quzhou, Zhejiang, China
- 2Department of Finance, Shijiazhuang Posts and Telecommunications Technical College, Shijiazhuang, Hebei, China
- 3School of Economics and Management, Wenzhou University of Technology, Wenzhou, Zhejiang, China
- 4Software College, Henan University, Kaifeng, Henan, China
- 5School of Finance, Anhui University of Finance and Economics, Bengbu, Anhui, China
The gradient differences of economic development and industrial structure differences in Jing-Jin-Ji Region are significant. The ability of Jing-Jin-Ji Region to pay for environmental protection is imbalanced. The above two situations make it difficult to achieve coordinated pollution reduction and carbon reduction governance. Accurately measuring carbon emission efficiency and thoroughly analyzing the cooperation and competition relationship of regional carbon emission reduction based on fully considering stakeholders are of great significance for the joint construction, prevention and control of regional ecological environment. The research is also of great significance for promoting high-quality economic development and ensuring effective protection of the regional ecological environment. This study combines game theory and DEA theory to measure the carbon emission efficiency of the Jing-Jin-Ji Region, and then uses spatial game theory to analyze the average degree of being attacked, anti-attack ability, strongest attacker, and optimal partner for the carbon emission efficiency of different DMUs. The study concluded that: 1) Xicheng District and Hedong District have higher carbon emission efficiency, while Mentougou District, Fengtai District, Changping District, Fangshan District, Shijingshan District, Pinggu District and Yanqing County have the lowest carbon emission efficiency. 2) From an analysis of the degree of being attacked, it can be observed that economically developed areas experience a higher average degree of being attacked compared to economically underdeveloped areas. In regions with lower economic development, the influence of the local government on reducing carbon emissions is not significant, whether acting independently or in collaboration. Regions with contrasting industrial structures could be ideal partners, and areas with higher carbon emission efficiency could collaborate with regions with lower carbon emission efficiency to achieve greater reduction potential.
1 Introduction
Along with the long-term sound development of our economy and the continuous improvement of industrialization and urbanization, the economic models and approaches to land expansion are also evolving. However, this progress has significant implications for the environment and natural resources. The traditional development model has resulted in a massive increase in energy consumption and carbon emissions. It is crucial to adopt a more sustainable approach to ensure the long-term health of our economy and environment. Urban agglomerations are a significant source of carbon emissions in our country. Controlling these emissions is crucial to implementing effective carbon management. Achieving carbon neutrality and reaching peak emissions are vital goals for promoting green and low-carbon development within Chinese urban agglomerations. Achieving carbon peaking and carbon neutralization in urban agglomerations is a necessary condition for China to reach its goals in this area, and these regions are key players in the country’s strategic plan to achieve carbon peaking and carbon neutralization. An in-depth analysis of the “dual-carbon” goal in the future process of high-quality development of urban agglomerations has significant practical significance and far-reaching influence on China’s “dual-carbon” goal of achieving carbon peak by 2030 and carbon neutrality by 2060.
Currently, the level of pollution emissions in the Jing-Jin-Ji Region far exceeds its environmental carrying capacity. Furthermore, improper industrial cooperation development is leading to a deterioration of the ecological environment. The Outline of the Plan for the Coordinated Development of the Jing-Jin-Ji Region proposes measures to address environmental pollution in the area. Key among these is the need to prioritise ecological environmental protection, break down administrative restrictions, and expand the region’s ecological space. Proactive steps in these areas can help mitigate the effects of pollution and promote ecological wellbeing in the region. During the forum on the coordinated development of the Jing-Jin-Ji Region in January 2019, General Secretary Xi underscored the importance of preserving the natural resources of the region, emphasizing the enduring value of “lucid waters and lush mountains.” Additionally, he called for strengthened measures to jointly address ongoing environmental and ecological challenges. While policies aim to overcome regional boundaries and enhance collaborative governance, the three provinces and cities located in Beijing, Tianjin, and Hebei exhibit diverse environmental and resource characteristics, as well as distinct functional roles. To successfully coordinate the interplay between economic growth, environmental protection, and resource utilization across the three regions, and create sustainable development strategies based on their functional differences, is not only a matter of respecting nature’s laws, but also a necessary requirement for the coordinated development of Beijing, Tianjin, and Hebei.
The key to reducing regional carbon emissions and developing a low-carbon economy is to improve carbon emission efficiency (Wang and Ma, 2018). Carbon emission efficiency essentially considers the production technology efficiency of carbon emissions (Farrell, 1957). Kaya and Yokobori (1993) defines carbon emission efficiency as the ratio of CO2 emissions to nominal GDP.There are many methods for measuring carbon emission efficiency, mainly including constructing relevant indices and Data Envelopment Analysis (DEA). Due to the applicability of the DEA method to efficiency evaluation with multiple inputs and outputs, and its independence from subjective factors and input-output dimensions, using Data Envelopment Analysis (DEA) (Barba-Gutiérrez et al., 2009; Grösche, 2009; Lee and Kung, 2011) to measure carbon emission efficiency is the mainstream method for carbon emission efficiency.
The goal of carbon emission efficiency is to boost regional economic benefits while simultaneously reducing regional carbon emissions. This is achieved through the effective and efficient allocation of economic resources, capital, labor, and energy within the region. It can fully reflect the progress of low-carbon economic transformation and serves as a crucial evaluation tool for regions that aim to integrate their development into the framework of sustainable growth (Wang et al., 2022). In the social context of enhancing environmental quality and mitigating climate change, the improvement of carbon emission efficiency has emerged as a hot topic recently due to its promise as an approach to reduce emissions and improve environmental quality (Xie et al., 2021). Based on an in-depth analysis of carbon emission efficiency, the paper includes the interest-game relationship of regional carbon emission reduction. Improving carbon emission efficiency has become a critical task in promoting the coordinated development of Beijing, Tianjin, and Hebei to facilitate high-quality economic development and protect the environment. It is crucial to lay the groundwork for a regional ecological security barrier. It is a crucial driver for sustainable economic development in the Jing-Jin-Ji Region, and it represents the most tangible way to enhance the quality of life for the residents of these three areas.
In reality, the Jing-Jin-Ji Region is geographically adjacent to each other and has water system connectivity. Air pollutants in adjacent regions have spatial diffusion and accumulation, and water pollution in adjacent regions has spatial diffusion. However, There are differences in economic development level, industrial structure, spatial layout, energy conservation and emission reduction technologies in the Jing-Jin-Ji Region. And also, there are differences in the degree of environmental pollution in adjacent regions. Different regions have different interest demands. Therefore, regional carbon emissions involve multiple stakeholders, and different local governments have different interest concerns. Strategies and actions taken based on different interest concerns will have a direct impact on regional carbon emissions (Korhonen and Siitari, 2009). Therefore, it is necessary to research regional carbon emission reduction cooperation from a more systematic and comprehensive perspective based on the multi-stakeholder perspective. And then, the research conclusion of this article will provide theoretical basis and policy reference for multi-stakeholder cooperation in carbon reduction.
The spatial game theory regards individuals as an important part of the spatial grid structure which holds that all game participants are limited by the spatial distance. Participants can only play the game with their nearest neighbors. The benefits of game participants determines whether the individual strategy is maintained (strategy survival) or converted to the strategy with higher returns (strategy death). Around 1992, Nowak et al. published a classic paper on spatial game (Nowak and May 1992; Nowak et al., 1994), which placed participants in a spatial grid structure and made them play games with their neighbors. It is found that there is spatial reciprocity in the process of the spatial game, and the cooperators will cluster together, and the mutual benefit and symbiosis of cooperators are conducive to resisting the encroachment of surrounding resisters (Lieberman et al., 2005). In reality, the interaction between participants often has a spatial structure. Each individual is exposed to the present value of the spatial location and has contact with neighboring individuals, which leads to a game. This spatial game is also known as evolutionary graph theory (Huang and Ling, 2020).
In the actual management process, the final decision scheme is often made by a few people. A good scheme that can be generally accepted by the participants should be conducive to the development of each member. In practice, some leaders form alliances with other members to defeat competitors, while other members form coalitions to defend themselves (Xu et al., 2023). It is important to understand how different DMUs face competitive pressure, and how to choose partners wisely. Based on this, this paper combines the spatial game with DEA efficiency evaluation, studies the spatial game relationship according to the adjacent relationship between the objects, and explores the carbon emission efficiency of Beijing, Tianjin and Hebei and its spatial game relationship, to offer suggestions for regional carbon emission joint governance.
The possible innovations and contributions of this study are as follows.
(1) Based on regional data from China, this paper combined the DEA theory with the spatial game to investigate the game relationship between objects of study based on their adjacent relationships in Jing-Jin-Ji Region for the first time. This paper fully considers the multiple interests involved in regional carbon emission and their varying concerns in evaluating regional carbon emission efficiency. Based on the evaluation of carbon emission efficiency, This paper conducts a thorough analysis of inter-regional competition and cooperation, taking into account the spatial relationship between different regions. This will enable the development of an ecological efficiency optimization scheme that can be accepted by stakeholders relevant to the regional competition and cooperation.
(2) Based on the regional data from China, theoretical research on regional carbon reduction cooperation has been enriched. With the implementation of the green and low-carbon development strategy and the proposal of the “dual carbon” goal, China’s overall industrial structure is gradually adjusted towards low-carbon. However, there are differences in the level of low-carbon among regions, and the low-carbon effects of industrial structure vary among different provinces and cities. In the case of significant differences in regional economic development, technological level and industrial structure, in order to achieve the “dual carbon” goal in a predetermined and short period of time, regional joint prevention and control and coordinated emission reduction have become important options to curb regional air pollution. Previous studies have focused on the direct energy correlation and close industrial correlation between regions, as well as the resulting carbon emission transfer between regions. However, the impact mechanism of regional carbon reduction cooperation on carbon reduction partners has not yet been elucidated. This article introduces game theory into the analysis of carbon reduction cooperation and studies the impact mechanism of regional carbon reduction cooperation on carbon reduction partners. Based on regional data from China, it enriches the theoretical research of regional carbon reduction cooperation.
Theoretically, the paper combines the Jing-Jin-Ji Region coordinated development background with the DEA (Data Envelopment Analysis, DEA) theory. Game theory and operational research theory are comprehensively utilized, and the influence of interest game among stakeholders of carbon emission on ecological efficiency is fully considered. Improving the evaluation index system and conducting a deep analysis of the spatial game relationship between the Jing-Jin-Ji Region are crucial in light of the existing ecological efficiency evaluation. This analysis will help clarify the competition and cooperation relationship of regional carbon emissions, which will further enhance the theoretical research on the evaluation of carbon emission efficiency of urban agglomerations.
Practically, the current ecological collaborative governance mechanism in the Jing-Jin-Ji Region lacks consideration of various factors that affect carbon emission efficiency, such as the spatial characteristics of environmental capacities across different regions, economic development levels, and pollution control abilities of polluters. By incorporating regional competition and cooperation into the study of carbon emission efficiency and considering the influence of spatial variables on carbon emission rights, we can obtain more scientific and reliable data and technical support. This approach can help us to accurately position ecological environmental protection targets and formulate governance tasks in different regions. Its ultimate aim would be to accelerate the establishment of ecological protection and compensation mechanisms tailored to the coordinated development needs of the Jing-Jin-Ji Region. It is vital to ensure a balance between achieving ecological benefits and managing environmental governance costs across various regions.
2 Literature review
With the continuous advancement of urbanization and industrialization, global warming and other environmental problems caused by carbon emissions have attracted wide attention from governments and scholars around the world. “Low carbon” and “emission reduction” have become hot topics in academic research, such as carbon emission estimation method (Zhao et al., 2012), influencing factors (Wang et al., 2013; Xu et al., 2014), intensity (Li and Zhou, 2012) and performance (Wang et al., 2010). Since carbon emission efficiency directly determines the overall carbon emissions level (Gao et al., 2021), Promoting carbon emission efficiency is seen as an efficient way to abate carbon emissions (Du et al., 2022). As an important part of environmental performance evaluation, carbon emission performance is the focus of relevant scholars. Current studies on carbon emission performance can be divided into single factor and total factor according to measurement methods. As for the single factor index, Mielnik et al. first used carbon emissions per unit of energy consumption to construct a carbon index to evaluate the carbon emission performance of developing countries (Mielnik and Goldemberg, 1999). Yamaji defined the ratio of total CO2 emission to GDP as CO2 productivity to study the carbon emission level in Japan (Yamaji et al., 1993). Since then, other single-factor indicators have gradually appeared, including CO2 emission intensity (Sun, 2005), per capita CO2 emission (Stretesky and Lynch, 2009), per capita cumulative emissions of industrialization (Zhang et al., 2008), energy intensity (Ang, 1999), etc. Most of the above studies used the ratio of carbon emissions to economic or energy-related indicators to construct single-factor indicators related to carbon emission performance, which is easy to understand and operate in the actual calculation process, but there are certain limitations.
In essence, carbon emission performance is the input-output efficiency in the process of economic activities, which is the result of the joint action of capital, labor and other economic inputs. It cannot be directly generated solely depending on energy. Therefore, the “all-factor” characteristics of indicators should be highlighted in the calculation process, and the substitution effect of other input factors in the process of economic production should be fully considered (Zeng and Wang, 2023). Based on the idea of total factor and factor substitution, energy consumption, capital investment and labor are taken as input indicators in the process of economic production to form the expected output of GDP and the unexpected output of carbon emission, so as to make the measurement results of carbon emission performance more accurate and reasonable (Wang et al., 2015). In 1978, Charnes, Coopor and Rhodes proposed for the first time the non-parametric method to evaluate production efficiency - Data Envelopment Analysis (DEA). By keeping the input or input of the decision making unit unchanged, this method determines the relatively effective production front surface with the help of a mathematical programming method, projects decision making unit onto the production front surface of DEA, and measures the relative effectiveness of decision making unit by comparing the degree to which decision making unit deviates from the DEA front surface (Charnes et al., 1978). Since this method does not need to assume the production function between input and output factors in advance and does not need to give the weight of input and output, it can better deal with the problem of multi-indicator performance evaluation and is suitable for constructing the relationship between environmental resource input and output, so it is widely used in carbon emission performance evaluation (Ren et al., 2022). Based on this, Ramanathan used the DEA method to construct an input-output index system including carbon dioxide emission, energy consumption and economic activity variables, and compared and analyzed the carbon emission performance of various countries (Ramanathan, 2002). Subsequently, a large number of scholars followed this idea, studied the carbon emission performance index system of different industries in different countries, and compared and analyzed the carbon emission performance level of different countries (Wang et al., 2013). For example, Zhou et al. used the DEA model and Malmquist index to measure the carbon emission performance of 18 countries with the highest carbon emissions in the world and investigate its influencing factors (Zhou et al., 2010). Jin et al. (2023) from the perspective of industry, such as using the DEA method is further analyzed the efficiency of China’s industrial sector carbon emissions, the results showed that light industry carbon emissions performance level is generally higher than that of heavy industry. Liu et al. used the RAM-DEA model to estimate the low carbon economic efficiency of China’s industrial sector during 2001–2013, and found that the low carbon economic efficiency of most industries was still at a low level, but the efficiency was greatly improved during the study period (Liu et al., 2010). Using 2005–2016 data, the carbon emission efficiency of the construction sector in 30 provinces is estimated, and the spatial distribution characteristics of the carbon emission efficiency of the construction industry is explored (Du et al., 2022). Gao et al. (2021) distinguished the differences between direct carbon emissions and embodied carbon emissions, including intermediate production and consumption, and constructed a noncompetitive input-output model to measure the embodied carbon emissions from 28 industry sectors in China.
In terms of research methods, the traditional DEA model only focuses on the expected output in the process of economic activities while ignoring the non-expected output, which may lead to deviations in the results (Du et al., 2014). Some scholars use improved models when measuring carbon emission performance, such as the directed distance function model (Yongrok et al., 2012), the relaxation variable measure model (Shen et al., 2018), and the super-efficiency SBM model (Zhou et al., 2022). In general, existing studies have used a variety of DEA models to analyze carbon emission performance at national, regional and industrial scales, but ignored the spatial correlation of carbon emissions. Due to the differences in economic development level, industrial structure, spatial layout, energy saving and emission reduction technologies of adjacent regions, the environmental pollution levels of adjacent regions are different. Moreover, due to the geographical location of adjacent regions and the connectivity of water systems, air pollutants and water pollution in adjacent regions have spatial diffusion and accumulation, and spatial diffusion of water pollution. Based on this, scholars pay attention to the spatial correlation of carbon emissions and begin to incorporate spatial characteristics into the study of carbon emission efficiency. Based on the ideal point cross-efficiency (IPCE) model and the social network analysis method, Shao and Wang measured the transportation carbon emission efficiency (TCEE) in China and explored the spatial correlation network structure of China’s provincial TCEE and its influencing factors (Shao and Wang, 2021). Lu et al. (2020) studied the relationship between cultivated land-intensive use (CLIU) and carbon emission efficiency (CEE), analyzed the spatial and temporal characteristics of CLIU, cropland carbon emission (CLCE) and CEE, and discussed the spatial correlation between CLIU and CEE in the Yellow River Basin. Jiang et al. (2022) analyzed the nonlinear relationship between environmental regulation and carbon emission efficiency, providing a scientific reference for achieving carbon neutrality at a lower cost. Guo et al. (2022) calculated the energy consumption and carbon emission efficiency of 11 prefecture-level cities in Shanxi Province from 2000 to 2020 by using the super efficiency slack-based measure and data envelopment analysis (SBM-DEA) model and Malmquist index. Ding et al. (2019) proposed a new method combining the CE model and the Malmquist productivity index (CE-MPI) to analyze the dynamic changes of carbon emission efficiency in 30 provinces in China. Du Q. et al. (2022) estimated the carbon emission efficiency of the construction industry in 30 provinces, and used the spatial Markov transfer probability matrix to explore the spatial distribution characteristics of the carbon emission efficiency of the construction industry. Du et al., 2022a employed the stochastic Frontier analysis approach combined with the Sheppard distance function to calculate the total factor carbon emission efficiency of each city and evaluated the impact of the pilot policy on carbon emission efficiency and its spatial spillover effect using the spatial difference-in-differences model. Dong et al. (2022) used the super-efficiency slacks-based measure (SE-SBM) model for the first time to measure CEE from 2000 to 2018 in 32 developed countries that have proposed carbon neutrality targets and then established a newly developed panel threshold model (PTIFEs) with interactive fixed effects to comprehensively explore the non-linear impact of renewable energy development (RED) on Central and Eastern Europe. Yu and Zhang. (2021) determined the causal effect of Low Carbon City Pilot (LCCP) policies on carbon emission efficiency (CEE).
Generally, the classical DEA model evaluates the efficiency of each decision making unit (DMU) by selecting the optimal weight between the evaluated unit and the reference set. However, in a real situation of conflict of interest, the decision-making unit needs to take bidirectional or multi-directional consideration, and there is direct or indirect competition between them (Liang et al., 2008). The decision-making unit should not only consider its optimal decision-making but also consider the influence of other decision-making units on itself. To better describe the competitive situation, scholars try to introduce the game theory into the DEA model and carry out the game study of DEA. Banker (1980) established a two-person zero-sum finite game by taking evaluated DMU and reference DMU as players, and gave the game theory explanation of CCR-DEA. Hao et al. (2000) combined the convex cone theory with the two-person zero-sum game to construct a two-person zero-sum infinite game model with closed convex cone constraints for a generalized analysis of DEA theory. Nakabayashi and Tone. (2006) introduced a multi-player game into the DEA model and expanded the application research of the DEA game. With all DMUs as players, it considered the cooperative game among decision-making units in accordance with the principle of egoism and shared the established interests. Wu et al. (2009) to make up for the shortcomings of traditional DEA efficiency evaluation, took all decision making units as players, reasonably improved the efficiency value of each decision-making unit and expanded the application of the classic DEA cross-efficiency model based on considering the game among the decision-making units. Afterwards, many scholars applied cross efficiency models to efficiency evaluation, Dong et al. measured Chinese provincial carbon efficiency using the game cross-efficiency data envelopment analysis (Dong et al., 2020). Dong et al. (2021) applied the data envelopment analysis game cross-efficiency method to calculate the ecological performance of 30 provinces and municipalities in China and to analyze the changes and time-and-space evolution characteristics of that performance. Wang et al. (2021) employed cross-efficiency DEA and game cross-efficiency DEA approaches to measure the energy efficiency of the construction industry in 30 of China’s provinces.
Based on the existing literature, ecological efficiency optimization research using the DEA method has attracted significant attention from scholars both domestically and abroad. This research has led to numerous theoretical and practical advancements. However, the majority of studies are limited to the processing and evaluation of related input-output indicators. Some studies are only simple applications of existing theoretical models, rarely considering the competition and cooperation between different evaluation objects in the process of environmental efficiency evaluation, and ignoring the spatial game relationship of carbon emissions, which makes it difficult to apply the research results to the practice of regional ecological collaborative governance. Due to differing economic development levels, industrial structures, spatial layouts, as well as energy-saving and emission-reducing technologies in adjacent regions, the levels of environmental pollution also vary. Additionally, because of the geographic location and connectivity of water systems between these areas, air and water pollutants can diffuse and accumulate, including water pollution.
3 Theoretical methods
Assume that
The goal of
Obtaining the efficiency value
Then we define the degree of the decision-maker
The average degree of all decision making units attack the decision-maker
For decision making unit
Under unilateral decision making conditions, there is also a problem of partner selection in decision-making units. Assume that the set of all decision making units is
Let
It is assumed that
Set
4 Empirical analysis
4.1 Carbon emission efficiency evaluation
Combined with the availability of data and the need for research, this paper selects carbon emission data, GDP data, capital stock data, and labor data of the Jing-Jin-Ji Region from 2013 to 2017 to study the evaluation of carbon emission efficiency of the Jing-Jin-Ji Region and its spatial game relationship. The data are mainly from Beijing Statistical Yearbook, Hebei Statistical Yearbook, Tianjin Statistical Yearbook and Express Professional Superior (EPS) database. The interpolation method was used to complete the missing data. Referring to the existing research results (Wei et al., 2010; Wang et al., 2023), it is assumed that there are only two input factors in the production process. Output variables include expected output and unexpected output.
Selecting the number of employees at the end of the year as the labor agency variable. Using fixed capital stock as a proxy variable for capital stock. Capital stock data was calculated using the ‘perpetual inventory method’ (Zhang et al., 2004). Output mainly included expected output and unexpected output. Select GDP as the proxy variable for expected output and use actual GDP data from each region for measurement. Co2 emission was chosen as the proxy variable for undesirable output. Substitute the above input-output variables into model
According to the above indicators, the carbon emission efficiency values of the Jing-Jin-Ji Region are solved by using the aforementioned model, as shown in Table 1. Table 1 shows that Xicheng District and Hedong District have high carbon emission efficiency from 2013 to 2017, with a carbon emission efficiency value of 1. Heping District, Jinghai County and Langfang City also have high carbon emission efficiency. During the sample period, the above three areas have the highest carbon emission efficiency for 4 years. From the perspective of the average efficiency of different regions during the sample period, Hedong District, Xicheng District, Langfang City, Cangzhou City, Heping District and Qinhuangdao City have the highest carbon emission efficiency, while Mentougou District, Fengtai District, Changping District, Fangshan District, Shijingshan District, Pinggu District and Yanqing County have the lowest carbon emission efficiency, with the average carbon emission efficiency of less than 0.5 during the sample period.Figure 1.
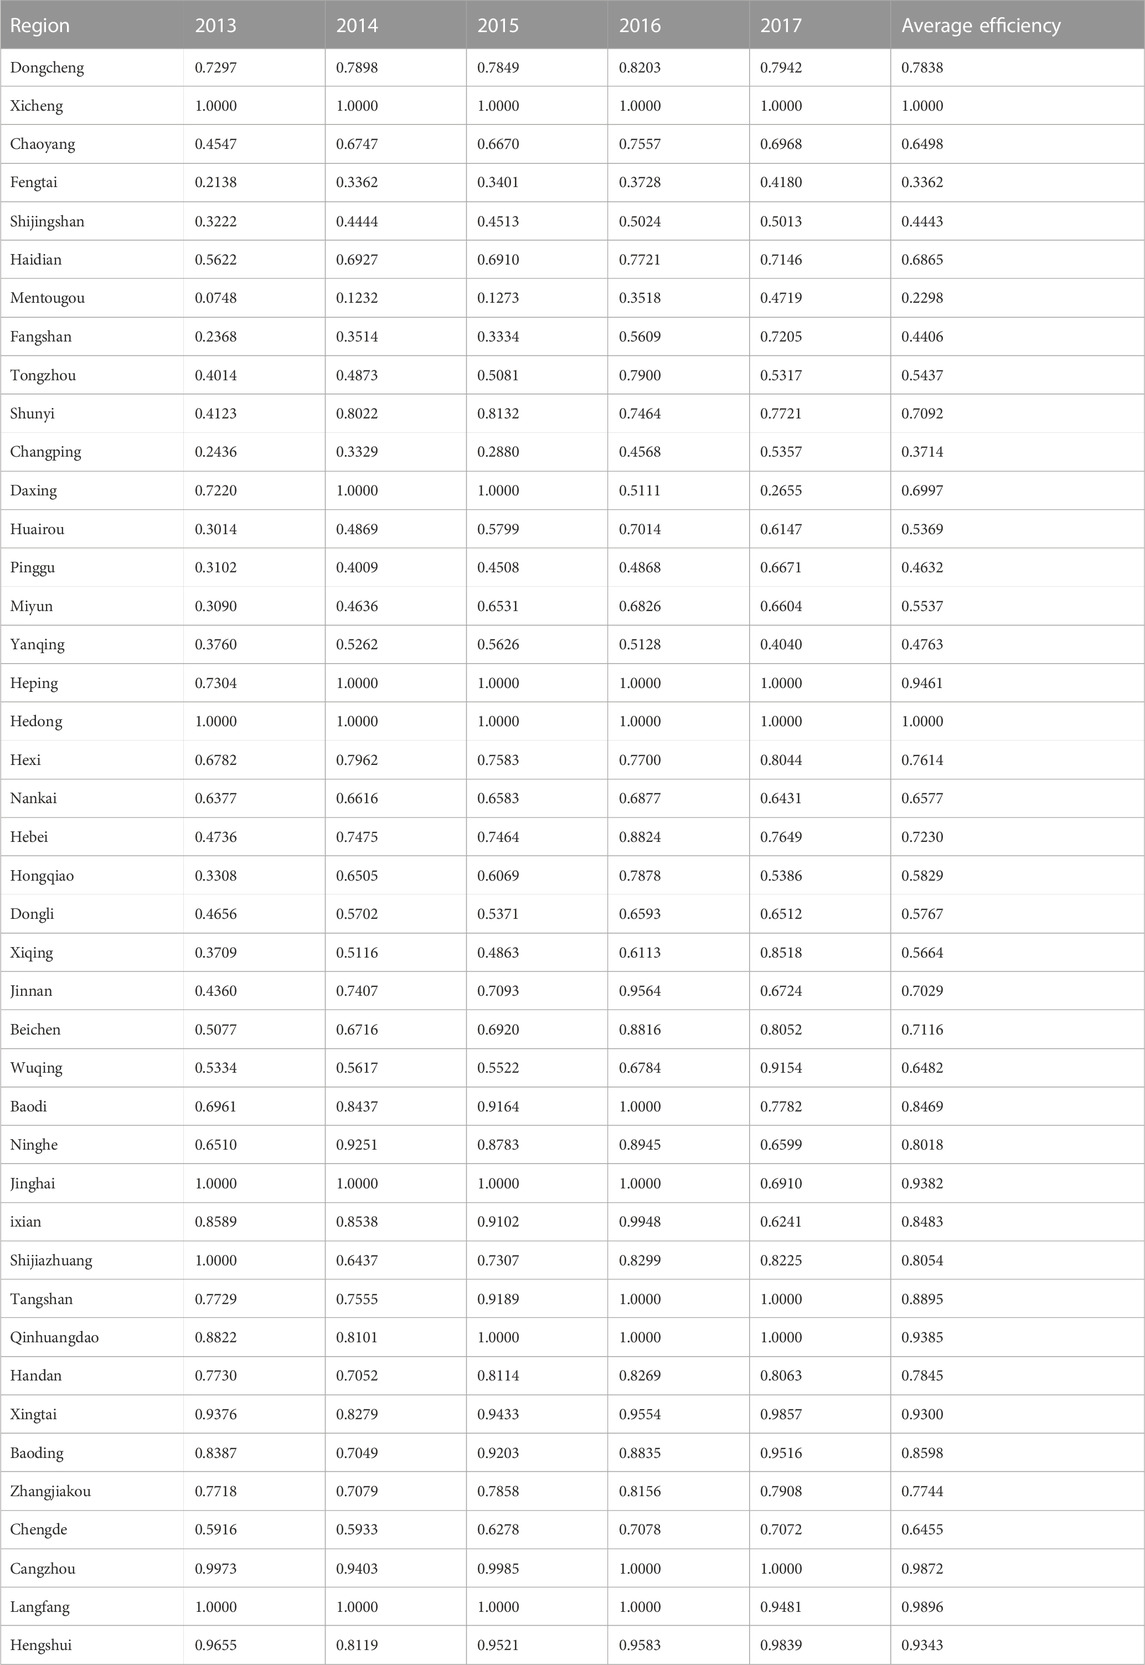
TABLE 1. Carbon emission efficiency of the Jing-Jin-Ji Region.

FIGURE 1. The structure of the alliance, competitors, and neutral DMU.
From the perspective of different regions, in terms of Beijing (Figure 2), Xicheng District’s carbon emission efficiency was always at the forefront of production during the sample period, Daxing District’s carbon emission efficiency was at the forefront of production in 2014 and 2015, and the carbon emission efficiency of other districts was mostly lower than 0.6 during the sample period. For Tianjin (Figure 3), the carbon emission efficiency of Hedong District was always at the forefront of production during the sample period, and the carbon emission efficiency of Heping District and Jinghai County was also at the forefront of production for 4 years during the sample period, but the carbon emission efficiency of Hongqiao District, Dongli District and Xiqing District within the region was mostly lower than 0.6 during the sample period. As far as Hebei is concerned (Figure 4), the carbon emission efficiency of most regions in the sample period is relatively high, mostly higher than 0.6. By comparing the average carbon emission efficiency of the three regions during the sample period, it can be seen that the carbon emission efficiency of Hebei is relatively high while that of Tianjin, especially Beijing, is relatively low. According to the existing research (Feng and Li, 2017), the above phenomenon can be attributed to the fact that the shadow price of carbon dioxide emission is relatively high in economically developed regions, especially Beijing, and the cost of emission reduction is relatively high, which makes the economic cost of reducing carbon dioxide emission relatively high, resulting in the low emission reduction efficiency index. However, the shadow price of carbon emission reduction in the economically underdeveloped Hebei region is relatively low. That is, the cost of reducing carbon emissions is not high, so the carbon emission efficiency is higher.

FIGURE 2. Carbon emission efficiency of Beijing.
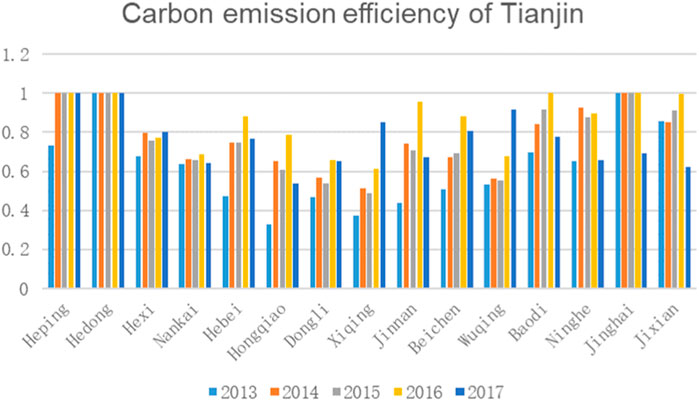
FIGURE 3. Carbon emission efficiency of Tianjin.
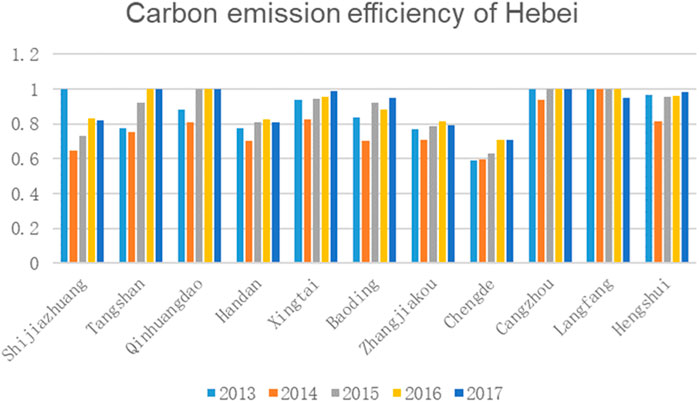
FIGURE 4. Carbon emission efficiency of Hebei.
4.2 Spatial game analysis
During the sample period, Xicheng District, Jixian County, Hedong District, Dongcheng District and Heping District ranked in the top five in terms of average degree of being attack, indicating that the above decision making units were most affected by other decision making units on average, and the carbon emission efficiency was greatly interfered by other regions. In the sample period, Dongli District, Fangshan District, Fengtai District, Changping District and Mentougou District were the least attack on average. This indicates that other decision making units have less influence on the above decision making units on average, so the above decision making units are more stable than other decision making units. By year, the average degree of attack during the sample period was the least in Mentougou District, Fengtai District and Daxing District of Beijing, and Wuqing District and Xiqing District of Tianjin. The average degree of attack during the sample period was higher in the Xicheng District of Beijing and Ji County and Hedong District of Tianjin. Referring to the existing literature (Peng, 2008; Wu and Zhu, 2010), it can be seen that this is mainly due to the relatively high degree of economic connection between regions within the economically developed areas, while the economic connection between regions within the economically underdeveloped areas is weak. This results in more economically developed areas being attacked harder on average and less economically developed areas being attacked harder on average.
The anti-attack capability of decision-making unit indicates the maximum degree of impact that decision making unit can withstand after the average impact of all decision-making units. For a decision-making unit, there is always a decision-making unit that has the greatest impact on him. Based on the sample data, this paper calculates the average degree of being attacked, anti-attack ability and the data of the strongest attacker of each decision-making unit, as shown in Table 2. As shown in Table 2, in terms of the anti-attack capability of each decision-making unit, Langfang, Cangzhou, Tangshan, Hengshui and Xingtai have the strongest anti-attack capability, while Pinggu District, Shijingshan District, Changping District, Fengtai District and Mentougou District have the weakest anti-attack capability. By year, the areas with the strongest anti-attack capability during the sample period mainly include Langfang City and Cangzhou City, etc., while the areas with weak anti-attack capability mainly include Mentougou District, Changping District, Fengtai District and Shijingshan District. Existing research literature (Wang et al., 2019) shows that when the economic development level of local government and the external government is relatively low in the region, the effect of carbon emission reduction of local government is not significant whether it is independent emission reduction or cooperative emission reduction. From the GDP figures of different regions, compared with Langfang and Cangzhou, Mentougou District, Changping District, Fengtai District and Shijingshan District are relatively backward in economic development, and their local governments’ carbon emission reduction effect is not significant, which to some extent can explain their weak anti-attack ability.
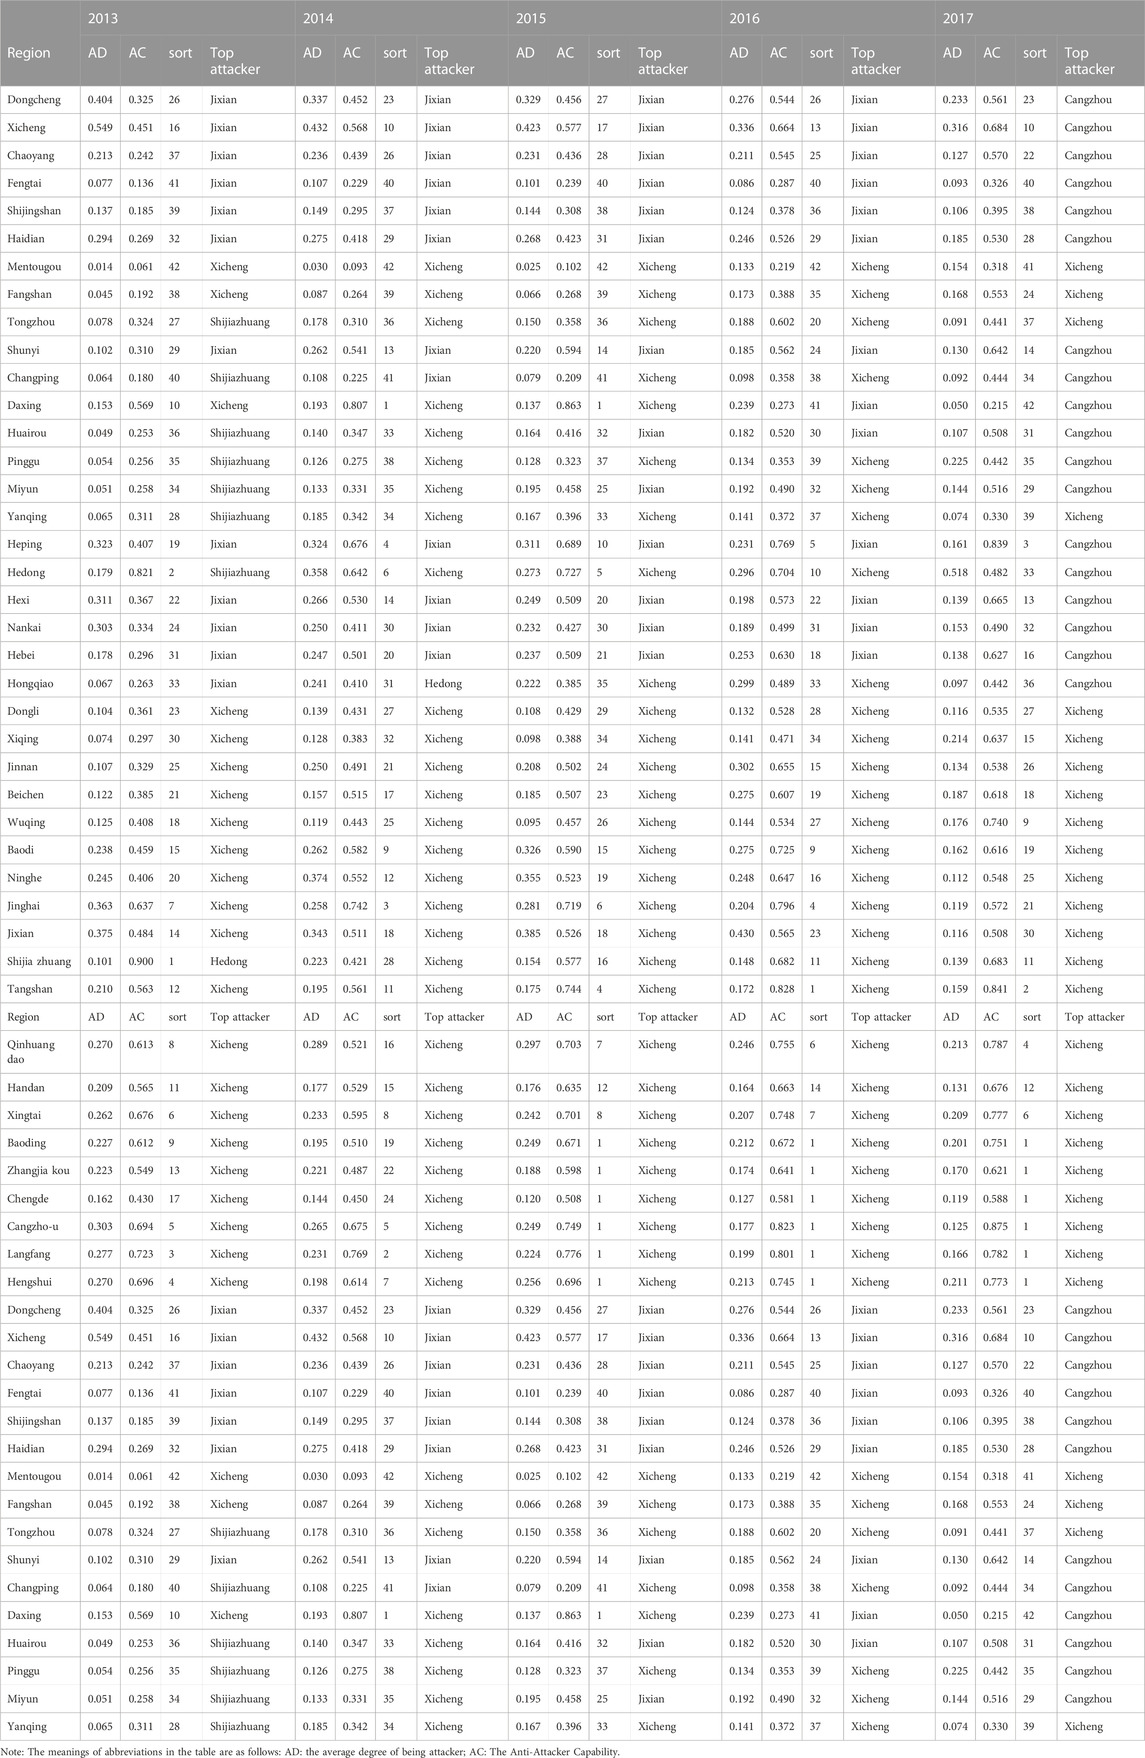
TABLE 2. Average degree of being attacked, anti-attack ability and the strongest attacker of each decision making unit.
According to theoretical analysis, for certain decision-making unit, there is always a decision-making unit that has the greatest impact on it. We call the decision-making unit the strongest attacker. After determining the strongest attacker of decision unit based on the data in Table 2, this paper analyzes the optimal partner of decision unit under the attack of the strongest attacker and its corresponding carbon emission efficiency (show in Table 3).

TABLE 3. The optimal partners for each decision-making unit under different attack scenarios.
Specifically, in Beijing area, the strongest attackers mainly include Jixian and Xicheng district, while the best partners mainly include Shijiazhuang and Cangzhou and other cities in Hebei Province. In terms of Tianjin, Xicheng District is the most aggressive city, followed by Jixian County. Its optimal partners mainly include Shijiazhuang, Cangzhou and other cities, among which Dongcheng District is the best partner of Hongqiao District. As far as Hebei is concerned, Xicheng District is the strongest attacker, and Shijiazhuang is the best partner, among which Dongcheng District is the best partner. Based on the empirical analysis results, it can be seen that Xicheng District is the strongest offender of regional carbon emission efficiency, while Shijiazhuang is the best regional partner. According to existing studies (Wu and Zhao, 2014), the existing energy consumption and industrial structure in the Jing-Jin-Ji Region led to large carbon dioxide emissions in the region. The difference in the industrial structure of Beijing, Tianjin and Hebei also causes the gap in the scale and intensity of carbon emissions. Beijing is mainly dominated by the development of the service industry, and its carbon emission scale and intensity have decreased significantly, while Tianjin and Hebei are mainly dominated by industrial development, and have not yet reached the carbon peak (Wang, 2017). Based on the empirical analysis results and existing literature, it can be seen that the development of the service industry plays a pivotal role in improving carbon emission efficiency, and the change of its emission efficiency has the greatest impact on regional carbon emission efficiency. Regions with different industrial structures can become the best partners, and regions with higher carbon emission efficiency and regions with lower carbon emission efficiency have greater cooperation potential.
5 Conclusion and suggestions
5.1 Conclusion
Urban agglomerations are an important source of carbon emissions in our country. Controlling the carbon emissions of urban agglomerations means controlling the main body of carbon emissions. The peak of carbon emissions and achieving carbon neutrality of urban agglomerations are important supports for China’s green and low-carbon development. The Beijing-Tianjin-Hebei City cluster is an essential component of China’s three world-class city clusters. It is also a vital core area for the northern economy, and a crucial region for achieving China’s strategic goal of carbon peaking and carbon neutrality. Conducting a detailed analysis of the carbon emission efficiency in the Jing-Jin-Ji Region and taking into account the interdependent relationships among stakeholders concerning regional carbon emissions is crucial to achieving China’s objectives of carbon peaking and carbon neutrality.
This paper combines game theory and DEA theory. Firstly, the base model is used to evaluate the carbon emission efficiency of the Jing-Jin-Ji Region. Additionally, the paper proposes a new mechanism to coordinate the carbon trading market using a game theory approach. Then, according to the spatial game theory, the average degree of being attacked, anti-attack ability, the strongest attacker and its optimal partner of the carbon emission efficiency of different decision-making units are analyzed. The study concluded that: 1) Xicheng District and Hedong District have a high carbon emission efficiency value of 1. Heping District, Jinghai County, and Langfang also exhibit high carbon emission efficiency. From the viewpoint of average efficiency among different regions during the sample period, the highest carbon emission efficiency was observed in Hedong District, Xicheng District, Langfang City, Cangzhou City, Heping District, and Qinhuangdao City. In contrast, Mentougou District, Fengtai District, Changping District, Fangshan District, Shijingshan District, Pinggu District, and Yanqing County presented the lowest carbon emission efficiency. 2) During the sample period, Xicheng District, Jixian County, Hedong District, Dongcheng District, and Heping District ranked as the top five areas with the highest average degree of being attacked. In contrast, Dongli District, Fangshan District, Fengtai District, Changping District, and Mentougou District had the lowest average degree of being attacked. This suggests that economically developed areas have a higher likelihood of being attacked, while economically underdeveloped areas have a smaller likelihood of being attacked. Based on their anti-attack capability, it seems that Langfang, Cangzhou, Tangshan, Hengshui, and Xingtai have the strongest ability to resist potential adverse impacts on their decision-making processes. Meanwhile, Pinggu, Shijingshan, Changping, Fengtai, and Mentougou have the weakest anti-attack capability during the sample period. This indicates that the influence of local governments on carbon emission reduction may not be significant in regions with low economic development, whether acting independently or in cooperation. During the same period, Xicheng District showed the lowest efficiency in terms of regional carbon emissions, while Shijiazhuang was the most efficient in terms of carbon emissions reduction. This suggests that regions with different industrial structures may be the best partners, and regions with higher or lower levels of carbon emission efficiency may have greater potential for cooperation.
5.2 Suggestions
Based on existing research conclusions, the following suggestions are proposed.
(1) Improving top-level system design and promoting regional collaborative carbon control. The research conclusion shows that regions with different industrial structures can become optimal partners for cooperation. Regions with high carbon emission efficiency and those with low carbon emission efficiency have greater cooperation potential. Based on this, the three regions of Beijing, Tianjin, and Hebei should strengthen collaborative efforts to reduce pollution and control carbon emissions from the source. Taking into account the industrial and energy foundations and differences of the three regions, the top-level design of the economic and social development and energy development of the Jing-Jin-Ji Region should be optimized and improved, and the national “dual-carbon” goals and regional carbon emission situation should be carefully considered. The relationship between the overall carbon peak in the Jing-Jin-Ji Region and the orderly carbon peak in each city should be handled, and the carbon emission reduction roadmap for key areas in the Jing-Jin-Ji Region should be formulated, taking into account the differences in regional development patterns.
(2) Expanding green ecological space and achieving regional collaborative carbon reduction. The research conclusion shows that the average degree of being attacked is higher in economically developed areas, while the average degree of being attacked is lower in economically underdeveloped areas. Based on this, efforts should be made to improve and optimize the green ecological space pattern in the Jing-Jin-Ji Region, strengthen the construction of green ecological barriers, enhance the carbon sequestration function of carbon sinks such as forests, grasslands, wetlands, cultivated land, and oceans, especially in economically developed areas. The principle of adapting measures to local conditions, ecological priority, and people-oriented urban construction should be adhered to, actively constructing a new era of green development system that conforms to the concept of “ecological priority and green development” in China’s economy. A comprehensive evaluation and analysis of the effectiveness and shortcomings of regional green development should be conducted to explore the road to high-quality development under the guidance of the concept of ecological priority and green development.
(3) Innovating green and low-carbon technology and promoting collaborative carbon reduction in the region. The research conclusion indicates that in regions with lower levels of economic development, whether independent or cooperative carbon reduction is used, the local government’s carbon reduction effect is not significant. Based on this, it is necessary to collaboratively build an energy technology innovation system that can adapt to the “dual-carbon” goals of the Jing-Jin-Ji Region, fully leveraging the resource endowment advantages of Hebei Province and the research institutes clustering advantages of Beijing and Tianjin, promoting the development of clean energy together, conducting collaborative research in key areas such as decarbonization, zero-carbon, negative-carbon, and carbon capture technologies, accelerating technological innovation, forming a three-dimensional comprehensive economic and industrial system, while reducing carbon emissions, building a new highland for the coordinated development of low-carbon technologies in the Jing-Jin-Ji Region, and providing new momentum for economic development.
Data availability statement
The original contributions presented in the study are included in the article/supplementary material, further inquiries can be directed to the corresponding author.
Author contributions
WC: Conceptualization, Funding acquisition, Project administration, Writing–review and editing. XC: Conceptualization, Funding acquisition, Methodology, Writing–original draft, Writing–review and editing. EW: Data curation, Investigation, Methodology, Writing–review and editing. YD: Formal Analysis, Writing–review and editing. YS: Investigation, Validation, Writing–review and editing. LZ: Methodology, Writing–review and editing.
Funding
The author(s) declare financial support was received for the research, authorship, and/or publication of this article. This research was funded by S&T Program of Hebei (No. 215576107D), and Ministry of Education Humanities and Social Sciences Research Planning Fund Project (No: 22YJA630008).
Conflict of interest
The authors declare that the research was conducted in the absence of any commercial or financial relationships that could be construed as a potential conflict of interest.
Publisher’s note
All claims expressed in this article are solely those of the authors and do not necessarily represent those of their affiliated organizations, or those of the publisher, the editors and the reviewers. Any product that may be evaluated in this article, or claim that may be made by its manufacturer, is not guaranteed or endorsed by the publisher.
References
Ang, B. W. (1999). Is the energy intensity a less useful indicator than the carbon factor in the study of climate change? Ener. Pol. 27, 943–946. doi:10.1016/S0301-4215(99)00084-1
Banker, R. D. (1980). A game theoretic approach to measuring efficiency. Eur. J. Oper. Res. 5, 262–266. doi:10.1016/0377-2217(80)90058-2
Barba-Gutiérrez, Y., Adenso-Díaz, B., and Lozano, S. (2009). Eco-efficiency of electric and electronic appliances: a data envelopment analysis (DEA). Environ. Model. Assess. 14, 439–447. doi:10.1007/s10666-007-9134-2
Charnes, A., Cooper, W. W., and Rhodes, E. (1978). Measuring the efficiency of decision making units. Eur. J. Oper. Res. 2, 429–444. doi:10.1016/0377-2217(78)90138-8
Ding, L. L., Yang, Y., Wang, W., and Calin, A. C. (2019). Regional carbon emission efficiency and its dynamic evolution in China: a novel cross efficiency-malmquist productivity index. J. Clean. Prod. 241, 118260. doi:10.1016/j.jclepro.2019.118260
Dong, F., Li, Y. F., Gao, Y. J., Zhu, J., Qin, C., and Zhang, X. Y. (2022). Energy transition and carbon neutrality: exploring the non-linear impact of renewable energy development on carbon emission efficiency in developed countries. Resour., Conserv. Recy. 177, 106002. doi:10.1016/j.resconrec.2021.106002
Dong, F., Qin, C., Zhang, X., Pan, Y., Gao, Y., Zhu, J., et al. (2021). Towards carbon neutrality: the impact of renewable energy development on carbon emission efficiency. Int. J. Env. Res. PUB HE 18 (24), 13284. doi:10.3390/ijerph182413284
Dong, F., Zhang, Y., and Zhang, X. (2020). Applying a data envelopment analysis game cross-efficiency model to examining regional ecological efficiency: evidence from China. J. Clean. Prod. 267, 122031. doi:10.1016/j.jclepro.2020.122031
Du, K. R., Huang, L., and Yu, K. (2014). Sources of the potential CO2 emission reduction in China: a nonparametric metafrontier approach. Appl. Energ. 115, 491–501. doi:10.1016/j.apenergy.2013.10.046
Du, M. Z., Feng, R. K., and Chen, Z. F. (2022a). Blue sky defense in low-carbon pilot cities: a spatial spillover perspective of carbon emission efficiency. Sci. Total Environ. 846, 157509. doi:10.1016/j.scitotenv.2022.157509
Du, Q., Deng, Y., Zhou, J., Wu, J., and Pang, Q. (2022b). Spatial spillover effect of carbon emission efficiency in the construction industry of China. ESPR 29 (2), 2466–2479. doi:10.1007/s11356-021-15747-9
Farrell, M. J. (1957). The measurement of productive efficiency. J. R. Stat. Soc. Ser. A Statistics Soc. 120 (3), 253–281. doi:10.2307/2343100
Feng, D., and Li, J. (2017). Research of the carbon dioxide emission efficiency and reduction potential of cities in the Beijing-Tianjin-Hebei Region. Res. Sci. 39, 978–986. doi:10.18402/resci.2017.05.17
Gao, P., Yue, S., and Chen, H. (2021). Carbon emission efficiency of China’s industry sectors: from the perspective of embodied carbon emissions. J. Clean. Prod. 283, 124655. doi:10.1016/j.jclepro.2020.124655
Grösche, P. (2009). Measuring residential energy efficiency improvements with DEA. J. Prod. Analysis 31, 87–94. doi:10.1007/s11123-008-0121-7
Guo, X. J., Wang, X., Wu, X. L., Chen, X. P., and Li, Y. (2022). Carbon emission efficiency and low-carbon optimization in Shanxi Province under“Dual Carbon”background. Energies 15, 2369–2414. doi:10.3390/en15072369
Hao, G., Wei, Q. L., and Yan, H. (2000). The generalized DEA model and the convex cone constrained game. J. Oper. Res. 126, 515–525. doi:10.1016/S0377-2217(99)00306-9
Huang, X., and Ling, N. X. (2020). A differential game model of government and enterprise emission reduction based on emission permits trading and subsidy for emission abatement. J. Sys. Manage. 29, 1150–1160. doi:10.3969/j.issn.1005-2542.2020.06.012
Jiang, P., Li, M. Y., Zhao, Y. T., Gong, X. J., Jin, R. F., Zhang, Y. H., et al. (2022). Does environmental regulation improve carbon emission efficiency? Inspection of panel data from inter-provincial provinces in China. SUSTAINABILITY-BASEL 14, 10448–10518. doi:10.3390/su141610448
Jin, B. L., Han, Y., and Kou, P. (2023). Dynamically evaluating the comprehensive efficiency of technological innovation and low-carbon economy in China's industrial sectors. Socio-Econ Plan. Sci. 86, 101480–101541. doi:10.1016/j.seps.2022.101480
Kaya, Y., and Yokobori, K. (1993). Global environment, energy, and economic development. Tokyo: Held at the United Nations University, 25–27.
Korhonen, P. J., and Siitari, P. A. (2009). A dimensional decomposition approach to identifying efficient units in large-scale DEA models. Comput. Oper. Res. 36, 234–244. doi:10.1016/j.cor.2007.09.010
Lee, W. S., and Kung, C. K. (2011). Using climate classification to evaluate building energy performance. Energy 36 (3), 1797–1801. doi:10.1016/j.energy.2010.12.034
Li, J., and Zhou, H. (2012). Correlation analysis of carbon emission intensity and industrial structure in China. China Popul. Res. Environ. 22, 7–14. doi:10.3969/j.issn.1002-2104.2012.01.003
Liang, L., Wu, J., Cook, W. D., and Zhu, J. (2008). The DEA game cross-efficiency model and its Nash equilibrium. Oper. Res. 56, 1278–1288. doi:10.1287/opre.1070.0487
Lieberman, E., Hauert, C., and Nowak, M. A. (2005). Evolutionary dynamics on graphs. Nature 433, 312–316. doi:10.1038/nature03204
Liu, W. B., Meng, W., Li, X. X., and Zhang, D. Q. (2010). DEA models with undesirable inputs and outputs. AOR 173, 177–194. doi:10.1007/s10479-009-0587-3
Lu, C. Y., Zhang, H. M., and Wen, F. (2020). The relationship between cultivated land change and economic development based on gis in henan province: AN empirical study. ISPRS Arch. 42, 1013–1024. doi:10.5194/isprs-archives-xlii-3-w10-1013-2020
Mielnik, O., and Goldemberg, J. (1999). Communication the evolution of the "carbonization index" in developing countries. Ener. Pol. 27, 307–308. doi:10.1016/S0301-4215(99)00018-X
Nakabayashi, K., and Tone, K. (2006). Egoist's dilemma: a DEA game. Omega 34, 135–148. doi:10.1016/j.omega.2004.08.003
Nowak, M. A., Bonhoeffer, S., and May, R. M. (1994). More spatial games. Int. J. Bifurcat. Chaos 4, 33–56. doi:10.1142/S0218127494000046
Nowak, M. A., and May, R. M. (1992). Evolutionary games and spatial chaos. Nature 359, 826–829. doi:10.1038/359826a0
Peng, L. Q. (2008). An empirical study on interregional industry linkages and the spillover——effect of economical growth from the perspective of regional input and output. J. Jishou Univ. 174, 62–68. doi:10.3969/j.issn.1004-910X.2008.04.018
Ramanathan, R. (2002). Combining indicators of energy consumption and CO<SUB align=right>2 emissions: a cross-country comparison. Int. J. Glob. Energy Issues. 17, 214–227. doi:10.1504/IJGEI.2002.000941
Ren, S., Hao, Y., and Wu, H. (2022). The role of outward foreign direct investment (OFDI) on green total factor energy efficiency: does institutional quality matters? Evidence from China. Resour. Polipy 76, 102587. doi:10.1016/j.resourpol.2022.102587
Shao, H., and Wang, Z. (2021). Spatial network structure of transportation carbon emission efficiency in China and its influencing factors. Chin. J. Popul. Resour. 19 (4), 295–303. doi:10.1016/j.cjpre.2022.01.002
Shen, C., Feng, R., Yu, B. B., and Liao, Z. Q. (2018). Industrial CO2 emissions efficiency and its determinants in China: analyzing differences across regions and industry sectors. Pol. J. Environ. Stud. 27, 1239–1254. doi:10.15244/pjoes/76794
Stretesky, P. B., and Lynch, M. J. (2009). A cross-national study of the association between per capita carbon dioxide emissions and exports to the United States. Soc. Sci. Res. 38, 239–250. doi:10.1016/j.ssresearch.2008.08.004
Sun, J. W. (2005). The decrease of CO2 emission intensity is decarbonization at national and global levels. Ener. Pol. 33, 975–978. doi:10.1016/j.enpol.2003.10.023
Wang, B., Yu, L. J., and Yang, Y. S. (2013a). Measuring and decomposing energy productivity of China's industries under carbon emission constraints. JFR 10, 128–141.
Wang, L., Song, X., and Song, X. (2021). Research on the measurement and spatial-temporal difference analysis of energy efficiency in China’s construction industry based on a game cross-efficiency model. J. Clean. Prod. 278, 123918. doi:10.1016/j.jclepro.2020.123918
Wang, L. L., Chen, L. Y., and Li, Y. S. (2022). Digital economy and urban low-carbon sustainable development: the role of innovation factor mobility in China. Sci. Pollut. Res. 29, 48539–48557. doi:10.1007/s11356-022-19182-2
Wang, M. Y., Liu, Y., and Yang, W. K. (2019). Research on the evolution game of regional cooperative emission reduction under environmental regulation. Cn. Manage. Sci. 27, 158–169. doi:10.16381/j.cnki.issn1003-207x.2019.02.016
Wang, P., Wu, W. S., Zhu, B. Z., and Wei, Y. M. (2013b). Examining the impact factors of energy-related CO2 emissions using the STIRPAT model in Guangdong Province, China. China Appl. Energ 106, 65–71. doi:10.1016/j.apenergy.2013.01.036
Wang, Q. W., Zhou, P., and Zhou, D. Q. (2010). Research on dynamic carbon dioxide emissions performance, regional disparity and affecting factors in China. China CFIE 1, 45–54. doi:10.1007/978-1-4419-7194-4_2
Wang, S., and Ma, Y. (2018). Influencing factors and regional discrepancies of the efficiency of carbon dioxide emissions in Jiangsu, China. Ecol. Indic. 90, 460–468. doi:10.1016/j.ecolind.2018.03.033
Wang, S. J., Liu, Y. Y., and Fang, C. L. (2015). Review of energy-related CO2 emission in response to climate change. Prog. Geog 34, 151–164. doi:10.11820/dlkxjz.2015.02.004
Wang, X. P., Shen, Y. S., and Su, C. (2023). Spatial and temporal heterogeneity of urban carbon emission efficiency and spillover effect in the Yellow River basin. Eco. Econ. 39, 1–20. doi:10.1016/j.egyr.2022.12.004 Avaliable at: http://qikan.cqvip.com/Qikan/Article/Detail?id=7109238940.
Wang, Z. Y. (2017). The empirical study on the relationship between energy consumption, carbon emissions and economic growth in beijing-tianjin-hebei. J. Ind. Tech. Econ. 36, 82–92. doi:10.3969/j.issn.1674-7089.2019.03.007
Wei, M., Cao, M. F., and Jiang, J. R. (2010). Long-term determination and convergence analysis of carbon emission efficiency in production. J. Quant. Tech. Econ. 27 (09), 43–52+81. doi:10.13653/j.cnki.jqte.2010.09.001
Wu, F. X., and Zhu, L. (2010). Industrial correlation and its spillover and feedback effects among three regions in China: an empirical study based on multi-regional input-output analysis technique. Nankai Econ. Res. 155, 140–152. doi:10.3969/j.issn.1001-4691.2010.05.011
Wu, J., Liang, L., and Chen, Y. (2009). DEA game cross-efficiency approach to Olympic rankings. Omega 37, 909–918. doi:10.1016/j.omega.2008.07.001
Wu, Y. Q., and Zhao, Y. N. (2014). Energy consumption, carbon emission and economic growth in the Beijing-Tianjin-Hebei Region. Econ. Manage. 28, 5–12. doi:10.3969/j.issn.1003-3890.2014.02.001
Xie, Z., Wu, R., and Wang, S. (2021). How technological progress affects the carbon emission efficiency? Evidence from national panel quantile regression. J. Clean. Prod. 307, 127133. doi:10.1016/j.jclepro.2021.127133
Xu, S. C., Xi, R., and He, Z. X. (2014). Factors that influence carbon emissions due to energy consumption in China: decomposition analysis using LMDI. Appl. Ener 127, 182–193. doi:10.1016/j.apenergy.2014.03.093
Xu, Y. Q., Cheng, Y., and Wang, J. J. (2023). The impact of green technological innovation on the spatiotemporal evolution of carbon emission efficiency of resource-based cities in China. Geogr. Res. 42, 878–894. doi:10.11821/dlyj020220256
Yamaji, K., Matsuhashi, R., Nagata, Y., and Kaya, Y. (1993). A study on economic measures for CO2 reduction in Japan. Ener. Pol. 21, 123–132. doi:10.1016/0301-4215(93)90134-2
Yongrok, C., Zhang, N., and Zhou, P. (2012). Efficiency and abatement costs of energy-related CO2 emissions in China: a slacks-based efficiency measure. Appl. Energ. 98, 198–208. doi:10.1016/j.apenergy.2012.03.024
Yu, Y. T., and Zhang, N. (2021). Low-carbon city pilot and carbon emission efficiency: quasi-experimental evidence from China. Energ. Econ. 96, 105125. doi:10.1016/j.eneco.2021.105125
Zeng, S. L., and Wang, M. L. (2023). Theoretical and empirical analyses on the factors affecting carbon emissions: case of Zhejiang Province, China. China. Environ. Dev. Sustain 25, 2522–2549. doi:10.1007/s10668-022-02148-2
Zhang, J., Wu, G. Y., and Zhang, J. P. (2004). The estimation of Chinas provincial capital stock: 1952-2000. Econ. Res. J. 10, 35–44.
Zhang, Z. Q., Qu, J. S., and Zeng, J. J. (2008). A quantitative comparison and analysis on the assessment indicators of greenhouse gases emission. J. Geogr. Sci. 18, 387–399. doi:10.1007/s11442-008-0387-8
Zhao, R. Q., Huang, X. J., and Peng, B. Z. (2012). Research on carbon cycle and carbon balance of Nanjing urban system. Acta Geogr. Sin. 67, 142–149. doi:10.11821/xb201206004
Zhou, P., Ang, B. W., and Han, J. Y. (2010). Total factor carbon emission performance: a Malmquist index analysis. Ener. Econ. 32, 194–201. doi:10.1016/j.eneco.2009.10.003
Keywords: Jing-Jin-Ji region, carbon emission efficiency, DEA, spatial game theory, competition and cooperation
Citation: Chen W, Chen X, Weng E, Dong Y, Sun Y and Zou L (2024) Competition or cooperation? Research on the spatial game relationship of regional carbon emission efficiency. Front. Energy Res. 11:1284436. doi: 10.3389/fenrg.2023.1284436
Received: 28 August 2023; Accepted: 07 December 2023;
Published: 25 January 2024.
Edited by:
Fei Ding, National Renewable Energy Laboratory (DOE), United StatesCopyright © 2024 Chen, Chen, Weng, Dong, Sun and Zou. This is an open-access article distributed under the terms of the Creative Commons Attribution License (CC BY). The use, distribution or reproduction in other forums is permitted, provided the original author(s) and the copyright owner(s) are credited and that the original publication in this journal is cited, in accordance with accepted academic practice. No use, distribution or reproduction is permitted which does not comply with these terms.
*Correspondence: Xiangtang Chen, Y2hlbnhpYW5ndGFuZ0B3enV0LmVkdS5jbg==