- 1State Grid Shandong Electric Power Company, Jinan, Shandong, China
- 2Distribution Technology Center, Shandong Smart Grid Technology Innovation Center, State Grid Shandong Electric Power Research Institute, Jinan, Shandong, China
With the large-scale integration of distributed renewable energy into low-voltage distribution station areas, rapidly growing services put forward new requirements on transparent monitoring. In order to accurately and objectively quantify the transparency of various distribution station areas and measure the impact of different dimensional indexes on the transparency evaluation of distribution station areas, this paper proposes a confidence relative off-target distance-based multi-dimensional transparency evaluation method. First, a multi-dimensional transparency evaluation index system with electrical and communication integration is constructed. Second, an improved gray target model combining both positive and negative target vectors is established to realize bi-directional quantitative analysis. Then, the relative off-target distance is calculated based on the endowment coefficient by leveraging both subjective and objective weights. Finally, the confidence of the relative off-target distance is calculated based on fuzzy entropy to improve the reliability of transparency evaluation. The simulation results show that this method can effectively distinguish the transparency gap between different distribution station areas, identify the single dimensional index with the greatest contribution or potential, and verify the effectiveness of the proposed method applied to the transparency evaluation of distribution station areas.
1 Introduction
A low-voltage distribution station area is the “last mile” of a smart grid to connect users, which is also the core of reliable power supply guarantee (Noh et al., 2018; Wu et al., 2022). Transparent monitoring in the distribution station area can ensure the safe and stable operation of the power system, improve the operational efficiency of the power system, and reduce energy waste and operating costs (Hu et al., 2022; Liu et al., 2022). At the same time, transparent monitoring can also increase the reliability and sustainability of the power system, improve users’ electricity experience, and ensure the electricity demand of all sectors of society. With the large-scale integration of distributed renewable energy into low-voltage distribution station areas, advanced services such as power quality analysis (Elphick et al., 2017; Harirchi and Simões, 2018; Lei et al., 2022), reactive power compensation monitoring (Kavousi-Fard et al., 2017; Liang and Zhu, 2018), distributed photovoltaic (PV) control (Haghdadi et al., 2018; León et al., 2022), and electric vehicle charging (Rezaei et al., 2018; Hu et al., 2021) have grown rapidly. These services require the collection of a large volume of data including voltage, current, active power, reactive power, temperature, sunlight intensity, and wind speed, which puts forward new requirements on transparent monitoring of distribution station areas (Liao et al., 2022). Therefore, how to accurately and objectively quantify the transparency of various distribution station areas to support the rational planning and deployment of monitoring devices has become an important research topic for smart grid construction (Vai et al., 2020; Zichang et al., 2021).
There exist some works investigating the performance evaluation of distribution station areas. Commonly used existing evaluation methods are the analytic hierarchy process (AHP), fuzzy analytic hierarchy process (FAHP), and entropy method. Bernardon et al. (2011) proposed an AHP-based evaluation method for a device configuration scheme to effectively support the operation planning of low-voltage distribution station areas. However, the AHP can hardly reflect the ambiguity of subjective judgment. It is difficult to guarantee the consistency of the judgment matrix of the AHP under a large number of evaluation indices. Dehghanian et al. (2012) proposed a FAHP-based performance evaluation method to assess various types of components of monitoring devices in low-voltage distribution station areas. Wang et al. (2018) proposed an electricity-user evaluation method in smart electricity utilization by integrating the entropy method and AHP. Liang et al. (2022) proposed a governance effect evaluation model of power quality in distribution station areas based on the fuzzy comprehensive evaluation method, which uses the comprehensive weighting method combined with the AHP and entropy weight coefficient method to determine the index weight. The above works are only applicable to the performance evaluation of a single station area because the calculation process is very complicated, and the confidence degree of the evaluation results is ignored. It is difficult to directly reflect the gap between the current evaluation scenario and the target scenario due to the bias for a certain evaluation index.
The gray target model can comprehensively integrate the multi-layer decision information to provide the low-complexity and accurate evaluation of numerous distribution station areas in complex decision-making (Zhengxin et al., 2009; Ma et al., 2020; Sun and Fang, 2021). It constructs a standard ideal vector by searching for the optimal value in the evaluation index vector. The off-target distance is calculated, and the transparency evaluation of various distribution station areas is achieved based on the comparison between the differentiated evaluation index vectors and the standard ideal vector. Although the gray target model has demonstrated great potential in transparency evaluation, there still exist some major technical challenges, which are introduced in the following paragraphs.
First, traditional gray target models only consider the unidirectional target distance, resulting in the severe loss of important evaluation information and poor evaluation accuracy. Moreover, the key factors affecting transparency evaluation cannot be effectively distinguished due to the lack of differentiated index treatment. Second, the traditional gray target model does not measure the confidence level of the off-target distance, which leads to poor authenticity of the evaluation results. The lack of confidence level measurement cannot reflect the gap between the evaluation scenario and the target scenario. Finally, existing transparency evaluation index systems do not contain integrated electrical and communication criteria. They mostly focus on electrical and electric energy quantities but ignore the quantities of the state, control, and event. The various indices related to new services such as PV monitoring, electric vehicle-charging pile monitoring (Zhou et al., 2023), and the failure rate of these mentoring devices have been largely neglected for the sake of simplicity.
The gray target model has been widely used for performance evaluation in distribution network. Zhang et al. (2012) used the gray target model to evaluate the economic performance of a 20-KV distribution network. Chen et al. (2020) proposed a gray target model-based evaluation framework to assess the performance of distribution network reconfiguration. However, a traditional gray target model only considers the positive target distance. The evaluation result can only reflect the unidirectional tendency between the evaluation candidate and the target, which causes the loss of key information on the bi-directional tendency for accurate transparency evaluation. The technique for order preference by similarity to an ideal solution (TOPSIS) can be used to improve the gray target model by adding a negative target distance to an existing positive target distance. Yin et al. (2021) proposed a two-way evaluation method based on the TOPSIS for an electric vehicle-charging station deployment scheme to maximize mutual benefits of electric vehicle aggregators and owners. Zhang et al. (2021) constructed a comprehensive evaluation model based on the AHP-TOPSIS for PV energy storage plants in AC–DC distribution networks. Zhang and Zhang (2022) proposed an index system for factors affecting the balance rate of distribution station areas based on the coefficient of variation and gray relational evaluation model. However, the above methods have not considered the measurement of confidence levels of a bi-directional off-target distance. A small confidence of transparency evaluation reflects that the probability of the true value falling within the confidence interval is low. In addition, these works have not considered the integration between the electrical and communication criteria in transparency evaluation. The key indices related to newly emerged services such as PV monitoring and electric vehicle-charging pile monitoring are not investigated, which makes them difficult to apply for distribution station areas with a high percentage of distributed PV and electric vehicle penetration.
Faced by these challenges, we propose a confidence relative off-targets distance-based multi-dimensional transparency evaluation method. First, we establish a multi-dimensional transparency evaluation index system, including the target layer, criterion layer, and index layer. Second, we propose an improved gray target model combining positive and negative target vectors to quantify the target distance between the transparency status vectors of different distribution station areas and the positive and negative target vectors. Then, the relative off-target distance is calculated based on the endowment coefficient by leveraging both subjective and objective weights. Finally, the confidence of the relative off-target distance is calculated based on the fuzzy entropy to improve the reliability of transparency evaluation. The key evaluation indices that affect the transparency of distribution station areas are analyzed based on a single-dimensional relative off-target distance. The contributions are summarized in the following paragraphs.
Improved gray target model considering positive and negative target vectors: Using the TOPSIS, we propose the improved gray target model considering positive and negative target vectors to realize the two-way quantitative analysis of distances between the transparency status vector and the two target vectors. The accuracy of transparency evaluation is also significantly improved by reducing the loss of key information on the unidirectional tendency.
Confidence relative off-target distance-based transparency evaluation: On the basis of the single-dimensional relative off-target distances, we utilize the fuzzy entropy to calculate the confidence level of transparency evaluation results to improve evaluation authenticity. The confidence and relative off-target distance are further combined based on the preferences of decision-making to improve the estimation accuracy.
Electrical and communication-integrated multi-dimensional transparency evaluation index system: We construct an electrical and communication-integrated multi-dimensional transparency evaluation index system. Electrical indices related to PV monitoring and electric vehicle monitoring are combined with communication indices such as delay, throughput, and link utilization to provide better adaptability with new services and guarantee the objectivity and accuracy of transparency evaluation.
The proposed method can measure the influence of different dimensional indices on the transparency evaluation of the distribution station area and accurately and reliably evaluate the transparency of each distribution station area. This enables the timely identification of potential problems in low-voltage distribution station areas with low transparency, thereby providing a reliable guarantee for the power services.
The rest of the paper is organized as follows: Section 2 introduces the multi-dimensional transparency index system. Section 3 elaborates the improved gray target model based on positive and negative targets. The proposed confidence relative off-target distance-based multi-dimensional transparency evaluation method is developed in Section 4. The simulation results are presented in Section 5. Section 6 concludes the paper.
2 Multi-dimensional transparency index system of the distribution station area
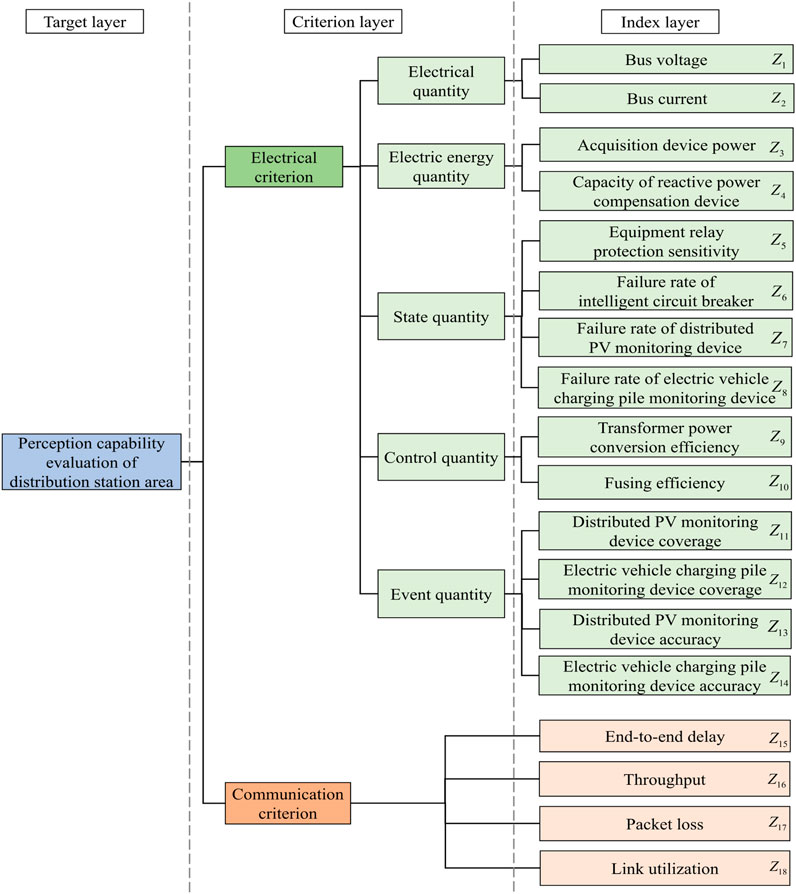
This paper considers the influence of multi-dimensional factors on the transparency evaluation of distribution station areas and constructs a multi-dimensional transparency evaluation index system, as shown in Figure 1. The index system consists of three layers, namely, the target layer, criterion layer, and index layer, which are elaborated in the following paragraphs.
2.1 Target layer
The purpose of constructing the index system is to evaluate the transparency of the distribution station area. The target layer of the index system is defined as the transparency evaluation of the distribution station area.
2.2 Criterion layer
The criterion layer is mainly considered from two dimensions: electrical criterion and communication criterion. The electrical criterion can be specifically divided into five sub-criteria, namely, the electrical quantity, electric energy quantity, state quantity, control quantity, and event quantity.
2.3 Index layer
The indices contained in the index layer support the criterion and sub-criterion of the criterion layer, which are elaborated in the following paragraphs.
2.3.1 Indices of the electrical quantity sub-criterion
The electrical quantity sub-criterion reflects the basic characteristics of the distribution station area, which includes two indices: bus voltage Z1 and bus current Z2.
1) Z1 represents the voltage on the main power line in the power supply system, which usually refers to the voltage output by a transmission line of the substation.
2) Z2 represents the current transmitted through the bus.
These indices can be measured directly and do not require further calculation.
2.3.2 Indices of the electric energy quantity sub-criterion
The electric energy quantity sub-criterion is used to describe the power quality of the distribution station area, which includes two indices: acquisition device power Z3 and the capacity of the reactive power compensation device Z4.
1) Z3 represents the electric energy consumed using the acquisition device per unit time.
2) Z4 indicates the total capacity of the reactive power compensation device. The reactive power compensation of the distribution station area is mainly based on the low-voltage centralized compensation, and the high-voltage compensation is utilized as an auxiliary.
These indices can be measured directly or prescribed by the system and do not require further calculation.
2.3.3 Indices of the state quantity sub-criterion
The state quantity sub-criterion is used to describe the state of the distribution station area, which includes four indices: equipment relay protection sensitivity Z5, the failure rate of the intelligent circuit breaker Z6, the failure rate of the distributed photovoltaic (PV) monitoring device Z7, and the failure rate of the electric vehicle-charging pile monitoring device Z8.
1) Z5 represents the capability of the relay protection device to detect and judge the fault signal. Higher sensitivity represents the faster detection of the fault signal of the relay protection device (Liao et al., 2021). Taking appropriate protective measures in time can effectively reduce the damage to the device. Z5 can be calculated as
where I1 and I2 are the currents of the high-voltage side and the low-voltage side, respectively. Ig is the inflection point current. Imin is the minimum operating current. K is the slope of the ratio restrain characteristic.
2) Z6 depends on the specific product model and manufacturer. In general, a good quality intelligent circuit breaker has a low failure rate and can provide stable and reliable power protection. Different designs and manufactures lead to the difference in the failure rate of intelligent circuit breakers. Considering the distribution station area, Z6 can be calculated as
where A is the curvature coefficient. H is the health parameter.
The calculation of Z7 and Z8 is similar to Eq. 2.
2.3.4 Indices of the control quantity sub-criterion
The control quantity sub-criterion is used to describe the control efficiency of the distribution station area, which includes two indices: the transformer power conversion efficiency Z9 and fusing efficiency Z10.
1) Z9 represents the power conversion efficiency achieved by the transformer when converting the electrical energy from one voltage level to another.
2) Z10 represents the capability of the fuse to quickly cut off the circuit and protect the electrical equipment in the event of overload or short-circuit.
These two indices can be obtained by simple measurement or inspection and do not require further calculation.
2.3.5 Indices of the event quantity sub-criterion
The event quantity sub-criterion is used to describe the coverage and accuracy of major operations, which includes four indices: the distributed PV monitoring device coverage Z11, electric vehicle-charging pile monitoring device coverage Z12, distributed PV monitoring device accuracy Z13, and electric vehicle-charging pile monitoring device accuracy Z14.
1) Z11 depends on the design and installation of the distributed PV monitoring device. In general, distributed PV monitoring devices can cover the entire power generation system of PV power stations. Considering the distribution station area, distributed PV monitoring device coverage Z11 can be calculated as
where Aov is the total area of the distributed PV actually monitored by the distributed PV monitoring device. Aact is the total area of distributed PV.
The calculation of Z12 is similar to Eq. 3.
2) Z13 is calculated by using the Weibull distribution to fit the accuracy curve of the distributed PV monitoring device, i.e.,
where t is the operating time of the distributed PV monitoring device. θ is the characteristic parameter, which magnifies and shrinks the function curve and reflects the average monitoring error time interval of the monitoring device. α is the shape parameter, reflecting the basic shape of the accuracy distribution function.
The calculation of Z14 is similar to Eq. 4.
2.4 Indices of the communication criterion
Communication indices assist in the transparency evaluation of distribution station areas from the perspective of communication performance, which consist of end-to-end delay Z15, throughput Z16, packet loss Z17, and link utilization Z18.
1) Z15 indicates the total time it takes for data to be sent from the source node to the destination node.
2) Z16 indicates the amount of data successfully transmitted per unit time.
3) Z17 indicates the proportion of packets that are lost during data transmission.
4) Z18 indicates the ratio of the time a network link is actually used to the total time.
These communication indices can be easily obtained using communication monitoring tools and do not require further calculation.
3 Improved gray target model based on positive and negative targets
The transparency evaluation of the distribution station area is a complex system decision problem that encompasses multiple dimensions and indices. First, we construct a vector space based on the multi-dimensional transparency index system. The index system that is composed of N indices constitutes the N-dimensional evaluation space Z = [Z1, … , Zn, … , ZN].
There are M distribution station areas with varying resource endowments to be evaluated, and the evaluation vector representing different distribution station areas is denoted as S = [S1, … , Sm, … , SM]. The transparency evaluation space matrix AS, which includes all the distribution station areas requiring evaluation, can be defined as
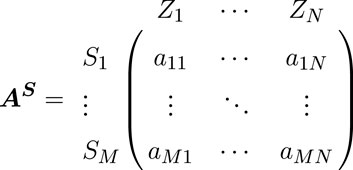
where amn is the index value of the distribution station area Sm on the dimension Zn. The mth row represents the state vector of the distribution station area Sm in the evaluation space, denoted as am = [am1, … , amn, … , amN].
The gray target model can synthesize multi-level decision-making information and evaluate the level of each scheme in complex decision-making problems. Therefore, we use the gray target model to evaluate and analyze the transparency evaluation of the distribution station area. The gray target model takes the ideal scenario as the target, compares different evaluation objects with the target, and quantifies the deviation between the evaluation object and the target. We define the positive target vector as a+, which is formed by the target values of each dimension index. The distribution station areas gradually evolve from their current state vector ai toward the positive target vector a+, indicating a unidirectional positive trend.
The traditional gray target model only considers the unidirectional target distance, which leads to the loss of evaluation information and inaccurate evaluation. The TOPSIS takes the negative target distance into account on the basis of the positive evaluation. By incorporating the TOPSIS into the gray target model, we can enhance its performance (Madavan, 2020; Zhang, 2021). In addition to setting the positive target vector, we can introduce a negative target vector for comparative analysis and create a reverse reference scenario for the distribution station area Sm. In the process of transparency evaluation of the distribution station area, the current state vector of the distribution station area will deviate from the negative target vector a−. Therefore, by considering the negative target vector, we can assess the reversed trend of the distribution station area toward the reverse reference scenario.
The improved gray target model including positive and negative target vectors and transparency state vectors of all distribution station areas is constructed. The positive target vector a+ and negative target vector a− can be represented as
In the process of the transparency evaluation of the distribution station area, in order to avoid the decrease in the evaluation accuracy caused by different dimensions of each index, it is necessary to perform gray target transformation on the spatial axis, i.e., T (amn) = bmn, which is formulated as
where
In summary, the gray target model is improved by considering both positive and negative target vectors. The model can precisely reflect the tendency of the current state vector of the distribution station area. Based on the positive and negative target vectors, we can establish an improved gray target model B, which is formulated as
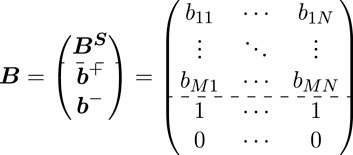
The positive target distance
The positive and negative target distances,
4 Confidence relative off-targets distance-based transparency evaluation
As shown in Figure 2, we propose a confidence relative off-target distance-based multi-dimensional transparency evaluation method. First, the endowment coefficient of each distribution station area is calculated based on the subjective weight and objective weight. Second, the relative off-target distance is calculated by combining the endowment coefficient. Then, the confidence of transparency evaluation can be measured based on the fuzzy entropy, and the confidence relative off-target distance can be calculated. Finally, a transparency evaluation mapping criterion is constructed to realize the transparency evaluation of the distribution station area combined with the confidence relative off-target distance. The specific transparency evaluation process is described in the following paragraphs.
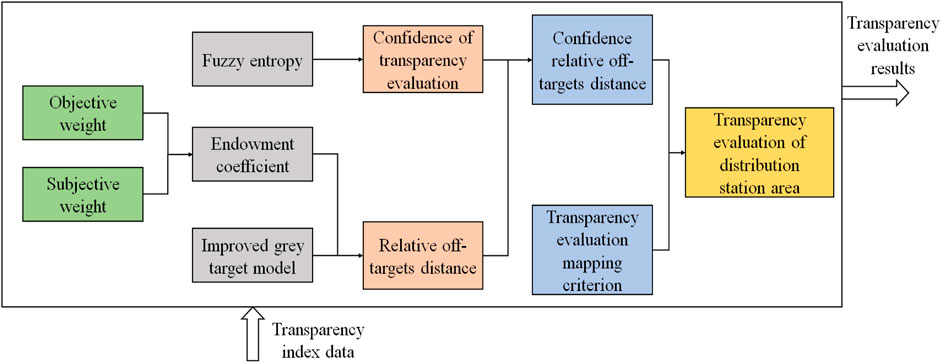
FIGURE 2. Diagram of the confidence relative off-target distance-based transparency evaluation method.
4.1 Assignment of the endowment coefficient
The entropy weight method (EWM) identifies objective information in data through the calculation of entropy (Jiayi et al., 2022), while the FAHP considers decision-making experience to establish judgment matrices (Mansouri, 2019; Ramanayaka, 2019). We combine the advantages of both methods to integrate subjective and objective information. Based on the integration of subjective information and objective information, we can calculate the endowment coefficients of various dimension indicators, quantifying the resource endowment disparities in the distribution station areas requiring evaluation.
First, based on the improved EWM, the entropy Hn that represents the importance of the evaluation indices can be calculated as
where 1 + bmn is used to prevent the entropy value of the indicator from becoming excessively large and losing its value.
The objective weights are defined as
The subjective weights are defined as
The range of ωn is [0,1], and a larger value of ωn represents a greater impact on the transparency evaluation of the distribution station area Sn.
4.2 Calculation of the confidence relative off-targets distance
Each dimension index has different influences on the transparency evaluation of the distribution station area (Zhang et al., 2023). If index Zn has a higher weight value, the change in this index will result in a larger change in the positive target distance
To comprehensively assess the transparency evaluation of the distribution station area, it is necessary to consider both
The range of values for the relative off-target distance Cm is [0,1]. A value closer to 0 indicates that Wbm is closer to Wb− and farther from Wb+, implying a lower transparency performance of the distribution station area.
To effectively measure the impact of a single-dimension index on the transparency evaluation of the distribution station area, we introduce the concept of the relative off-target distance for a single dimension index. First, the weighted positive target distance
The relative off-target distance for a single dimension index can be represented as
Based on the relative off-target distance for each dimension of the distribution station area, further analysis can be conducted to evaluate the transparency and identify key indices that influence the transparency evaluation of the distribution station area.
Entropy is a measure of uncertainty in information theory. With the development of the fuzzy theory, the application of entropy in fuzzy sets is called fuzzy entropy, which reflects the degree of fuzziness of a fuzzy set (Liu et al., 2020; Zheng et al., 2021). When the multi-dimensional transparency index system is used to evaluate the transparency of the distribution station area, if there is a large difference between the relative off-target distance of each transparency evaluation index, the transparency status of the distribution station area is difficult to be reflected by the relative off-target distance, and the transparency evaluation result has a small confidence. Therefore, we utilize the fuzzy entropy to measure the confidence of the transparency evaluation of the distribution station area. The confidence φm of the transparency evaluation of the distribution station area Sm is defined as
where η is the standardized coefficient and is given by
δ is the number of distribution station area transparency evaluation levels.
The range of the confidence φm is [0,1]. When φm approaches 0, it indicates the lower confidence of the transparency evaluation result, which means that the probability of the true transparency evaluation value falling within the confidence interval is low. Conversely, when φm approaches 1, it indicates higher confidence of the transparency evaluation result, which means that the probability of the true transparency evaluation value falling within the confidence interval is high.
After the calculation of the relative off-target distance Cm and confidence φm, we combine them to calculate the confidence relative off-target distance, which can be represented as
The value of ϖ is based on the preferences of the ultimate decision-maker regarding the overall evaluation results of the distribution station area and the influence of individual dimension indices.
4.3 Transparency evaluation of the distribution station area
Based on the confidence relative off-target distance Qm ∈ [0, 1], we can realize the transparency evaluation of the distribution station area. When Qm approaches 0, it indicates a poor transparency level of the distribution station area. Conversely, when Qm approaches 1, it indicates a higher transparency level of the distribution station area. To achieve an accurate transparency evaluation of the distribution station area, we divide the transparency level of the distribution station area into five levels: poor, relatively poor, moderate, good, and excellent. The values of Qm corresponding to different transparency levels are shown in Table 1. The values of κ1, κ2, κ3, κ4, κ5, and κ6 can be flexibly set, according to the actual situation of the distribution station area. Based on Table 1, we can map the confidence relative off-target distance Qm of the distribution station area to the above five transparency levels to realize transparency evaluation.
The implementation procedures of the proposed confidence relative off-target distance-based transparency evaluation algorithm are summarized in Algorithm 1.
Algorithm 1. The proposed confidence relative off-target distance-based multi-dimensional transparency evaluation algorithm.
1: Improved gray target model:
2: The evaluation space is constructed based on the multi-dimensional transparency index system.
3: The positive target vector a+ and the negative target vector a− are set based on (6).
4: A multi-dimensional gray target model BS is established based on (7).
5: An improved gray target model B is established based on (8).
6: The positive target distance
7: Assignment of the endowment coefficient:
8: 1 − Hn is calculated based on (10).
9: The objective weight λn is calculated based on (11), and the subjective weight μn is calculated based on the FAHP.
10: The endowment coefficient ωn is calculated based on (12).
11: Calculation of the confidence relative off-target distance:
12: The weighted positive target distance
13: The relative off-target distance Cm is calculated based on (14).
14: The weighted positive target distance
15: The relative off-target distance for a single-dimension index is calculated based on (16).
16: The confidence φm is calculated based on (17) and 18.
17: The confidence relative off-target distance Qm is calculated based on (19).
18: Transparency evaluation of the distribution station area:
19: The transparency evaluation of the distribution station area is realized based on Table 1.
5 Example of the transparency evaluation of the distribution station area
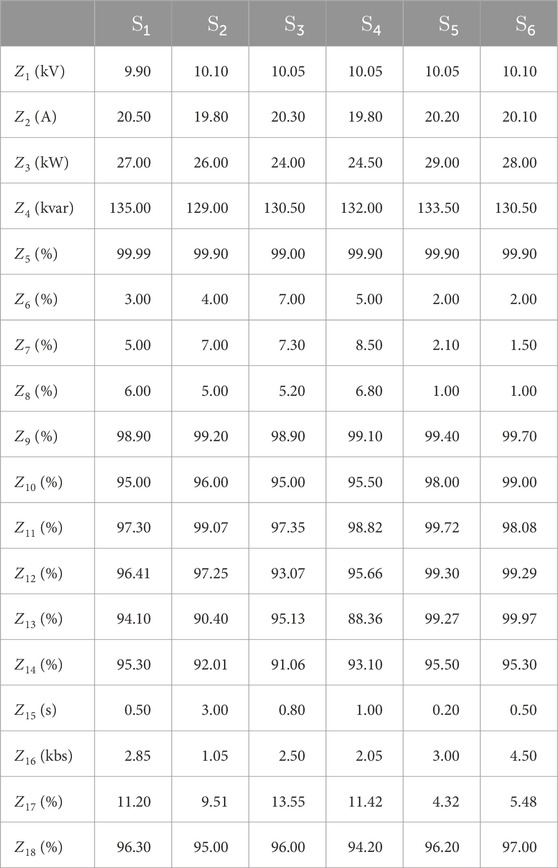
We select six distribution station areas, S1–S6, in Shandong Province, China, for the transparency evaluation of distribution station areas to verify the proposed method. The distribution station areas S1–S2 are located in the commercial districts, the distribution station areas S3–S4 are located in the residential districts, and the distribution station areas S5–S6 are located in the industrial districts. Compared with the distribution station area in the industrial districts, the loads of distribution station areas located in the commercial and residential districts are relatively smaller. The power supply radius of S1–S2 is approximately 200 m. The coverage rates of distributed PV monitoring devices are 97.30% and 99.07%, respectively, and the coverage rates of electric vehicle-charging pile monitoring devices are approximately 96.41% and 97.25%, respectively. The power supply radius of S3–S4 is approximately 150 m. The coverage rates of distributed PV monitoring devices are 91.52% and 90.24%, respectively, and the coverage rates of electric vehicle-charging pile monitoring devices are approximately 93.61% and 96.21%, respectively. The power supply radius of S5–S6 is approximately 500 m. The coverage rates of distributed PV monitoring devices are 99.72% and 98.08%, respectively, and the coverage rates of electric vehicle-charging pile monitoring devices are approximately 99.30% and 99.29%, respectively. In addition, the distribution station areas S5–S6 are upgraded, and their levels of informatization and automation are relatively high.
To achieve the transparency evaluation of the distribution station area, the evaluation index Z = [Z1, Z2, … , Z18] based on statistical data collected from the distribution station area has been established. Table 2 shows the transparency evaluation space for distribution station areas S1–S6.
To describe the differences in the transparency evaluation of different distribution station areas based on various dimensional indices, the endowment coefficient matrix W needs to be calculated. First, we consider the rationality of concrete data, and the positive target vector a+ and negative target vector a− can be set as shown in (20). Then, based on (7), by applying the gray target transformation to transparency evaluation space AS, as shown in Table 2, a multi-dimensional gray target model

Simultaneously, by performing a transformation on a+ and a−, we obtain the standard vectors b+ = [1, 1, … , 1] and b− = [0, 0, … , 0]. To sum up, the improved gray target model B is constructed as (21).
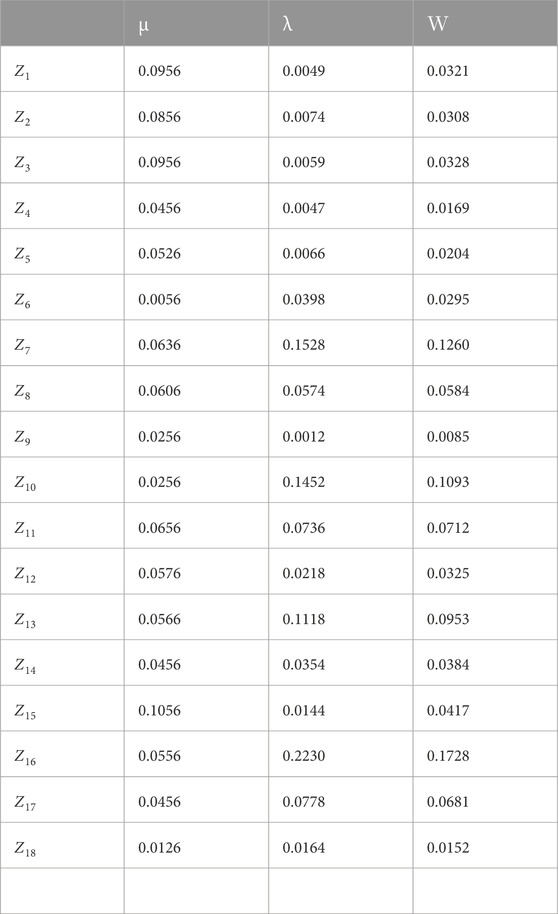
The subjective weight U is obtained using the FAHP. Taking Z1 as an example, the subjective weight μ1 is defined as 0.0956. The objective weight L is obtained by using the EWM through (11). The objective weight λ1 is calculated, and the result is 0.0049. By comprehensively considering the subjective weight and objective weight, the endowment coefficient W is calculated based on (12). The endowment coefficient W for Z1 is calculated, and the result is 0.0321. Finally, the subjective weight, objective weight, and endowment coefficient of each evaluation index are obtained, as shown in Table 3.
Then, based on the obtained endowment coefficients, the weighted positive and negative target distances of each distribution station area, as well as the relative off-targets distance, can be calculated based on Eqs 13, 14.
Taking S1 as an example, in this case, parameter m is 1. Based on Eq. 13, the weighted positive target distance of S1 is calculated as
Similarly, the weighted negative target distance of S1 is calculated as
Afterward,
The full results are shown in Table 4.
Then, the confidence level φm of the relative off-target distance can be calculated based on (15), (16), and (Eqs 17, 18).
According to Table 1, this paper divides the transparency evaluation results into five levels, i.e., δ = 5. Eq. 18 becomes
Based on Eq. 17, the confidence level is obtained as
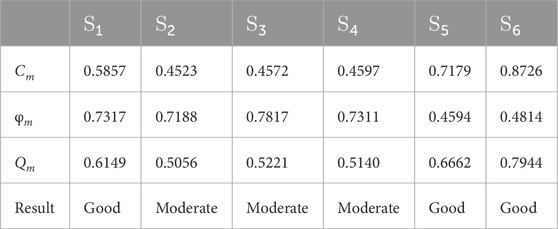
where C1n can be obtained from Eq. 15 and Eq. 16. For the convenience of subsequent calculation, the values of Cm and φm are also shown in Table 5.
Based on the obtained Cm and φm, the confidence relative off-target distance Qm can be calculated based on Eq. 19. In this paper, the parameter ϖ in Eq. 19 is set as 0.8. Q1 is calculated as
The full results of the confidence relative off-target distance are shown in Table 5.
Finally, the transparency evaluation of the distribution station area can be realized based on Table 1. In this paper, κ1 = 0.00, κ2 = 0.20, κ3 = 0.40, κ4 = 0.60, κ5 = 0.80, and κ6 = 1.00. Combined with Table 1, the transparency evaluation results are shown in Table 5.
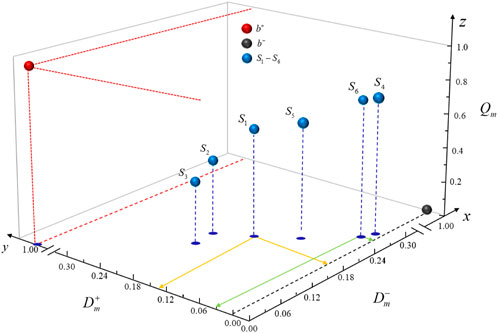
As shown in Figure 3, the transparency evaluation results of the six distribution station areas are given according to Table 5. The y-axis shown in Figure 3 represents the positive target distance, the x-axis represents the negative distance, and the z-axis represents the confidence relative off-target distance. In order to enhance the readability of the graph, we set breaks in the 0.3–1.0 part of the x-axis and y-axis. The red sphere represents the standard positive target vector, the black sphere represents the standard negative target vector, and the blue sphere represents the transparency evaluation status vector (
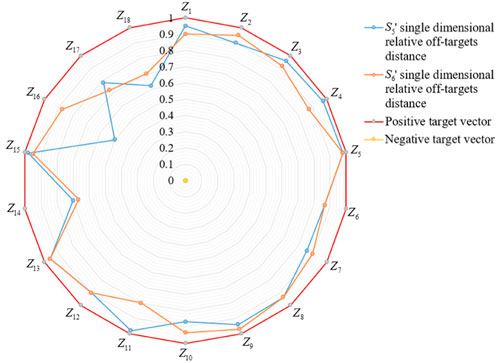
As shown in Figure 4, the analysis of the single-dimension relative off-target distance of distribution station areas S5 and S6 in 18 indices is given. The vertices of the red polygon and the yellow polygon represent the positive and negative target vectors of the single dimension of each index, respectively. In addition, the vertices of the blue polygon and the orange polygon represent the single-dimension relative off-target distance of each index of the distribution station areas S5 and S6, respectively.
For the distribution station area S5, the single-dimension vector of equipment relay protection sensitivity, distributed PV monitoring device coverage, and end-to-end delay is closest to the positive target vector, and the deviation from the negative target vector is the largest, indicating that these three indices have the greatest contribution to the transparency of the distribution station area S5. The single dimension of throughput is smaller than other indices, indicating that it has the greatest potential for transparency improvement in this dimension. In addition, for the distribution station area S6, the relative off-target distance of the single dimension of equipment relay protection sensitivity is the largest, indicating that the equipment relay protection sensitivity has the greatest contribution to the transparency. The single-dimension relative off-target distance of the electric vehicle-charging pile monitoring device accuracy of the distribution station area S6 is the smallest, indicating that the electric vehicle-charging pile monitoring device accuracy has the greatest potential for the improvement of the transparency of the distribution station area S6.
6 Conclusion
In this paper, a multi-dimensional transparency evaluation method based on the confidence relative off-target distance is proposed to analyze and evaluate the transparency of distribution station areas. First, the proposed method constructs a multi-dimensional transparency evaluation index system with electrical and communication integration, ensuring the objectivity of transparency evaluation. Second, by combining positive and negative target vectors, the proposed method overcomes the unidirectional tendency problem of the conventional gray target model, reducing the loss of key information and significantly improving the accuracy of transparency evaluation. Finally, the reliability and accuracy of transparency evaluation are further improved based on the different endowment coefficients and confidence calculation. The simulation results show that the proposed method can effectively distinguish the transparency gap and identify the single dimension of the index with the greatest contribution or potential. This enables the timely identification of potential problems in low-voltage distribution station areas with low transparency, thereby providing a reliable guarantee for power services. In the future, we will carry out further study on transparency evaluation from the perspective of integration of the information flow, energy flow, service flow, and value flow.
Data availability statement
The original contributions presented in the study are included in the article/Supplementary Material; further inquiries can be directed to the corresponding author.
Author contributions
JR: writing–original draft and writing–review and editing. LL: writing–original draft and writing–review and editing. SL: writing–original draft and writing–review and editing. ML: writing–original draft. MF: writing–original draft and writing–review and editing. SZ: writing–review and editing. WL: writing–review and editing. YL: writing–review and editing. HY: writing–review and editing.
Funding
The author(s) declare financial support was received for the research, authorship, and/or publication of this article. This work was supported by the Science and Technology Project of the State Grid under grant number 520600230011.
Conflict of interest
Authors JR, ML, and MF were employed by State Grid Shandong Electric Power Company.
The remaining authors declare that the research was conducted in the absence of any commercial or financial relationships that could be construed as a potential conflict of interest.
Publisher’s note
All claims expressed in this article are solely those of the authors and do not necessarily represent those of their affiliated organizations, or those of the publisher, the editors, and the reviewers. Any product that may be evaluated in this article, or claim that may be made by its manufacturer, is not guaranteed or endorsed by the publisher.
References
Bernardon, D. P., Sperandio, M., Garcia, V. J., Canha, L. N., Abaide, A. d. R., and Daza, E. F. B. (2011). Ahp decision-making algorithm to allocate remotely controlled switches in distribution networks. IEEE Trans. Power Deliv. 26, 1884–1892. doi:10.1109/TPWRD.2011.2119498
Chen, Q., Wang, W., Wang, H., Wu, J., Li, X., and Lan, J. (2020). A social beetle swarm algorithm based on grey target decision-making for a multiobjective distribution network reconfiguration considering partition of time intervals. IEEE Access 8, 204987–205013. doi:10.1109/ACCESS.2020.3036898
Dehghanian, P., Fotuhi-Firuzabad, M., Bagheri-Shouraki, S., and Razi Kazemi, A. A. (2012). Critical component identification in reliability centered asset management of power distribution systems via fuzzy ahp. IEEE Syst. J. 6, 593–602. doi:10.1109/JSYST.2011.2177134
Elphick, S., Gosbell, V., Smith, V., Perera, S., Ciufo, P., and Drury, G. (2017). Methods for harmonic analysis and reporting in future grid applications. IEEE Trans. Power Deliv. 32, 989–995. doi:10.1109/TPWRD.2016.2586963
Haghdadi, N., Bruce, A., MacGill, I., and Passey, R. (2018). Impact of distributed photovoltaic systems on zone substation peak demand. IEEE Trans. Sustain. Energy 9, 621–629. doi:10.1109/TSTE.2017.2751647
Harirchi, F., and Simões, M. G. (2018). Enhanced instantaneous power theory decomposition for power quality smart converter applications. IEEE Trans. Power Electron. 33, 9344–9359. doi:10.1109/TPEL.2018.2791954
Hu, J., Xu, X., Zheng, T., Lan, H., Cao, D., and Liu, G. (2021). Experimental study of radiated magnetic field from electric vehicle wireless charging system. IEEE Electromagn. Compat. Mag. 10, 46–51. doi:10.1109/MEMC.2021.9705225
Hu, R., Shang, L., Ma, N., Huang, Z., and Ou, M. (2022). “Research on the low-voltage governance and evaluation method for new distribution system based on the digital twin,” in Proceedings of the 2022 Power System and Green Energy Conference (PSGEC), Shanghai, China, August 2022, 806–813.
Jiayi, L., Anqi, C., and Xiangyuan, L. (2022). “Power load feature identification and prediction based on structural entropy weight method and improved bayesian algorithm,” in Proceedings of the 2022 IEEE 5th International Conference on Automation, Electronics and Electrical Engineering (AUTEEE), Shenyang, China, November 2022, 555–559.
Kavousi-Fard, A., Khosravi, A., and Nahavandi, S. (2017). Reactive power compensation in electric arc furnaces using prediction intervals. IEEE Trans. Ind. Electron. 64, 5295–5304. doi:10.1109/TIE.2017.2677345
Lei, M., Zhao, C., Li, Z., and He, J. (2022). Circuit dynamics analysis and control of the full-bridge five-branch modular multilevel converter for comprehensive power quality management of cophase railway power system. IEEE Trans. Ind. Electron. 69, 3278–3291. doi:10.1109/TIE.2021.3076720
León, L. F., Martinez, M., Ontiveros, L. J., and Mercado, P. E. (2022). Devices and control strategies for voltage regulation under influence of photovoltaic distributed generation. a review. IEEE Lat. Am. Trans. 20, 731–745. doi:10.1109/TLA.2022.9693557
Liang, J., and Zhu, K. (2018). Coded switching scheme for monitoring the operation of distribution capacitors. IEEE Trans. Power Deliv. 33, 3075–3084. doi:10.1109/TPWRD.2018.2842061
Liang, S., Yang, Y., Zhang, Y., and Li, H. (2022). “Evaluation index system and comprehensive evaluation model of power quality governance effect in distribution station area,” in Proceedings of the 2022 IEEE/IAS Industrial and Commercial Power System Asia (I&CPS Asia), Shanghai, China, July 2022, 1794–1800. doi:10.1109/ICPSAsia55496.2022.9949854
Liao, H., Jia, Z., Wang, R., Zhou, Z., Wang, F., Han, D., et al. (2022). Adaptive learning-based delay-sensitive and secure edge-end collaboration for multi-mode low-carbon power iot. China Commun. 19, 324–336. doi:10.23919/JCC.2022.07.024
Liao, H., Zhou, Z., Zhao, X., and Wang, Y. (2021). Learning-based queue-aware task offloading and resource allocation for space–air–ground-integrated power iot. IEEE Internet Things J. 8, 5250–5263. doi:10.1109/JIOT.2021.3058236
Liu, B., Tan, Z., and Lan, C. (2022). Key concepts and framework of power distribution and utilization of transparent power grids. Front. Energy Res. 10, 900890. doi:10.3389/fenrg.2022.900890
Liu, X., Jia, W., Liu, W., and Pedrycz, W. (2020). Afsse: an interpretable classifier with axiomatic fuzzy set and semantic entropy. IEEE Trans. Fuzzy Syst. 28, 2825–2840. doi:10.1109/TFUZZ.2019.2945239
Ma, J., Ma, X., Yue, J., and Tian, D. (2020). Kullback-leibler distance based generalized grey target decision method with index and weight both containing mixed attribute values. IEEE Access 8, 162847–162854. doi:10.1109/ACCESS.2020.3020045
Madavan, R., and Saroja, S. (2020). Decision making on the state of transformers based on insulation condition using ahp and topsis methods. IET Sci. Meas. Technol. 14 (8), 137–145. doi:10.1049/iet-smt.2018.5337
Mansouri, M., and Leghris, C. (2019). New manhattan distance-based fuzzy madm method for the network selection. IET Commun. 13 (7), 1980–1987. doi:10.1049/iet-com.2018.5454
Noh, C.-H., Kim, C.-H., Gwon, G.-H., and Oh, Y.-S. (2018). Development of fault section identification technique for low voltage dc distribution systems by using capacitive discharge current. J. Mod. Power Syst. Clean. Energy 6, 509–520. doi:10.1007/s40565-017-0362-4
Ramanayaka, K. H., Chen, X., and Shi, B. (2019). Application of extent analysis fahp to determine the relative weights of evaluation indices for library website usability acceptance model. IET Softw. 13 (9), 86–95. doi:10.1049/iet-sen.2018.5185
Rezaei, A., Burl, J. B., Rezaei, M., and Zhou, B. (2018). Catch energy saving opportunity in charge-depletion mode, a real-time controller for plug-in hybrid electric vehicles. IEEE Trans. Veh. Technol. 67, 11234–11237. doi:10.1109/TVT.2018.2866569
Sun, Y., and Fang, Z. (2021). Research on projection gray target model based on fanp-qfd for weapon system of systems capability evaluation. IEEE Syst. J. 15, 4126–4136. doi:10.1109/JSYST.2020.3027585
Vai, V., Alvarez-Herault, M.-C., Raison, B., and Bun, L. (2020). Optimal low-voltage distribution topology with integration of pv and storage for rural electrification in developing countries: a case study of Cambodia. J. Mod. Power Syst. Clean. Energy 8, 531–539. doi:10.35833/MPCE.2019.000141
Wang, S., Ge, L., Cai, S., and Wu, L. (2018). Hybrid interval ahp-entropy method for electricity user evaluation in smart electricity utilization. J. Mod. Power Syst. Clean. Energy 6, 701–711. doi:10.1007/s40565-017-0355-3
Wu, L., Bai, H., Zhou, K., Yuan, Z., Yu, X., Lei, J., et al. (2022). Distribution network voltage arc suppression method based on flexible regulation of neutral point potential of the new grounding transformer. Front. Energy Res. 10, 803142. doi:10.3389/fenrg.2022.803142
Yin, X., Wang, C., Du, P., Zhang, X., Lu, Z., and Luo, Z. (2021). “Evaluation of electric vehicle charging station in distribution network planning,” in Proceedings of the 2021 6th International Conference on Power and Renewable Energy (ICPRE), Shanghai, China, September 2021, 689–693.
Zhang, J. H., Zhang, M., and Zeng, B. (2012). “Economic evaluation of 20kv distribution schemes based on multi-grey target theory,” in Proceedings of the 2012 China International Conference on Electricity Distribution, Shanghai, China, September 2012.1–10.
Zhang, M., Sun, Q., and Yang, X. (2021). Research on the assessment of the capacity of urban distribution networks to accept electric vehicles based on the improved topsis method. IET Generation, Transm. Distribution 15 (14), 2804–2818. doi:10.1049/gtd2.12216
Zhang, S., Yao, Z., Liao, H., Zhou, Z., Chen, Y., and You, Z. (2023). Endogenous security-aware resource management for digital twin and 6g edge intelligence integrated smart park. China Commun. 20, 46–60. doi:10.23919/JCC.2023.02.004
Zhang, X., Li, H., Wang, L., Liu, Y., and Wang, F. (2021). Comprehensive evaluation of ac-dc distribution network in photovoltaic-energy storage charging station based on ahp-topsis method. In Proceedings of the 2021 IEEE 5th Conference on Energy Internet and Energy System Integration (EI2). Taiyuan, China, October 2021, 83–88.
Zhang, Y., and Zhang, S. (2022). “Control analysis of distribution network engineering investment balance rate based on variation coefficient method and grey relational evaluation model,” in Proceedings of the 2022 IEEE 6th Advanced Information Technology, Electronic and Automation Control Conference (IAEAC), Beijing, China, October 2022, 400–404. doi:10.1109/IAEAC54830.2022.9929969
Zheng, Y., Li, J., and Jiao, Y. (2021). “Distribution network planning and comprehensive investment evaluation based on bayes-entropy weight-fuzzy analytic hierarchy process,” in Proceedings of the 2021 IEEE International Conference on Power Electronics, Computer Applications (ICPECA), Shenyang, China, January 2021, 477–481.
Zhengxin, W., Yaoguo, D., Jing, W., and Hu, Y. (2009). Study on the extending multi-attribute decision model of grey target. J. Syst. Eng. Electron. 20, 985–991. doi:10.1007/s10951-009-0120-1
Zhou, Z., Chen, X., Liao, H., Gan, Z., Xiao, F., Tu, Q., et al. (2023). Collaborative learning-based network resource scheduling and route management for multi-mode green iot. IEEE Trans. Green Commun. Netw. 7, 928–939. doi:10.1109/TGCN.2022.3187463
Keywords: transparency evaluation, distribution station area, confidence relative off-target distance, multi-dimensional index, fuzzy entropy
Citation: Ren J, Li L, Li S, Liu M, Fang M, Zhang S, Liu W, Liu Y and Yu H (2024) Confidence relative off-targets distance-based multi-dimensional transparency evaluation of distribution station area. Front. Energy Res. 11:1283775. doi: 10.3389/fenrg.2023.1283775
Received: 27 August 2023; Accepted: 18 December 2023;
Published: 16 January 2024.
Edited by:
Rakibuzzaman Shah, Federation University Australia, AustraliaReviewed by:
B. M. Ruhul Amin, Federation University Australia, AustraliaNarottam Das, Central Queensland University, Australia
Copyright © 2024 Ren, Li, Li, Liu, Fang, Zhang, Liu, Liu and Yu. This is an open-access article distributed under the terms of the Creative Commons Attribution License (CC BY). The use, distribution or reproduction in other forums is permitted, provided the original author(s) and the copyright owner(s) are credited and that the original publication in this journal is cited, in accordance with accepted academic practice. No use, distribution or reproduction is permitted which does not comply with these terms.
*Correspondence: Shuai Li, YnFkeHN5MjAyMkAxNjMuY29t
 Jie Ren1
 Shuai Li