 Xueting Cheng1
 Wenxu Liu
- 1State Grid Shanxi Electric Power Research Institute, State Grid Co, Ltd, Shanxi, China
- 2North China Electric Power University, Beijing, China
As the penetration rate of new energy in the power system gradually increases and the complexity of cascading faults increases, it is of great significance for the power system to comprehensively explore the chain of cascading faults in the new energy power system and quickly determine the closely related lines in the cascading faults. In response to the lack of consideration in existing research of the changes in the importance of transmission lines after the introduction of new energy, this paper proposes a cascading failure prediction index that integrates the importance and operational status of transmission lines in new energy power systems and applies it to the search for cascading failures in new energy power systems. First, the development characteristics of cascading faults were analyzed, and the main factors influencing cascading faults were identified: the importance of the transmission line and operating status of the new energy power system. Based on these factors, a prediction index for cascading faults was established, and the accident chain was searched using this index. Then, the FP-growth algorithm was used to analyze the lines in the fault chain concentration, and based on the analysis results, the correlation relationship suitable for the cascading failure lines in the new energy power system was determined. Finally, a simulation was conducted on an IEEE 10 machine 39 node system containing new energy wind turbines, and the results verified the effectiveness of the proposed indicators and strategies.
1 Introduction
In recent years, major power outages have occurred frequently worldwide, mostly caused by chain failures. As the proportion of new energy in the power system gradually increases, cascading failures have become complex. Chain failures are mainly caused by the failure of certain lines in the power grid and their withdrawal from operation, affecting the remaining branches of the power grid (Deng et al., 2022). Therefore, a comprehensive exploration of chain failures in the new energy power system and the analysis of closely related lines are of great significance for effectively preventing chain failures and major power outages.
At present, the research methods for cascading faults in power systems are mainly divided into two categories: the first type is based on complex system theory and complex network theory (Jia et al., 2016). The complex system theory evaluates the risk of cascading faults from an overall perspective by analyzing the self-organizing criticality of the power system. The models proposed based on this theory include OPA model, CASCADE model, branch process model, and implicit fault model. These models do not focus on the physical details of the development process of cascading faults, but rather emphasize the initial conditions and macroscopic characteristics of cascading faults in the power grid, and therefore cannot describe the electrical characteristics of the power grid in detail Actual grid operation status. Complex network theory uses metrics such as degree values, degree distributions, and betweenness centrality to describe networks and the impact of network topology on cascading faults. Models based on this theory include small world network models, Watts construction models, Holme and Kim’s separated center models, Motte and Lai models, Crucitti and Latora’s effective performance models, etc. These models simplify the consideration of physical processes in actual systems, Therefore, there is a gap between the actual physical process and the actual operation status of the power grid, which cannot be analyzed. The second type is based on the theory of power system analysis, and the strategy of pattern search is more closely related to the actual development process of cascading faults. For example, Li et al. proposes a fault chain model for AC/DC hybrid systems based on probabilistic power flow and short-circuit ratio theory, fully considering the impact of wind power uncertainty (Li et al., 2020). Huang et al. proposes a power grid fault assessment model considering the impact of typhoons based on existing power grid cascading fault models based on fault chains (Huang et al., 2019). Zhu et al. established a complete search model for the interlocking fault chain of AC/DC systems in large power grids, pruning the search based on the risk of line outage while ensuring accuracy and improving search efficiency (Zhu et al., 2018).
The current research on cascading faults mainly focuses on pure AC systems, considering the line distance and operating status of traditional power grids. For example, Liu et al. defines the system power flow entropy based on the entropy definition of the system and the percentage of the specified load rate components in the total number of components. The minimum load loss is obtained by taking the minimum system loss load as the objective function, and the severity index of load loss after a component failure in the ith stage of cascading faults is standardized. A system brittleness entropy index is proposed based on the combination of system power flow entropy and load loss severity index after standardization treatment. It can calculate the brittleness risk entropy corresponding to different stages of cascading faults, and be used to evaluate the impact of brittleness propagation process and component faults on the power grid (Liu et al., 2012). Qi et al. establishes a cascading failure model based on the power flow transfer factor and line topology distance and uses the entropy weight method to more comprehensively evaluate the risk of an accident chain (Qi et al., 2016). Xu et al. proposes the identification of critical power lines in the power grid based on the intermediate value of power flow (Xu and Wang, 2019). The randomness and volatility of new energy output (Wang et al., 2021) lead to uncertainty in the inline power. Zeng et al. established a line overload model accounting for fluctuations in new energy output through stochastic power flow and analyzed the risk of cascading faults in power systems containing wind power based on the overload model (Zeng et al., 2014; ATHARI and Wang, 2018). Ni et al. used the risk of line overload induced by fluctuations in new energy as a weighting coefficient and combined it with power flow transfer entropy to propose a weak link identification method for transmission system cascading faults (Ni et al., 2019). The above research mainly focuses on analyzing the impact of the randomness of new energy output on the risk of line overload without fully considering the impact of the introduction of new energy on the importance of the line, resulting in incomplete accident chains. Therefore, it is necessary to comprehensively consider the changes in the importance and operational status of the line brought about by the integration of new energy into the power grid to obtain a more complete set of accident chains.
In response to the shortcomings of current research methods, we propose a cascading failure prediction index that integrates the importance and operational status of new energy power system lines. The main research content of this article includes the search for a chain of failures in new energy power systems and an analysis of the correlation relationships between chain failure lines. First, the main factors leading to the expansion of cascading faults were identified, and a prediction index for cascading fault accident chain routes based on the importance and operating status of new energy lines was proposed, which was used for accident chain search. Then, by obtaining the set of accident chains, the frequent pattern (FP) growth algorithm is used to analyze the lines within them, and the linear correlation relationship of cascading failures in the new energy power system is determined based on the analysis results.
2 Cascading failures and accident chain
The accident chain model originates from safety science and is made up of chains and correlations. The theory of accident chains suggests that major accidents are rarely caused by a single cause but are induced by relevant factors when multiple conditions are met simultaneously. A power system blackout accident is not caused by a single fault but rather by a chain effect of concurrent accident sequences. Assuming that the power grid has n fault chains, the set of fault chains L and the fault chains
In the formula,
The logical relationship between the system’s major power outage accident, accident chain, and intermediate links in the accident chain is shown in Figure 1. The logical relationship between system power outage accidents and the set of fault chains {
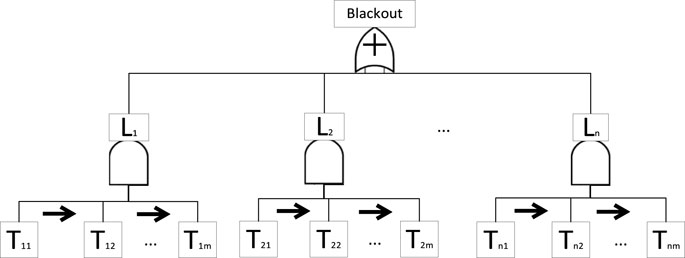
FIGURE 1. Dynamic logic diagram of a system power outage and accident chain.
Accident chain triggering is a small probability event in the power grid, and the triggering probabilities of different accident chains vary greatly. The process triggered by the accident chain has different impacts on the safety of the power grid. Using risk assessment theory (Liu et al., 2016) to comprehensively evaluate the different characteristics between the accident chains, the risk assessment of the accident chain needs to determine the probability of occurrence of each link in the accident chain. The above set of fault chains provides all possible forms of cascading faults, but the probability of each fault chain occurring is not the same, so the criticality of lines in different fault chains also varies.
The diversity of causes and evolution modes of chain failures allows them to be classified into different types (Fang et al., 2022). The main driving factors for the evolution of chain faults include overload dominant, coordination dominant, and structural dominant. The coordinated dominant fault evolution refers to the main driving factors of major power outages, which are the unreasonable setting of secondary devices such as relay protection, low equipment reliability, etc., leading to the expansion of chain faults, caused by improper coordination of protection devices or equipment in the system; Structural dominated fault evolution refers to the significant damage to the power grid topology caused by unexpected disconnection of interconnection lines between regional interconnected power grids, premature operation of splitting devices in the early stages of chain fault development, and other factors that trigger major power outages. This is caused by structural issues or design defects in the system. The most important type is the overload-dominated type, and its evolution process is as follows: when certain components of the power system are disturbed/faulty and exit operation, the power flow passing through the faulty line will transfer to the surrounding line. If the surrounding line is affected by the overload protection action of the power flow, this will cause a new round of component removal and power flow transfer, and the above process will be repeated until a major power outage occurs. In this evolutionary mode, the frequency and voltage indicators of the power system have relatively small changes and have little impact on cascading faults. Overloading of power flow and the removal of certain lines are the main driving forces for the evolution of cascading faults.
A new type of power system with new energy as the main body, large-scale wind and solar power is replaced by conventional units through inverter grid connection, which reduces system inertia, reduces disturbance resistance, and increases the difficulty of frequency control. The asynchronous power grid interconnected by high-voltage direct current transmission between large regions has improved the security of cross regional power grids, but the support capacity of AC power grids in each region has decreased, and frequency stability has become more prominent. The power system is always subjected to external disturbances during operation, which can lead to power imbalance, transient frequency response, and significant spatiotemporal distribution characteristics. When the electrical distance between new energy and synchronous machines is relatively close, the voltage support characteristics of the power grid are strong, and new energy and reactive power compensation overvoltage do not play a dominant role. The problem of new energy machine terminal voltage exceeding the limit caused by the power angle swing characteristics of synchronous machines is more serious. At the same time, after a power grid failure, the power grid experiences continuous DC commutation failure or locking, resulting in a change in the grid structure and a shift in power flow. After the transfer of power flow in the power grid, it may cause long-term overload or transient low voltage and high current of the AC line, causing the AC line to be cut off; It may also cause local low voltage or local high voltage, and new energy units may be disconnected due to high voltage crossing failure or low voltage crossing failure.
With the large-scale integration of new energy into the power system, cascading faults in power systems containing new energy exhibit characteristics different than those of traditional power systems. On the one hand, new energy equipment has characteristics such as strong randomness and uncertainty, and lines with new energy equipment are more susceptible to faults in other lines, which may lead to chain failures. On the other hand, the different positions of new energy units in the power grid can cause changes in the importance of the line, making searching for chain failures and accident chains more complex. In summary, this article proposes a cascading failure prediction index that integrates the importance and operational status of new energy power system lines and designs a fault chain search strategy.
3 Cascading failure accident chain prediction
3.1 Establishment of the initial fault set
The identification of the initial fault link is the primary step in establishing a cascading failure accident chain model. For the new energy power system, an initial fault indicator is established based on the distance between the line and the new energy unit and the impact index of power flow transfer entropy. By selecting a branch that is prone to subsequent faults to be the initial fault branch, the speed and accuracy of initial fault identification can be improved.
a) Transmission capacity of line i. Each line in the power grid has different structural importance, with lines closer to new energy units having higher structural importance. Line faults with higher structural importance are more likely to lead to cascading faults. To measure the importance of transmission lines in the topology of new energy power systems, this article defines the transmission capacity of power and load nodes on (s, t) branch i as:
In the formula,
The formula:
b) Entropy impact index of power flow transfer based on the distance between the line and new energy units. To measure the importance of branches in the operation status of the power system, this article combines the concept of power flow transfer entropy in reference (Cao et al., 2021) to determine the impact of branch disconnection on other branches of the system. The concept of power flow transfer entropy is as follows: first, when branch i is disconnected, branch k shares the power flow increment of branch i transfer. Then, the impact rate of branch i on branch k’s power flow transfer is defined. Then, the power flow transfer entropy of the branch is defined based on the power flow distribution entropy of the node. Finally, the vulnerability index of branch consequences is defined based on the power flow transfer entropy. When the power flow impact rate of each branch is equal, the power flow transfer entropy reaches the maximum value, the possibility of each branch crossing the limit is the lowest, and the node disturbance impact that the system bears is the smallest; When the impact of the power flow is all concentrated on a single line, the minimum entropy of the power flow transfer is 0, which is most likely to cause branch out of limit faults. The relevant formulas are defined as follows:
If branch i is disconnected, the impact value
In the formula,
The ratio
In the equation, N represents the set of all other branches in the system except for branch i.
Therefore, considering the influence of the transmission margin on branch i, the power flow transfer entropy
Based on the power flow transfer entropy
According to Equation 8, the greater the initial power flow borne by branch i is, the closer it is to the new energy unit, and the smaller the power flow transfer entropy is, the greater the impact of branch i’s interruption on the system, which is more likely to cause subsequent system failures.
c) Initial fault indicator. Based on the transmission capacity of the above line and the impact index of power flow transfer entropy based on the distance between the line and the new energy unit, the initial fault index of branch i is defined as:
We set an appropriate selection threshold based on the initial fault indicator, select the branches with larger indicator values to form the key branch set, and use the key branch set that is prone to causing subsequent cascading faults as the initial fault branch set.
3.2 Prediction of intermediate links
The higher the penetration rate of new energy in the power grid is, the stronger the dependence of the power grid on new energy, and the fluctuation of the output of new energy units leads to uncertainty in the transmission power of the line. Therefore, the more new energy units connected to line i, the greater the probability of line i failure. The intermediate number of lines refers to the number of times the transmission line passes through the shortest path formed between all generator buses and load buses in the power grid, which can reflect the importance of the transmission line in the topological structure of the power grid. The formula is as follows:
In the formula, i is the line number,
The load rate
In the formula,
By quantifying the above-influencing factors and combining them with the proportion of new energy equipment, the intermediate link prediction indicators can be obtained:
In the formula,
3.3 Criteria for the end of the accident chain search
When studying major power outages both domestically and internationally, we found that the process of major power outages caused by cascading faults is often accompanied by phenomena such as power line overload and bus voltage fluctuations. These phenomena ultimately lead to instability or system disconnection in the entire power system. After the system is disconnected, the power balance between various subsystems is disrupted, leading to a series of voltage and frequency fluctuations. In severe cases, this may result in the inability of the power flow to converge or lead to large-scale power outages. In addition, to ensure the continued operation of various subsystems, it is usually necessary to cut off some generator sets and loads, but these operational measures may further expand the power outage range. Notably, even if there is no significant load loss during system disconnection, the power network will still fall into a relatively dangerous operating state, which poses a potential risk of major power outages. Therefore, system disconnection or nonconvergence of power flow has been recognized as a criterion for power outage accidents. The process of generating a chain of failures is shown in Figure 2.
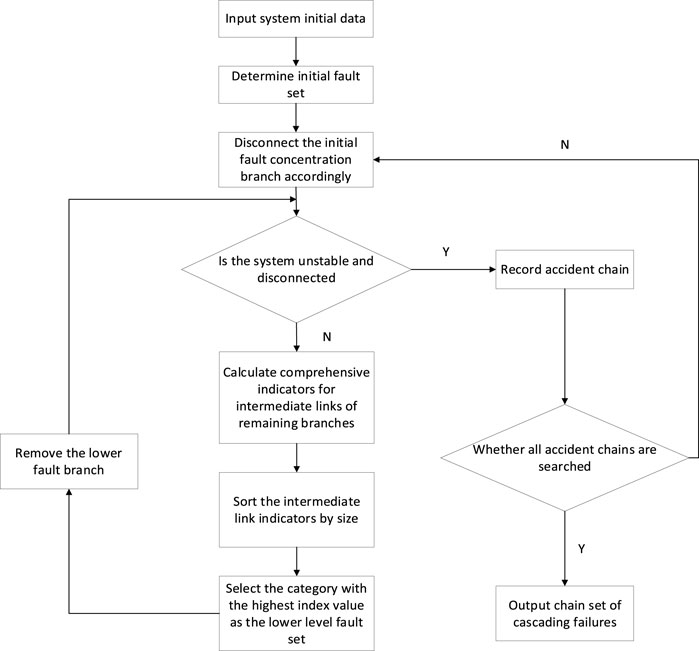
FIGURE 2. Flow chart of accident chain generation.
4 Association analysis
We analyze the correlations between multiple lines in the accident chain set of cascading faults, and the information contained in the accident chain set is discovered. The correlation here refers to the frequent occurrence of certain lines in various development modes of chain failures, which exhibit a relatively close connection between the front and back in the accident chain and exhibit certain regularity. Many scholars at home and abroad have researched this topic and proposed many theories and algorithms for correlation analysis. This article uses the FP-growth algorithm to explore the correlation in the accident chain.
First, we explain the relevant concepts in correlation analysis:
a) Item or candidate: An item in the database that has a unique identifier. Assuming the database is composed of m attributes (A, B,., M), then the first order itemset is {{A}, {B},…, {M}}. The second order term set is formed by pairing elements of the first order term set, namely, {{A, B}, {A, C}., {A, M},., {B, M},., {L, M}}, and so on.
b) Support: Refers to the percentage of the number of supports XY corresponding to the antecedents and antecedents of a rule and the total number of AllSamples recorded.
c) Frequent term: Refers to k-order candidate options that occur no less than the preset minimum support threshold in the dataset. At the same time, k-order candidates with occurrences less than the set minimum support threshold are called nonfrequent terms.
Then, the following are the detailed steps of the FP growth algorithm, the FP-Growth algorithm flowchart is shown in Figure 3:
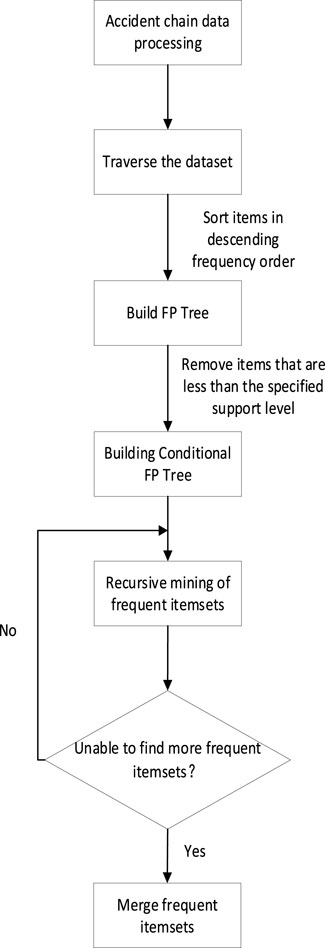
FIGURE 3. FP-Growth algorithm flowchart.
a) Build FP tree: First, the FP-growth algorithm traverses the dataset once, calculates the frequency of each item, and sorts the items in descending order of frequency. Subsequently, these sorted items are used to construct an FP tree. The FP tree is a compact data structure where each node represents an item, and the number of occurrences of that item in the dataset is recorded on the node. Each item and its corresponding frequency form a header table.
b) Build the conditional pattern base: For each item, the FP-growth algorithm constructs its corresponding conditional pattern base. The conditional pattern base refers to the collection of all prefix paths ending with the current item. Each prefix path corresponds to a frequency, while the other items in the path form a new itemset.
c) Recursive construction of the FP tree: For each item, a new FP tree is recursively constructed by utilizing its conditional pattern basis. This process iterates until no more conditional pattern bases can be constructed.
d) Mining frequent patterns from FP trees: By traversing the FP tree, all frequent patterns can be discovered. Starting from the root node of the tree, we gradually construct frequent patterns along different paths. Each path corresponds to a frequent pattern, and we can form a complete frequent pattern by adding each item on the path one by one.
The main advantage of the FP-growth algorithm is that it avoids the generation process of candidate sets, thereby reducing computational and storage costs and making it more efficient in processing large-scale datasets. In addition, this algorithm can fully utilize the structure of the FP tree to quickly discover frequent patterns. At the same time, it also supports recursive construction and mining of conditional pattern bases for frequent patterns.
Finally, the key path mining process is carried out as shown in Figure 4. First, we identify the initial fault and generate a set of chain failures based on corresponding indicators. Then, the data of the accident chain are formatted, and the appropriate minimum support is selected. A frequent item mining program based on the FP-growth algorithm is used to mine the frequent items of the accident chain, obtaining a set of frequent items that have a strong correlation with the initial fault. The lines contained in the frequent item set have strong correlations with the evolution of cascading failures.

FIGURE 4. The key route excavation process.
5 Example analysis
On the basis of the IEEE39 node system structure, the synchronous units connected to Bus 30, Bus 31, Bus 33, and Bus 38 were replaced with doubly fed asynchronous wind turbines of the same generation capacity, and corresponding reactive power compensation and protection devices were configured for the wind turbines to obtain the IEEE39 node system containing new energy equipment, as shown in Figure 5.
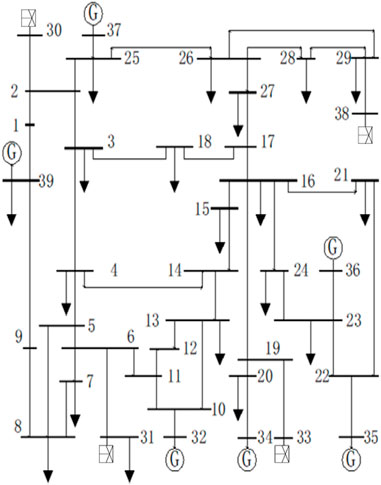
FIGURE 5. IEEE39 node system diagram with renewable energy equipment.
The power generation and load capacity of the IEEE39 node system with renewable energy equipment are shown in Table 1. Among them, the power generation of the wind turbine connected to bus 30 is 250MW, the power generation of the wind turbine connected to bus 31 is 520MW, the power generation of the wind turbine connected to bus 33 is 632MW, and the power generation of the wind turbine connected to bus 38 is 830 MW. The total power generation of wind turbines is 2232 MW.
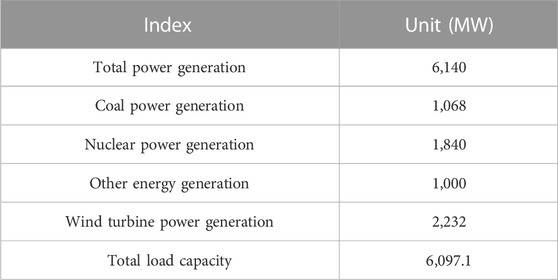
TABLE 1. Power generation and load capacity of IEEE 39 node system including renewable energy equipment.
Based on the relevant formulas in section 3.1, using Python software and DIgSILENT software, the values of the transmission capacity index and the power flow transfer entropy impact index of the line are first obtained. The values of the above two indicators are multiplied to obtain the initial fault index value. The initial fault index value is listed in descending order to obtain the initial fault index of some lines, as shown in Table 2. The initial fault index threshold is set to 0.3.
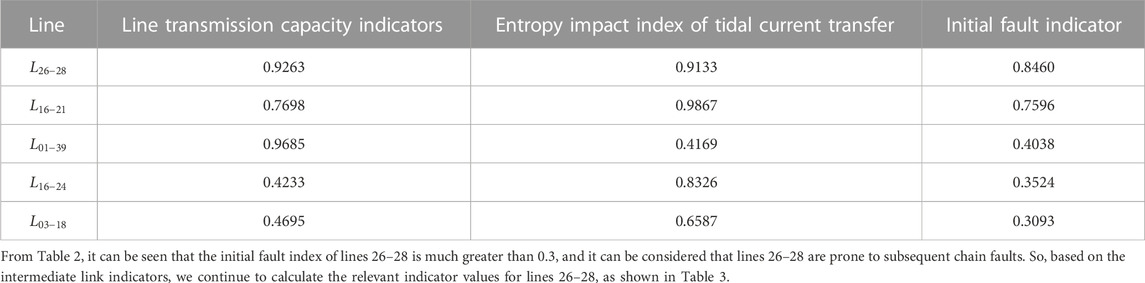
TABLE 2. Sorting table of initial fault indicators of the line.
From Table 3, it can be seen that after the disconnection of lines 26–28, the intermediate link prediction index of lines 21–22 is relatively large, which can be used as the next level of disconnection line. Continue to calculate the intermediate link prediction index, and obtain the relevant index values as shown in Table 4.

TABLE 3. Index values of other lines after removing the initial faulty line 26–28.
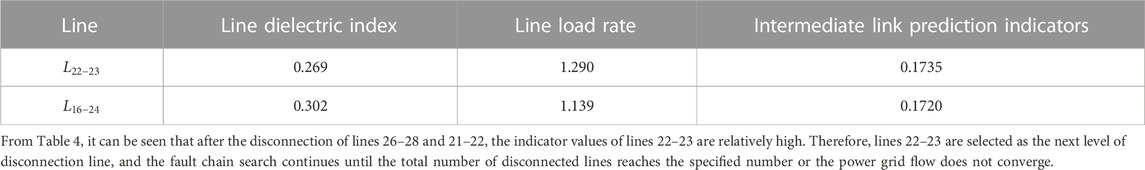
TABLE 4. Index values of other lines after cutting off the line 26–28 and the line 21–22.
According to the indicators mentioned in reference (Li and Jin, 2018) and section 3 of this article, the lines of the IEEE39 node system containing renewable energy equipment were traversed. Reference (Li et al., 2020) first starts with DC power flow and combines matrix theory to propose a method for determining the power flow transfer area and calculating the power flow transfer amount based on network topology structure; Then, based on the above methods, the distribution entropy of power flow transfer and the sensitivity entropy of load impact were defined, and a comprehensive evaluation index for key lines was proposed by combining the two entropy indicators mentioned above; Finally, this indicator is used to identify key lines in power grid cascading faults. The chain of cascading faults was screened according to the same threshold, as shown in Table 5 and Table 6, respectively.
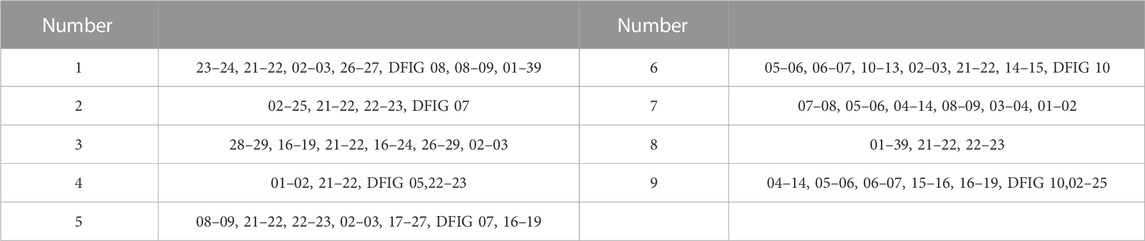
TABLE 5. Accident chains screened based on literature (Li and Jin, 2018) indicators.
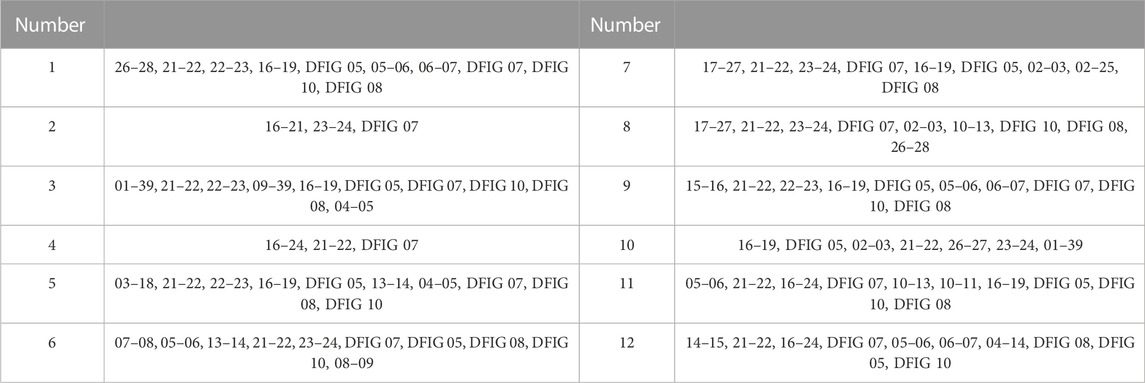
TABLE 6. The accident chain selected based on the indicators in this article.
Compare the selected accident chains in Table 5 and Table 6 of the article, it can be found that under the same threshold setting, the accident chain search model proposed in this article can identify more accident chains. One reason is that the model in reference (Li et al., 2020) sets that the system will undergo splitting after some lines are disconnected, and the power flow transfer situation after the above line disconnection is no longer considered. The selection range of the initial line is small, while the model in this paper only sets a threshold for the selection of the initial faulty line, resulting in a larger search range. The second reason is that reference (Li et al., 2020) mainly considers the impact of network topology changes on power flow transfer, only proposing relevant indicators for power flow transfer, without considering the structural importance of the line itself in the power grid, and without considering the impact of new energy access on the development of cascading faults. When searching for fault chains in power grids containing new energy, it is easy to miss some lines and the obtained fault chains are not comprehensive enough.
Taking the minimum support = 3, we construct an FP tree according to the steps described in Section 4, and grow from the empty set to obtain the FP tree shown in Figure 6. The header pointer table shown in Figure 5 contains the element items contained in the dataset and their occurrence times and connects all similar element items in the FP tree through a curve. A straight line connecting nodes represents the relationship between a parent and a child, with the parent on top.
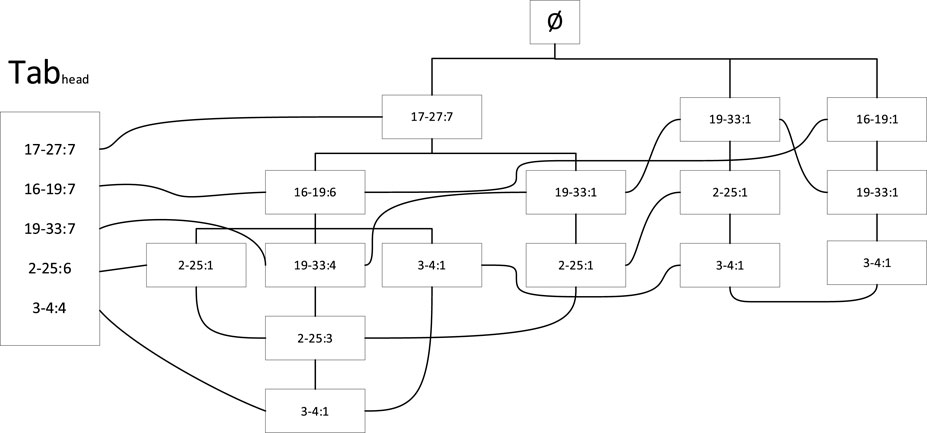
FIGURE 6. FP-tree structure.
Correlation analysis is performed on the lines in the IEEE39 node cascading fault chain set containing new energy equipment using the FP-growth algorithm, as shown in Table 7. The correlation analysis results of the accident chain set are obtained by using the FP tree algorithm to search for frequent itemsets, with a minimum support of 3 set for frequent itemsets. Firstly, combined with Figure 6, search for the prefix path of line 2–25. In the figure above, search for the first 2–25 from left to right. By tracing up to the root node, you can obtain the first prefix path as {16–19, 17–27}. Then, search for the second 2–25, and then trace up to the root node to obtain the second prefix path as {19–33, 16–19, 17–27}. Then, search for the third 2–25, and then trace up to the root node to obtain the third prefix path as {19–33, 17–27}, Finally, search for the fourth 2–25, and then trace back to the root node to obtain the fourth prefix path as {19–33}.

TABLE 7. Accident chain set correlation analysis results of IEEE 39 node system including new energy equipment.
Then, based on the support of each prefix path in the search line 2–25 mentioned above, it can be concluded that the support of prefix paths {16–19, 17–27} is 1, {19–33, 16–19, 17–27} is 3, {19–33, 17–27} is 1, and {19–33} is 1. By adding the support of each line in the prefix paths above, it can be concluded that the support of lines 16–19 is 4, lines 17–27 are 5, and lines 19–33 are 5. Due to the fact that the support of these three lines is greater than the minimum support of 3, these three lines can be used as a combination in the third order frequent term set.
By analyzing the correlated lines in the table, we find that in the IEEE39 node system, frequent items such as lines 2–30, 6–31, and 19–33 are the outgoing lines of new energy generators. Frequent items such as lines 17–27, 16–19, 21–22, and three to four are load supply lines. In the IEEE39 node system, lines 17–27, 16–19, and 19–33 are a set of transmission cross-sections. These lines have a strong correlation with the evolution of cascading faults in power systems containing new energy, which can easily lead to large-scale power outages. Therefore, certain measures should be taken to ensure the safe and stable operation of these lines.
After calculation and simulation, 30 accident chains were obtained, and the probability table of closely related lines appearing in the same accident chain is shown in Table 8. At the same time, any combination of 7 lines was selected to obtain the probability of appearing in the same accident chain as shown in Table 9. From Table 8, it can be seen that the probability of closely related line combinations appearing in the same accident chain is higher than 50%, while in Table 9, the probability of any combination of lines appearing in the same accident chain is mostly lower than 50%, with only one combination having a slightly higher probability than 50%. This indicates that during the occurrence of chain failures, these line combinations have a higher probability of consecutive failures. By comparing the calculated line combinations with the line combinations obtained using the FP Growth algorithm, it can be found that the combination of tight lines is roughly the same, verifying the correctness and effectiveness of the FP Growth algorithm.
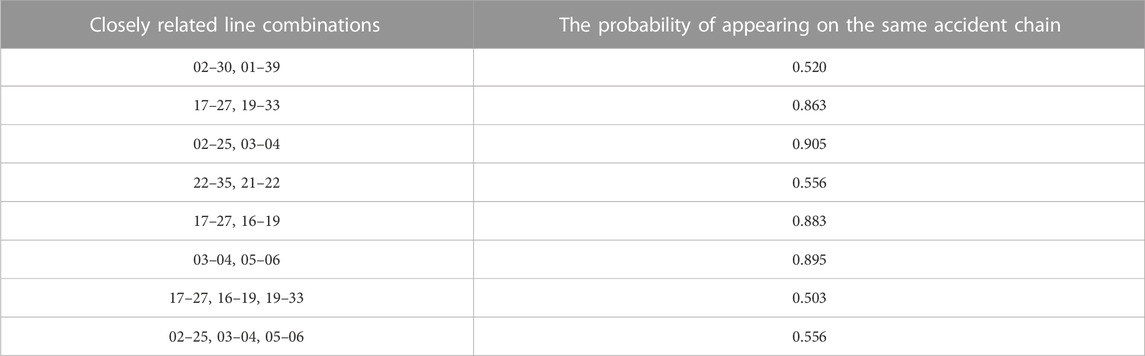
TABLE 8. Probability of closely related line combinations appearing in the accident chain.
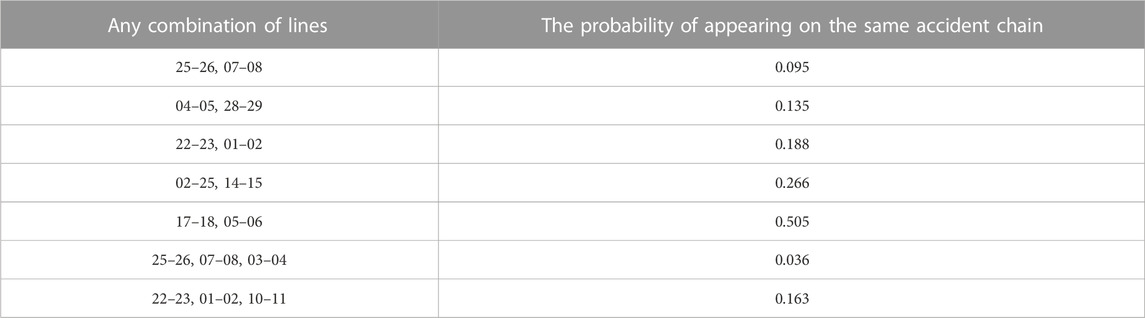
TABLE 9. Probability of occurrence of any combination of lines in the accident chain.
Calculate the probability of each line appearing in each accident chain searched in this article, and rank it from high to low to obtain the probability of some lines appearing as shown in Table 10. The more times a line appears in the accident chain, the easier it is for chain faults to spread to the line or cause other line faults, and the higher the criticality of the line. Lines with a probability of occurrence higher than 0.65 are designated as critical lines. It can be seen that the lines in the table are all critical lines, and adding certain protective measures to these lines can reduce the occurrence of large-scale chain failures.
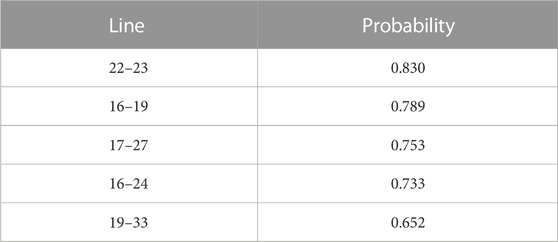
TABLE 10. Probability of partial lines appearing in the accident chain.
From Table 11, compared with the results of references (Xu and Zhi, 2016; Shan et al., 2018), the identification results of this article have more than half of the same lines, which verifies the rationality of the fault chain search in this article. Reference (Shan et al., 2018) first defines the unit entropy comprehensive load rate by integrating the comprehensive load rate and power flow entropy of the power grid; Then, based on the HITS algorithm, the importance index of power grid nodes was defined, and a line outage consequence evaluation model was established by combining the unit entropy comprehensive load rate and the importance index of power grid nodes; Then, the probability of line breaking due to power flow exceeding the limit was defined, and a relative probability evaluation model for line breaking was constructed based on the fault chain of the line itself; Finally, based on the consequences of line disconnection and the probability of line disconnection, the fragile line index of the power grid was defined. Reference (Shan et al., 2018) suggests that the power flow impact on the line comes from random load fluctuations, without considering the importance of the line in terms of the new energy topology structure relative to the entire network, resulting in the omission of lines 4–14, 4–5, 22–23, and 16–24. These lines can break under N-1 accident conditions. Reference (Xu and Zhi, 2016) uses the DC power flow method to quickly estimate the power flow increment and load rate of other lines in the system when the line is disconnected. The weighted power flow impulse entropy is used to reflect the influence of the target line on the transfer power flow caused by other line disconnections, and the weighted power flow distribution entropy is used to reflect the impact of the target line disconnection on the load rate distribution of the system line. By combining weighted power flow impact entropy and weighted power flow distribution entropy, a comprehensive vulnerability index for transmission lines is defined to identify vulnerable lines in power grid fault propagation. Reference (Xu and Zhi, 2016) focuses on considering the impact of line disconnections on the power flow transfer process of fault propagation, thus missing lines 4–5 and 16–19. These line disconnections have a significant impact on the uniformity of the electrical structure of the power grid. The identification results of this method indicate that the importance and operational status indicators of the integrated new energy power system can be used to search for more comprehensive cascading failure lines.

TABLE 11. Line identification results using different methods.
6 Conclusion
We propose a cascading failure prediction index based on the importance and operating status of new energy power system lines, conduct a fault chain search and analyze the correlation relationship between cascading failure lines using the FP-growth algorithm. The prediction indicators for cascading faults include the line transmission capacity, power flow transfer entropy impact index based on the distance between the line and new energy units, structural importance and load rate of the line containing new energy, and more factors that affect cascading faults. The initial fault link and intermediate development link of accident chain prediction are separated, and in the previous part, the initial faults with a low probability of occurrence are filtered out, accelerating the search speed of the accident chain. The latter part is based on a risk-first strategy, which leads the search process toward a higher risk of cascading failures. The method of line correlation analysis can calculate the correlation between multiple lines. In the FP-Growth algorithm, support and the relationship between before and after are considered to ensure the effective screening of line sets that are prone to cascading faults and have a strong correlation. By comparing the simulation results of this article with the results of other literature, we show that the set of accident chains obtained by the proposed indicators is more complete. Line correlation analysis can be used to effectively identify strongly correlated lines in a new energy power system.
Data availability statement
The original contributions presented in the study are included in the article/Supplementary Material, further inquiries can be directed to the corresponding author.
Author contributions
WL: Writing–original draft. XC: Writing–original draft, Supervision. YB: Writing–original draft, Software. XL: Investigation, Writing–original draft.
Funding
The author(s) declare financial support was received for the research, authorship, and/or publication of this article. This research was funded by the State Grid Shanxi Electric Power Company Science and Technology Project (520530220006). The funder was not involved in the study design, collection, analysis, interpretation of data, the writing of this article, or the decision to submit it for publication.
Conflict of interest
Authors XC, YB, and XL were employed by Ltd.
The remaining author declares that the research was conducted in the absence of any commercial or financial relationships that could be construed as a potential conflict of interest.
Publisher’s note
All claims expressed in this article are solely those of the authors and do not necessarily represent those of their affiliated organizations, or those of the publisher, the editors and the reviewers. Any product that may be evaluated in this article, or claim that may be made by its manufacturer, is not guaranteed or endorsed by the publisher.
Supplementary material
The Supplementary Material for this article can be found online at: https://www.frontiersin.org/articles/10.3389/fenrg.2023.1283436/full#supplementary-material
References
Athari, M. H., and Wang, Z. F. (2018). Impacts of wind power uncertainty on grid vulnerability to cascading overload failures. IEEE Trans. Sustain. Energy 9 (1), 128–137. doi:10.1109/tste.2017.2718518
Cao, S., Zhang, X., Xiang, W., and Wen, J. (2021). A power flow transfer entropy based AC fault detection method for the MTDC wind power integration system. IEEE Trans. Ind. Electron. 68 (11), 11614–11620. doi:10.1109/TIE.2020.3031451
Deng, H., Chen, X., Wu, J., et al. (2022). Research on power grid prevention strategy considering voltage stability and chain fault triggering. Smart Power 50 (1), 1–6.
Fang, Y., Tao, H., Zhang, L., et al. (2022). Vulnerability analysis of transmission system cascading faults based on risk theory. Electr. Autom. 44 (02), 38–40.
Huang, Z., Wang, D., Xiong, Q., Lan, J., Zhu, G., and Qin, F. (2019). “Risk assessment of grid cascading failure accident chain considering typhoon impact,” in 2019 12th International Symposium on Computational Intelligence and Design, USA, 14-15 Dec. 2019 (IEEE), 255–258. doi:10.1109/ISCID.2019.10141
Jia, Y., Liu, R., Wang, P., and Han, X. (2016). Risk assessment of cascading failures in power grid based on complex network theory. Automation, Robotics Vis., 1–6. doi:10.1109/ICARCV.2016.7838704
Li, R., and Jin, B. (2018). Identification of key lines in power systems based on power flow transfer distribution entropy and load impact sensitivity entropy. Electr. Power Autom. Equip. 38 (9), 148–154. doi:10.16081/j.issn.1006-6047.2018.09.022
Li, Z., Ma, X., Luo, Y., Lang, Y., and Wu, C. (2020). “Risk analysis of cascading outage of large-scale wind power AC/DC hybrid system based on probabilistic load flow and short circuit ratio,” in IEEE 4th Information Technology, Networking, Electronic and Automation Control Conference, China, 12-14 June 2020 (IEEE), 2677–2682. doi:10.1109/ITNEC48623.2020.9085195
Liu, S., Shi, X., Wang, T., Zhang, Y., and Cao, Y. (2016). “Power grid risk assessment method based on risk probability engineering and its application,” in IEEE International Conference on Power System Technology, China, 12-14 September 2022 (IEEE), 1–5. doi:10.1109/POWERCON.2016.7753980
Liu, W., Wang, J., Xie, C., et al. (2012). A brittleness risk entropy based model for identifying the brittleness source of complex power grid interlocking faults. Proceeding CSEE 32 (31), 142–149. doi:10.13334/j.0258-8013.pcsee.2012.31.014
Ni, L., Wen, J., Zhang, X., et al. (2019). Identification of vulnerable lines in wind and solar power grid based on weighted breaking probability and severity of breaking consequences. High. Volt. Technol. 45 (12), 4013–4020. doi:10.13336/j.1003-6520.hve.20191125029
Qi, H., Shi, L., Sun, Q., and Yao, L. (2016). RNA-binding proteins in mouse male germline stem cells: a mammalian perspective. IEEE Power Energy Soc. General Meet. 5, 1–5. doi:10.1186/s13619-015-0022-y
Shan, Z., Wang, H., Lin, G., et al. (2018). Identification of fragile transmission lines in power grids considering the relative probability and consequences of disconnection. J. Zhejiang Univ. Eng. Ed. 52 (3), 560–568.
Wang, A., Zhong, W., Shen, Z., Wang, X., and Yang, Y. (2021). Summary of research on cascading failures of high proportion new energy power systems. Annu. Meet. CSEE Study Comm. HVDC Power Electron., 343–350. doi:10.1049/icp.2021.2586
Xu, D., and Wang, H. (2019). Assessment of high-risk cascading faults in large-scale wind power systems based on stochastic power flow and value at risk. Power grid Technol. 43 (2), 400–409. doi:10.13335/j.1000-3673.pst.2018.2344
Xu, Y., and Zhi, J. (2016). Identification of fragile transmission lines in power grid fault propagation based on weighted power flow entropy. Mod. Power 33 (3), 88–94. doi:10.19725/j.cnki.1007-2322.2016.03.014
Zeng, K., Wen, J., Chen, S., et al. (2014). Identification of critical lines under complex power grid cascading faults. Proceeding CSEE 34 (7), 1103–1112. doi:10.13334/j.0258-8013.pcsee.2014.07.012
Keywords: cascading failure, accident chain, new energy, line importance, association relationship
Citation: Cheng X, Liu W, Bao Y and Liu X (2023) Search strategy and line association analysis of cascading failure accident chain in new energy power systems. Front. Energy Res. 11:1283436. doi: 10.3389/fenrg.2023.1283436
Received: 26 August 2023; Accepted: 17 November 2023;
Published: 29 November 2023.
Edited by:
Bo Wang, Wuhan University, ChinaCopyright © 2023 Cheng, Liu, Bao and Liu. This is an open-access article distributed under the terms of the Creative Commons Attribution License (CC BY). The use, distribution or reproduction in other forums is permitted, provided the original author(s) and the copyright owner(s) are credited and that the original publication in this journal is cited, in accordance with accepted academic practice. No use, distribution or reproduction is permitted which does not comply with these terms.
*Correspondence: Wenxu Liu, MTc5NzAwODEwMkBxcS5jb20=