 Hao Chang
 Guangchao Ji1
 Guangjie Peng
- 1Research Center of Fluid Machinery Engineering and Technology, Jiangsu University, Zhenjiang, China
- 2International Shipping Research Institute, Gong Qing Institute of Science and Technology, Jiujiang, China
- 3Fluid Machinery of Wenling Research Institute, Jiangsu University, Wenling, China
- 4Chongqing Pump Industry Co Ltd, Chongqing, China
The C++ programming language is employed to improve the Computational Fluid Dynamics (CFD)- Discrete Element Method (DEM) coupling interface in this paper, the accuracy of solid-liquid two-phase flow numerical model are validated through experiments. Subsequently, the wear characteristics of the U-shaped elbows under different elbows spacing, bending diameter ratio, particle volume concentration, and particle size are investigated. The research results indicate that as the spacing between bends is increased, the phenomenon of particle sedimentation is intensified, and the maximum collision angle in elbow 2 is increased. The location of the maximum collision angle is closer to the outlet of elbow 2. However, both the collision frequency and wear rate are reduced due to the decrease in the number of particles. Smoother particle flow and a reduction in the collision angle and wear rate of particles on both bends are achieved by increasing the bend ratio. During the variation of the particle volume fraction from 0.5% to 7%, the increase in collision frequency and wear rate of both bends is slowed down. A greater decrease is observed in elbow 2, but the “shielding effect” is not observed. Furthermore, at low volume fractions, kinetic energy is lost by particles as they flow through elbow 1, resulting in a lower average wear rate in elbow 2 compared to elbow 1. Conversely, at high volume fractions, the opposite effect occurs. Finally, when keeping the particle volume fraction constant, an increase in the particle size leads to a smaller wear area in both bends. The wear rate in elbow 1 increases at a slower rate, while the wear rate in elbow 2 exhibits an initial increase followed by a decrease trend.
1 Introduction
Pipeline transportation has the advantages of large transportation volume, continuous, stable, low investment, and less land occupation. It is widely used in long-distance transportation of oil, natural gas, ore, etc. Transportation types usually involve slurry transportation and gas transportation. In slurry transportation, the conveying medium commonly incorporates particles like sand and ore. The interaction of these particles with the pipe wall through friction and impact can result in erosion and wear of the conveying pipeline, leading to thinning or even complete deterioration of the pipe wall. Consequently, the anticipated service life of the pipeline is significantly reduced. Moreover, with pipe wear, eddy currents may arise within the transported fluid, causing an uneven distribution of the slurry across the pipe cross-section and consequently impacting the efficiency of the transportation process (Wang et al., 2021; Sun et al., 2022a; Wang et al., 2022; Wang et al., 2023). Therefore, research on the mechanism of pipeline wear has important theoretical value and engineering significance for reducing pipeline system failure.
In the pipeline transportation system, the elbow is usually utilized as a turning component and is prone to wear. Consequently, the wear mechanism of elbows in pipeline systems has been the focus of domestic and foreign scholars. The wear removal mechanism of brittle and ductile materials was first discussed by Finnie (Finnie, 1960; Finnie, 1979), and the theory of micro cutting corrosion wear was proposed. Bitter (Bitter, 1963a; Bitter, 1963b) believed that the removal of wall materials is primarily due to the repeated deformation of particles and cutting action of particles during the collision with the wall, and a related wear model was established. The wear models were established by Archard (Archard, 1953), Ahlert (Ahlert, 1994; Oka et al., 2005; Oka and Yoshida, 2005) based on specific experimental conditions. Such models can predict pipeline wear in industrial applications in some specific engineering environments. The effect of particle flow velocity on the wear of a 90° elbow under low concentration mass load for two-phase gas-solid flow was measured by (Vieira et al., 2016) through experiments. They established a related wear model and verified the accuracy of the wear model using CFD simulation.
The influence of particle mass load on elbow wear under different St numbers was studied by (Pouraria et al., 2020) through gas-solid two-phase flow experiments. The results indicated that there exists a critical particle mass load beyond which the wear rate of the elbow gradually declines. Moreover, the study found that the critical particle mass load of low St number flow is larger. (Bilal et al., 2021). used the paint removal method to investigate the wear of elbows with bending angles of 45° and 90° under curvature radii of 1.5D, 2.5D, and 5D based on multiphase flow. The results revealed that the wear rate declines with increasing bend radius. (Zhao et al., 2023).studied the influence of the sealing structure of the front chamber of the slurry pump on its sealing surface wear characteristics, and the research results provide a certain reference for the anti wear design of pipelines. (Li et al., 2023).research provides a certain reference for further optimizing hydraulic and structural design, and improving wear conditions. (Zeng et al., 2014). used array electrode technology to measure the wear rate at different positions of the X65 pipe elbow. This experiment provides a reference for the accuracy verification of the wear model in this paper. (Jia et al., 2021). studied the influence of gas velocity and fluid PH on the wear of a 90° elbow during the transport of gas-liquid-solid three-phase flow. The most serious wear areas were found to be the axial angle of the elbow between 20° and 50°, while the opposite phenomenon was observed at the corresponding position between 50° and 70°.
Although the most realistic wear of the elbow can be reflected by experiments, the details of the interaction between particles-particles and particle-walls cannot be directly observed. With the continuous development of Computational Fluid Dynamics (CFD), the application of Discrete Phase Models (DPM) and Computational Fluid Dynamics coupled with Discrete Element Method (CFD-DEM) for predicting wear caused by solid particles in fluids is gradually increasing (Hu et al., 2019; Xu et al., 2020; Zhong et al., 2021). The effects of parameters such as pipe diameter, particle size, inlet velocity, particle mass flow rate, and bending diameter ratio on the wear of elbows were studied by (Peng and Cao, 2016) based on DPM. However, as DPM itself ignores the interaction between particles, the wear rate continued to increase as the mass flow rate increased, which contradicts the simulation results of (Zheng et al., 2008), and the lift force on the particles was not considered in the simulation process. (Duarte et al., 2017). studied the effect of wall roughness, friction coefficient, and particle mass load on the wear of elbow pipe in gas-solid two-phase flow using CFD-DEM. The results showed that the wear depth decreases with the increase of wall roughness and the particle mass load, and rises with the improvement of friction coefficient.
The influence of particles with different sphericity on gas-solid two-phase flow wear in the elbow was studied by (Zeng et al., 2018) based on CFD-DEM and E/CRC wear model. The results indicated the impact velocity and angle have a significant influence on the elbow wear, whereas when the sphericity is greater than 0.77, the elbow wear is mainly caused by the impact concentration. (Laín and Sommerfeld, 2019). used the Euler-Lagrangian method to study the influence of spherical particles under different mass loads on the wear of the elbow during pneumatic conveying. The results suggested that with the increase of the particle mass load, the collision frequency between particles and particle walls increases; however, the wear rate of the elbow declines due to the decrease of the particle collision velocity and angle.
(Farokhipour et al., 2020) employed the CFD-DEM coupling model and E/CRC wear model, the wear rate, collision speed, and frequency are selected as evaluation parameters to study the influence of mass loads on elbow wear during pneumatic conveying. The results presented that as the mass load increases, the wear of the pneumatic conveying system reaches saturation due to the low velocity and frequency of particles collision with the end region, which forms a “shield effect”. The wear characteristics of square pipes and round pipes during pneumatic conveying were investigated by (Zolfagharnasab et al., 2021) based on CFD-DPM coupling model, and it was discovered that the wear rate of square pipes is lower than that of circular pipes, especially under higher conveying speeds or larger particle size conditions. (Zhao et al., 2022). studied the effect of particle volume fraction on the wear of the elbow using the CFD-DEM and the E/CRC wear model. The study revealed that the wear rate of the outermost side of the elbow nonlinearly increases with the improvement of the particle volume fraction. However, when the particle volume fraction reaches a specific value, the wear rate no longer increases.
In summary, in gas-solid two-phase flow and solid-liquid two-phase flow, domestic and foreign scholars have conducted a large number of experiments and simulation studies on the influence of particle mass load, particle size, pipe diameter, and other factors on the wear of an individual elbow. At the same time, (Zhang et al., 2023). Compared the effects of three two-fluid turbulence models on the calculation results of solid phase concentration and velocity in circular tubes under different solid phase conditions and different inlet liquid phase velocities, which provided a calculation model reference for this article. (Sun et al., 2022b). Used the SSTk-ω turbulence model and Tabakoff abrasion model to study the abrasion laws of Francis turbines with high sand content. The research results provide a certain reference for the prevention of abrasion. (Bai et al., 2022). Chose the drag model in dense gas-solid two-phase flow to improve the accuracy of numerical simulation results. Based on the CFD-DEM two-way coupling method, they numerically simulated the gas-solid fluidized bed, which provided a certain direction for the research of this article. (Zhao et al., 2022). showed that compared with the Saffman and Magnus lift developed by gas-solid two-phase flow, the Loth lift is more suitable for particle motion in solid-liquid two-phase flow, and the pressure gradient force and virtual mass force are also particularly important for particle motion in solid-liquid two-phase flow. Therefore, the C++ programming language was utilized to improve the CFD-DEM coupling interface in this paper, the Loth lift, virtual mass force, and pressure gradient force were introduced for simulating solid-liquid two-phase flows. Meanwhile, the transient fluctuations of flow velocity were employed on the particle motion by using the DRW model. The accuracy of numerical simulation was verified through experiments of the previous research. Subsequently, the improved numerical model of solid-liquid two-phase flow is employed to investigate the wear characteristics of U-shaped elbow under different parameters such as elbow spacing, bending diameter ratio, particle volume concentration, and particle size, which can provide the theoretical value and engineering significance for reducing pipeline system failure.
2 CFD-DEM mathematical theory model
2.1 Fluid governing equations
In this paper, the incompressible fluid is employed, and the solution is based on the Reynolds time-averaged Navier-Stokes equations. Moreover, considering the high local particle volume fraction generated during the simulation, the continuity and momentum equations of the fluid can be formulated:
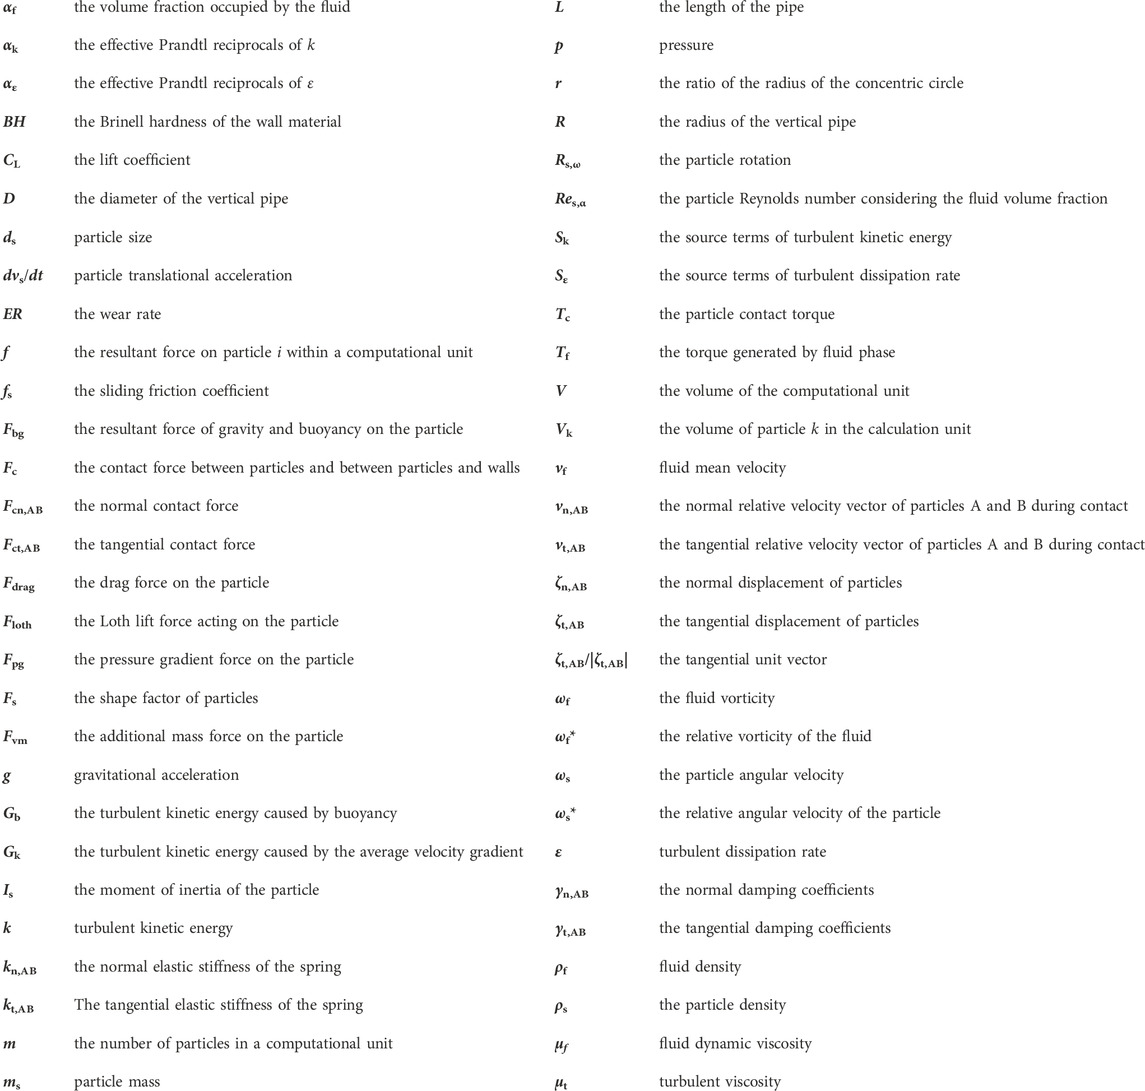
Where ρf represents the fluid density, vf represents fluid mean velocity, p stands for pressure, μf denotes fluid dynamic viscosity, μt signifies turbulent viscosity, f denotes the resultant force on particle i within a computational unit, m represents the number of particles in a computational unit, and V represents the volume of the computational unit. Additionally, αf represents the volume fraction occupied by the fluid and can be expressed as follows:
In the formula, Vk is the volume of particle k in the calculation unit. In this paper, the RNG k-ε turbulence model is adopted, and its turbulent kinetic energy and turbulent dissipation rate governing equations can be expressed as:
In the formula, k and ε are the turbulent kinetic energy and turbulent dissipation rate, Gk is the turbulent kinetic energy caused by the average velocity gradient, Gb is the turbulent kinetic energy caused by buoyancy, αk and αε are the effective Prandtl reciprocals of k and ε, respectively. αk = 1.00, αε = 1.20, Cε1 = 1.44, Cε2 = 1.92, Cε3 = Cε2CεpRes1.416, Cεp = 0.058, Sk and Sε are the source terms of turbulent kinetic energy and turbulent dissipation rate.
2.2 Particle governing equations
The equation of motion for a single particle is described by the following first-order ordinary differential equation:
In this formula, Fdrag represents the drag force on the particle, Fbg is the resultant force of gravity and buoyancy on the particle, Floth is the Loth lift force acting on the particle, Fpg stands for the pressure gradient force on the particle, Fvm denotes the additional mass force on the particle, and Fc denotes the force of contact between particles as well as between particles and the wall surface. Additionally, ωs is the particle angular velocity, Is the moment of inertia of the particle, Tc and Tf represent the particle contact torque and the torque generated by fluid phase, dvs/dt denotes particle translational acceleration, ms represents particle mass, and ds signifies particle size.
2.2.1 Di Felice drag force
The Di Felice drag force model is employed in the calculation (Di Felice, 1994), which considers the influence of fluid volume fraction and porosity on the drag force. The expression for this model is as follows:
Where Res,α represents the particle Reynolds number considering the fluid volume fraction, which can be expressed as follow:
The drag coefficient CD for spherical particles can be expressed by the following formula:
The calculation formula for drag coefficient CD of non-spherical particles adopts the research results of Haider and Levensoiel (Haider and Levenspiel, 1989):
In this formula, the calculation formulas for b1, b2, b3 and b4 are provided as follows:
2.2.2 The resultant force of gravity and buoyancy
The following formula can be used to express the resultant force of gravitational buoyancy:
In this formula, the particle density ρs and gravitational acceleration g are utilized.
2.2.3 Loth lift force
The Loth lift force is employed in this paper, the lift coefficient in the Loth lift (Zhao et al., 2021) is composed of shear and rotation lift coefficients. The expression for lift force is as follows:
The formula involves the fluid vorticity ωf and the lift coefficient CL, which can be expressed by the following formula:
In this formula, the relative vorticity ωf* of the fluid, the relative angular velocity ωs* of the particle, and the Reynolds number Rs,ω of the particle rotation are all included.
2.2.4 Pressure gradient force and virtual mass force
The pressure gradient force is induced by the movement of particles in a flow field with a pressure gradient, while the surface of the particle is subjected to the pressure difference generated when the fluid accelerates:
When the velocity of the particle is greater than the velocity of the surrounding fluid, the additional mass force is generated which can push the surrounding fluid to do accelerated motion:
2.2.5 Particle contact force
In EDEM, the Hertz-Mindlin (no slip) model is utilized for the contact force model between particles and walls. This model is bifurcated into normal contact force and tangential contact force via the soft-sphere model (Tarodiya and Gandhi, 2019). The corresponding ζn,AB and ζt,AB denote the normal displacement and tangential displacement of particles, respectively. Furthermore, Fcn,AB and Fct,AB represent the normal contact force and tangential contact force:
In this formula, kn,AB and kt,AB denote the normal elastic stiffness and tangential elastic stiffness of the spring, respectively. Moreover, γn,AB and γt,AB represent the normal and tangential damping coefficients, while vn,AB and vt,AB indicate the normal and tangential relative velocity vector of particles A and B during contact.
When the sliding friction is generated, the tangential contact force Fct,AB can be expressed as Coulomb friction:
Where fs is the sliding friction coefficient and ζt,AB/|ζt,AB| is the tangential unit vector.
2.2.6 Discrete random walk model
The application of the instantaneous fluctuation of flow velocity to drive particle movement is implemented in the DRW model utilized throughout this paper. It should be noted that in eddy currents, the instantaneous fluid velocity is comprised of both an average velocity and a fluctuation velocity:
By assuming that a Gaussian probability distribution governs turbulent fluctuation velocity, the following formula can be utilized for its expression:
In this formula, the random numbers ξi, ξj and ξk are governed by the Gaussian distribution. If the turbulent flow is isotropic, the root mean square (RMS) of fluctuating velocity can be calculated by:
Where k is the turbulent kinetic energy parameter, which can be calculated by the RNG k-ε turbulence equation.
2.2.7 E/CRC wear model
In the present paper, the E/CRC model is applied, which is developed by Zhang (Zhang et al., 2007) for predicting erosion in elbows, tees, and several other pipe fittings. The mathematical expression is provided as follows:
Where ER is the wear rate expressed by the wear amount of material under unit load per unit time (unit: kg/kg), BH is the Brinell hardness of the wall material, Fs is the shape factor of particles. Notably, the sharp particles are designated as Fs = 1, semicircular particles as Fs = 0.53, and round particles as Fs = 0.2. Furthermore, the empirical constants C = 2.17 × 10⁻⁷ and n = 2.41 are also utilized, α is the particle impact angle (unit: radian).
According to Formula 36, the value of F(ɑ) plays a dominant role in influencing the wear rate of the outer wall with the specific materials and working conditions. The relationship between F(ɑ) and ɑ is illustrated in Figure 1, it can be seen that F(ɑ) exhibits a trend of sharp increase followed by gradual decrease with the improvement of ɑ. Notably, when ɑ reaches approximately 50°, the corresponding value of F(ɑ) attains its maximum point, indicating that the wear rate is also maximum at this point.
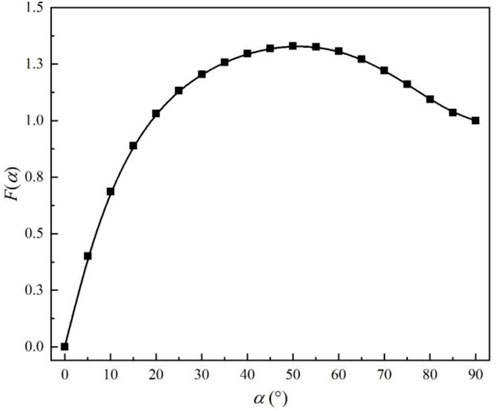
FIGURE 1. The relationship between F(ɑ) and ɑ.
3 Verification of solid-liquid two-phase flow model and wear model
3.1 Validation of solid-liquid two-phase flow model
Particle transport experiments in the vertical pipe are conducted by (Alajbegović et al., 1994), and the ratio of the radius of the concentric circle (r) to the radius of the vertical pipe (R) is defined as r/R. The particle velocity, fluid velocity, and particle volume fraction are measured in the vertical pipe. Notably, the diameter of vertical pipe D is 30.6mm, while the length of pipe L is 3060 mm. The Standard k-ε model is adopted in the turbulence model, with a turbulence intensity set at 3.5%. The grid height of the first wall layer is configured at 0.5mm, while the calculated y + range is kept within 30-40. Meanwhile, the particle is generated at the entrance in EDEM, with the particle entry time is 0.01s. The calculation time step is set at 2 × 10⁻⁵s in EDEM, and the velocity inlet (1.888 m/s) and the pressure outlet (1atm) are applied. The calculation time step is set at 2 × 10⁻⁴s in Fluent, the total simulation time is 4s, the detailed calibration parameters of relevant EDEM simulations are included in Table 1, while the vertical pipe model and grid division are shown in Figure 2.

TABLE 1. EDEM simulation parameters.
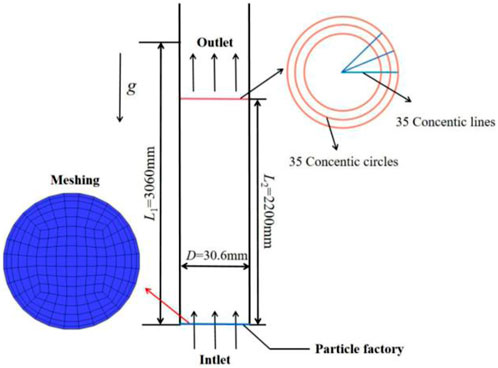
FIGURE 2. The model and structure grid of vertical pipe.
The balance of the particle number in the vertical pipe is attained within 1.8s. The section situated at a height of 2200 mm from the inlet is selected, and simulated data within the interval of 2–3s is collected at intervals of 0.1s. The section is divided into 35 points in both the circumferential and radial directions, thus forming a series of concentric circles consisting of point sets. The data on the corresponding concentric circles are averaged, and time-average processing is performed thereafter. Figure 3 illustrates the relationship between the particle volume fraction, velocity of particles, fluid velocity, fluid root mean square velocity and r/R. It can be observed that the trends of the simulated and experimental results are close and exhibit good agreement, it shows that the CFD-DEM mathematical model adopted in this paper can simulate solid-liquid two-phase flow more accurately.
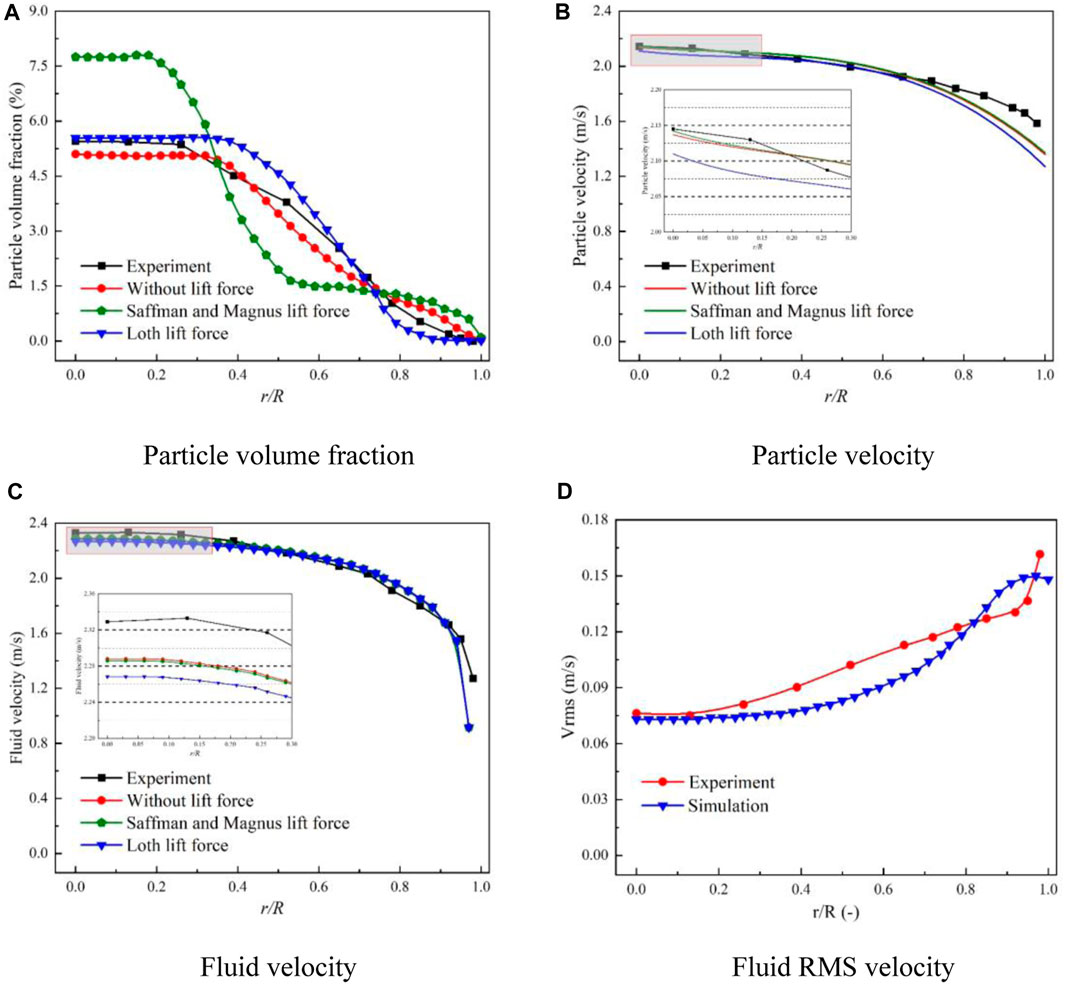
FIGURE 3. The experiment and simulation comparison of solid-liquid two-phase flow. (A) Particle volume fraction. (B) Particle velocity. (C) Fluid velocity. (D) Fluid RMS velocity.
3.2 Verification of wear model
The wear rate of different positions of the X65 elbow pipe is measured by Zeng et al. (Zeng et al., 2014) using the array electrode technology. In this study, a geometric model consistent with the experiment is established, in which the pipe diameter D is 50mm, the bending diameter ratio R/D is 1.5, and the horizontal section L1 is 20D, while the vertical section L2 is 15D. The RNG k-ε model is selected as the turbulence model, and the turbulence intensity is adjusted to 3.5%. The grid height of the first wall layer is set at 0.3mm, while the calculated y + range is controlled within 30-60, and the particle is generated at the entrance in EDEM, the particle entry time is 0.01s. Additional calibration details of EDEM simulation parameters can be found in Table 2. The elbow model and its grid division are displayed in Figure 4.
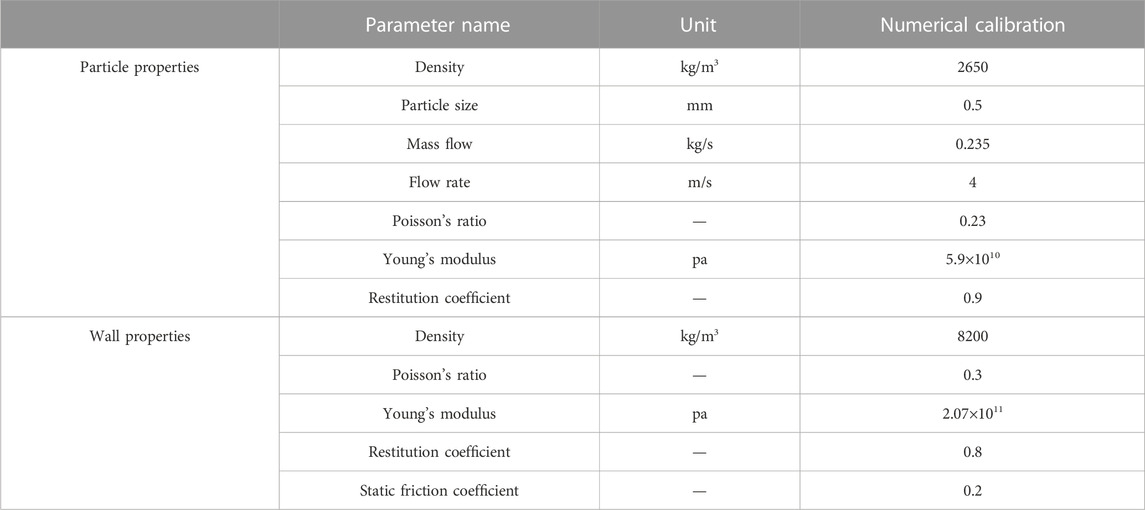
TABLE 2. EDEM simulation parameter calibration for 90° elbow.
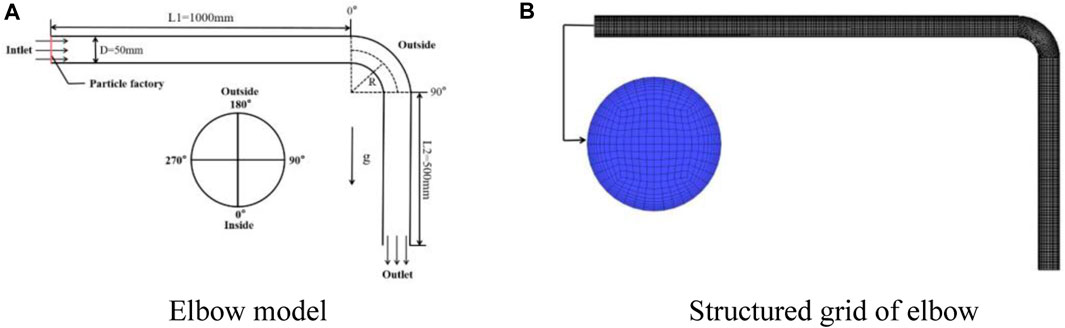
FIGURE 4. Wear model verification. (A) Elbow model, (B) Structured grid of elbow.
Figure 5 displays the experimental and simulation wear rate of the 90° elbow. Here, the azimuth angle that corresponds to the outermost side of the 90° elbow is defined as 180°. It can be observed from the figure that the trend of simulation and experimental results is similar, therefore, the wear of elbows can be more accurately predicted by adopting the E/CRC wear model.
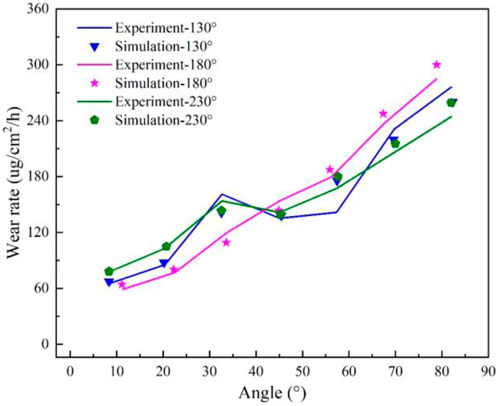
FIGURE 5. Comparison of wear experiment and simulation in 90° elbow.
3.3 Analysis of U-shaped elbow model
3.3.1 Geometric model of U-shaped elbow and simulation method
During the process of ore transportation, multiple elbows in series are frequently employed. In this paper, a U-shaped elbow has been established, wherein the two elbows are connected by horizontal and vertical pipelines. The initial value of the pipeline design parameters dictated that the diameter D of the elbow is 30mm, while the bending diameter ratio R/D of the two elbows is fixed at 1.5. Moreover, the distance L2 between the elbows is set as 7D, the water inlet vertical section L1 is designed to be 15D, and the water outlet vertical section L3 is specified to be 15D.
In this study, the turbulent flow model of RNG k-ε model is employed, the turbulent flow intensity is 5%, the calculated range of y + between 40 and 90. The particles are generated at the inlet in EDEM, where the particles started to generate from 0.01s. The wall wear rate is obtained through the E/CRC wear model. In Fluent, velocity inlet and pressure outlet are utilized. Notably, the outlet pressure is fixed at 1atm, and the calculation time step is established to be 1 × 10⁻⁴s. For calibration details of the basic parameters used in EDEM and Fluent, as shown in Table 3. Additionally, Figure 6 presents the U-shaped bend pipe model and the model of grid division.
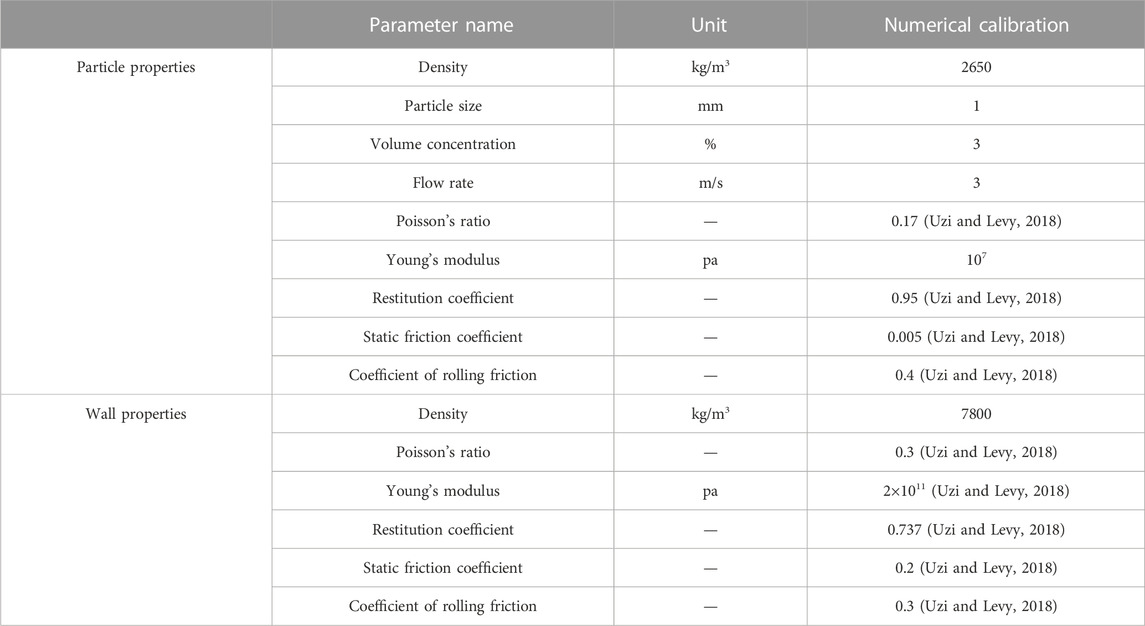
TABLE 3. Basic parameters for EDEM simulation of series elbows.
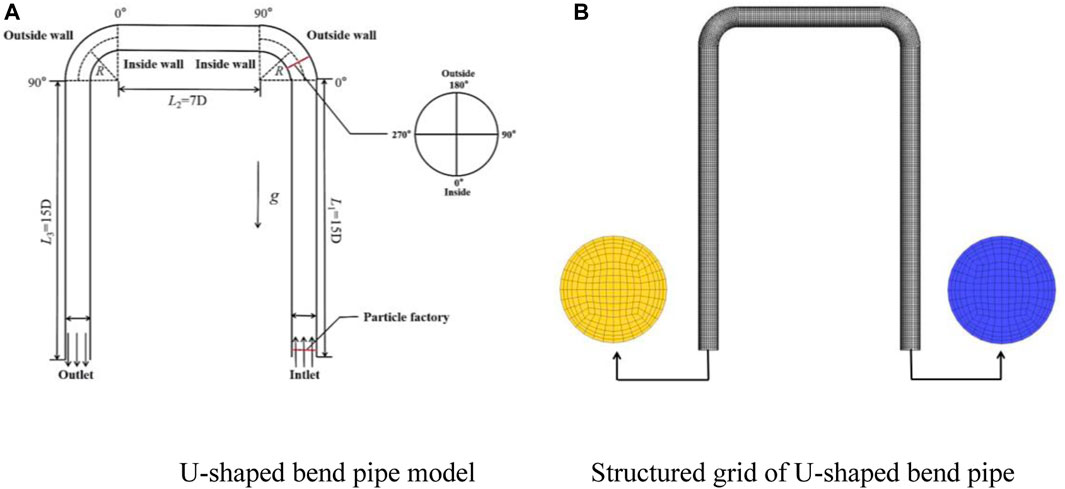
FIGURE 6. U-shaped bend pipe model and structured grid division. (A) U-shaped bend pipe model, (B) Structured grid of U-shaped bend pipe.
3.3.2 Independence verification of grid and simulation time
In this study, 81,599, 105,984, and 134,235 three sets of structural girds are established for the U-shaped elbows, by applying the data processing method of the vertical pipe section, the relationship between the fluid velocity of 0° and 90° section of the elbow 1 with the r/R ratio is obtained.
As depicted in Figure 7 (a) and (b), it indicated that the maximum relative error between the coarse grid and the medium grid is 4.21%, whereas the maximum relative error between the fine grid and the medium grid is 1.02% for the 0° section. Meanwhile, the maximum error between the coarse grid and the medium grid is found to be 3.21%, while the maximum error between the fine grid and the medium grid is measured to be 2.35% for the 90° section. Considering the computing resources, the fluid velocity of the medium grid at 0° and 90° sections is closer to the fine grid, it is deemed appropriate to adopt the medium grid for simulation calculations.
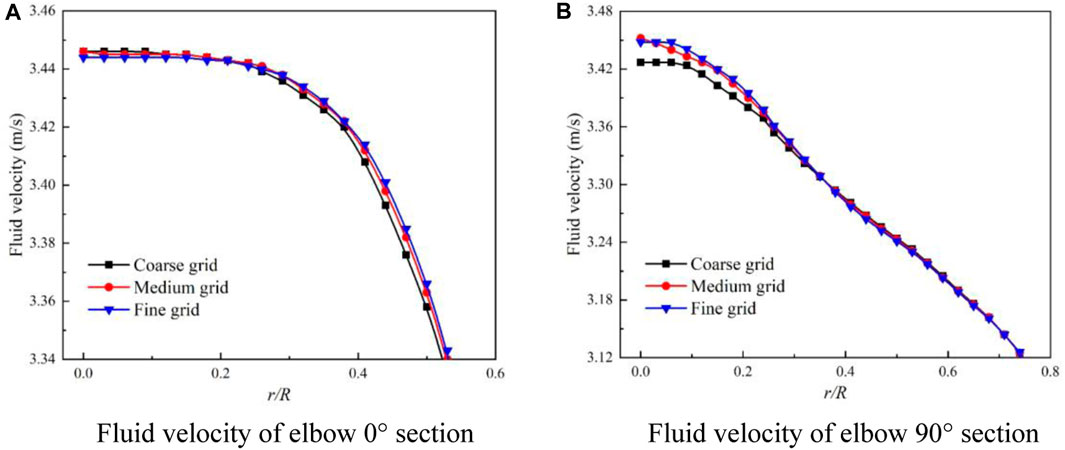
FIGURE 7. Independence verification of U-shaped elbow grid. (A) Fluid velocity of elbow 0° section, (B) Fluid velocity of elbow 90° section.
In order to evaluate the calculation time error in wear statistics, the simulation time of the U-shaped elbows is verified to be an independent factor. The particle size used for simulation is 1mm, with a corresponding volume fraction of 1%. The wear rate of the elbow 1 and elbow 2 is determined at 1s, 2s, and 3s respectively.
From Figure 8, it can be observed that the trend in wear rate for the outer side of elbow 1 and elbow 2 is similar when the simulation time is set at 1s, 2s, and 3s. Compared with the wear rate corresponding to 1s and 2s, the wear rate at 2s and 3s is found to be closer. Thus, in consideration of achieving high simulation accuracy while saving computational time, the simulation time is set as 2s.

FIGURE 8. Independence verification of simulation time. (A) Wear rate of the elbow 1, (B) Wear rate of the elbow 2.
4 Results and discussion
4.1 Effect of elbows spacing
Considering the ore transportation process, the distance between the elbows of the series pipelines is often adjusted according to the geographical location. Therefore, the effect of spacing between elbows on wear characteristics is analyzed. As shown in Figure 9A, the spacing model of 2D, 7D, and 12D are established, and the numerical simulations are conducted for transporting particles with a volume concentration of 3%, particle size of 1mm, and speed of 3 m/s through U-shaped elbows.
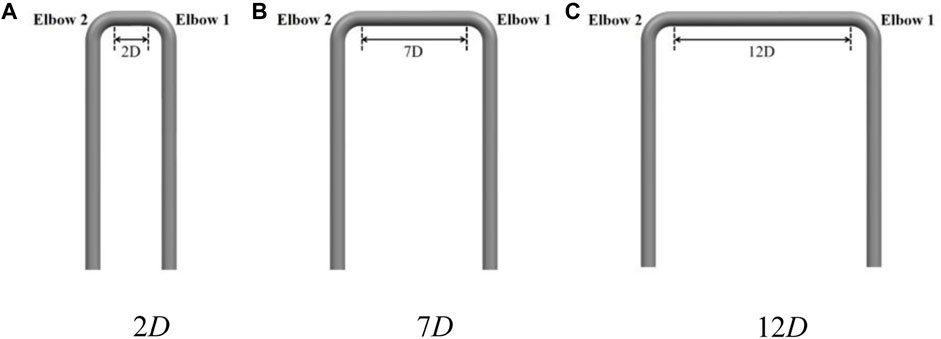
FIGURE 9. U-shaped elbows with different elbow spacing. (A) 2D, (B) 7D, (C) 12D.
In Figure 10A, the average impact frequency and wear rate of elbow 1 and elbow 2 different elbows spacing are shown. It can be observed that the average impact frequency (the average number of collisions between a particle and other particles per unit time) and wear rate (the amount of material wear under unit load per unit time) of elbow 1 are generally consistent, while the average impact frequency and wear rate of elbow 2 exhibit a decreasing trend as the elbow spacing increases.
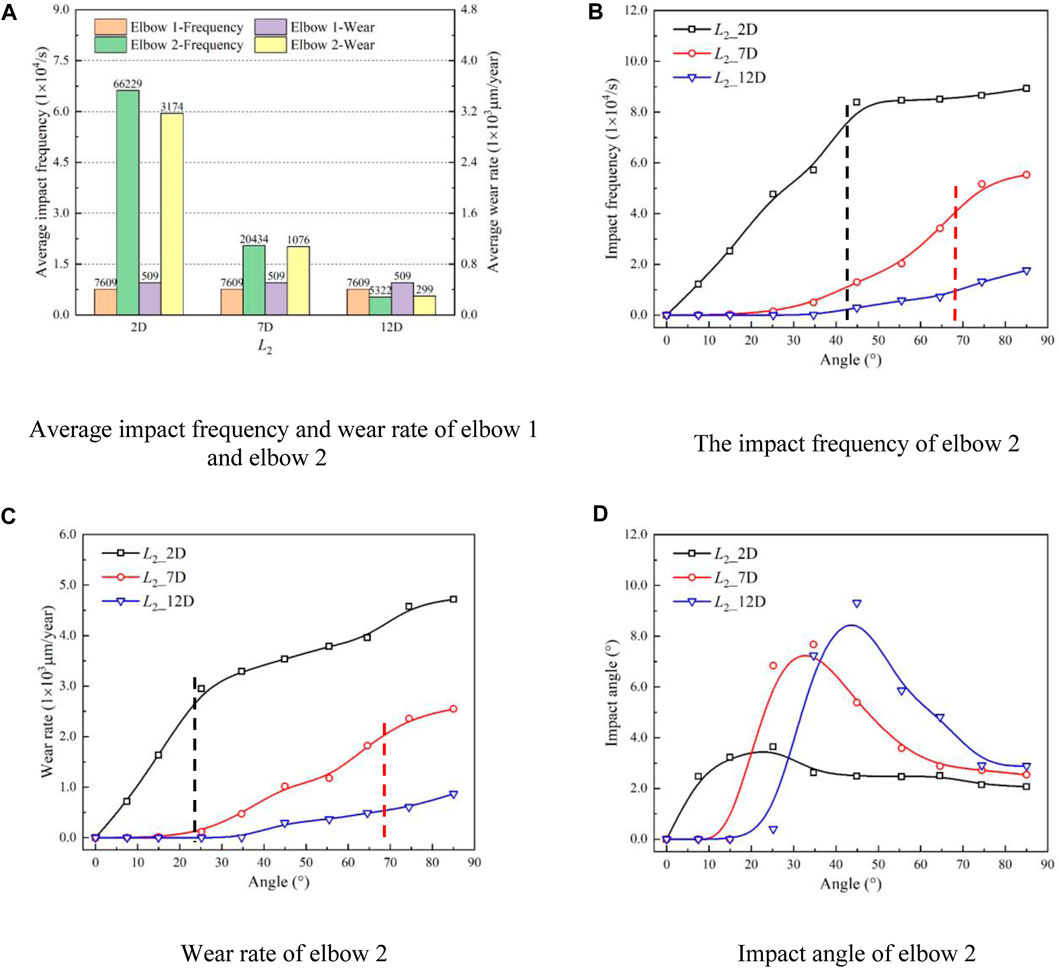
FIGURE 10. The wear characteristics of U-shaped bends under different elbow spacing. (A) Average impact frequency and wear rate of elbow 1 and elbow 2, (B) The impact frequency of elbow 2, (C) Wear rate of elbow 2, (D) Impact angle of elbow 2.
Furthermore, under the elbow spacing of 2D and 7D, the average impact frequency and wear rate of elbow 2 are much higher than elbow 1. Considering most of the particles concentrate on the outer wall after flowing through elbow 1, and insufficient flow is generated due to the short distance between the two elbows, the secondary flow generated by elbow 1 continues to develop with the mainstream, causing the fluid flow outward. What is more, the inertial effects of the particle are dominant compared to the gravity, which causes some particles to be entrained from the elbow inside to the outside, increasing the impact frequency between the particles and elbow 2.
However, when the distance between elbows is 12D, the average impact frequency and wear rate of elbow 2 are much lower than elbow 1. Due to the distance between elbows being too long, the flow is relatively sufficient, and the influence of the secondary flow gradually weakens. The gravity of the particles dominates compared to the inertial effect, causing the particles to settle, and the contact between the particles and the wall decreases. Furthermore, with increasing elbows distance, the number of particles flowing through elbow 2 gradually decreases, and the impact frequency reduces significantly. Therefore, the corresponding average impact frequency and wear rate decrease as the distance between the elbows increases.
Figure 10B, (c), and (d) show the relationship between the outer wall impact frequency, wear rate, and collision angle of elbow 2 with bending angle under different elbow spacing. It can be observed that the impact frequency and wear rate increase with improving bending angle, and significantly decrease with increased elbow spacing. Additionally, for elbow spacing of 2D and 7D, the growth trend of impact frequency and wear rate exhibits a sharp increase at first followed by a slow increase.
When the spacing is 2D, the impact frequency after 50° bending angle and the wear rate after 30° bending angle present the slow increasing trend. When the spacing is 7D, the starting position of the slow increasing range of the impact frequency and wear rate is relatively backward, and the corresponding bending angle is 75°. However, when the spacing is 12D, the impact frequency and wear rate present the slow increasing trend. Additionally, due to the influence of gravity, the particles settle is generated under 7D and 12D elbows spacing, which results in decreasing contact frequency between particles and wall surfaces. Therefore, the impact frequency, wear rate, and impact angle of elbow 2 from 0° to 15° bend angle cannot be found. Starting from 15°, particles impact the pipe wall at a certain angle, increasing the contact frequency between particles and wall surfaces, consequently causing the improvement of impact frequency and wear rate.
However, in contrast to the impact frequency and wear rate, the impact angle initially increases and then decreases as the bending angle improves, and the maximum impact angle and corresponding bending angle are enhanced as the elbows spacing increases. When the spacing is 2D, a hump appears near the bending angle of 25°, accompanied by a corresponding impact angle of 3.6°. Similarly, when the spacing is 7D, a hump appears near the bending angle of 35°, with a corresponding impact angle of 7.7°. Finally, when the spacing is 12D, a hump emerges near the bending angle of 45°, with a corresponding impact angle of 9.3°.
Furthermore, the impact angle becomes more stable closer to the elbow outlet after the hump. Figure 11 shows the particle trajectories, particles settlement is generated under the effect of gravity. With the increasing of elbows spacing, the settlement height is higher, which differs from the contact form of 2D spacing. Therefore, as the corresponding bending angle and maximum impact angle increase, the impact angle after the hump also increases, and the falling curve of the impact angle becomes steeper. Moreover, Eq. 36 indicates that when the impact angle is less than 50°, the value of F(ɑ) increases as the impact angle increases, leading to an improvement in the corresponding wear rate. However, due to the influence of impact frequency, the wear rate under different elbow spacing exhibits a downward trend.
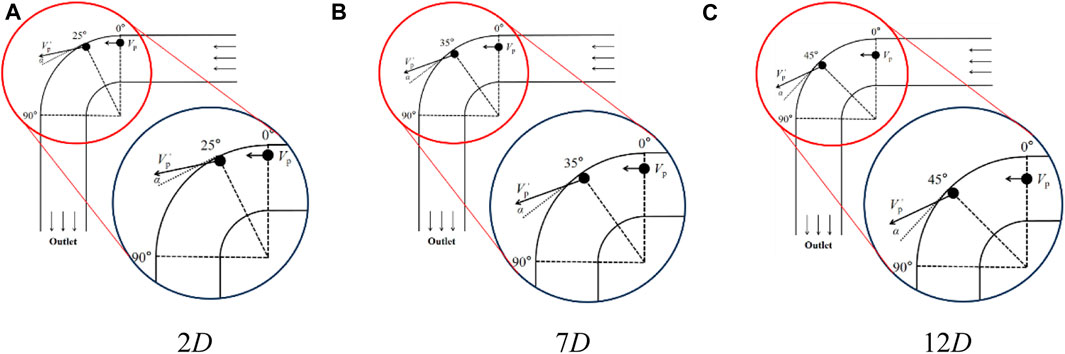
FIGURE 11. Schematic diagram of particle collision under different elbow spacing. (A) 2D, (B) 7D, (C) 12D.
4.2 Effec t of bending diameter ratio
The bending diameter ratio represents the bending degree of the elbow and is expressed as R/D, as shown in Figure 12. The fluent flow field of the elbow can be obtained with a larger bending diameter ratio. In this paper, the wear characteristics of the U-shaped elbow with different bending diameter ratios are analyzed, the transport velocity is 3 m/s, particle volume concentration of 3%, and particle diameter of 1 mm are employed, Figure 13 (a) and (b) show the impact frequency and wear rate of elbow 1.
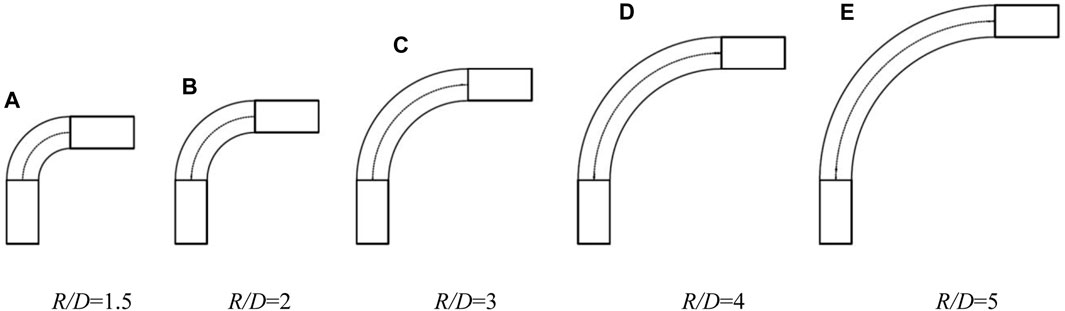
FIGURE 12. Schematic diagram of different bend diameter ratios for the same pipe diameter. (A) R/D=1.5, (B) R/D=2, (C) R/D=3, (D) R/D=4, (E) R/D=5.
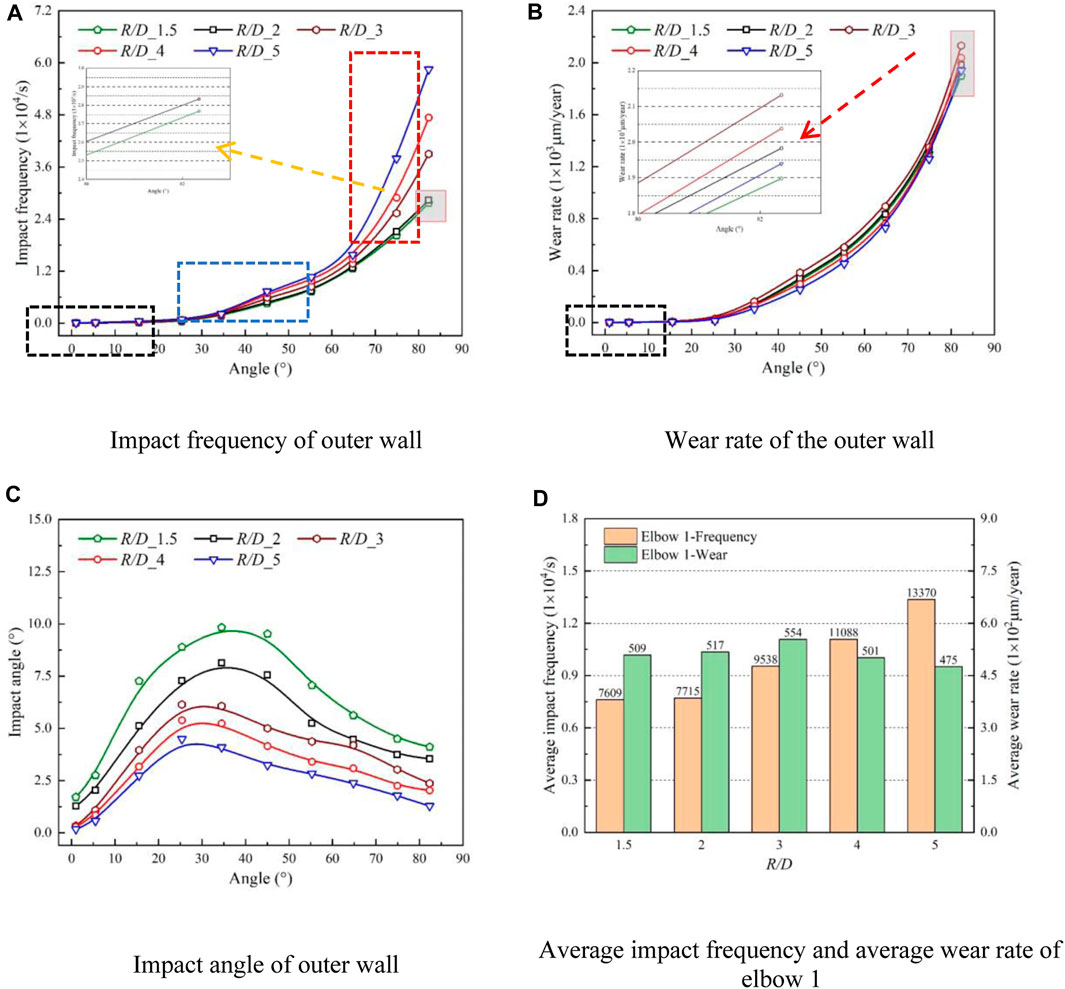
FIGURE 13. Wear characteristics of elbow 1 with different bending diameter ratios. (A) Impact frequency of outer wall, (B) Wear rate of the outer wall, (C) Impact angle of outer wall, (D) Average impact frequency and average wear rate of elbow 1.
As the bending diameter ratio increases from 1.5 to 5, the particle-wall collision area and impact frequency gradually increase, and the curves corresponding to different bending diameter ratios exhibit three growth regulations with the increases of bending angle.
As shown in Figure 13 (a), the slow growth zone is the bend angle from 0° to 35°, where the pipe wall is parallel to the particle motion direction, resulting in less contact between the particles and the wall surface. Therefore, the impact frequency remains close to 0. The medium speed growth zone ranges from 35° to 65°, and the pipe wall and particle movement direction form a certain angle. As particle-wall contact increases, the particles collide with the outer wall surface, which results in the improvement of impact frequency. The rapid growth zone extends from 65° to 83°, where continuous collisions occur between particles and the outer wall, intensifying particle-wall contact and resulting in a sharp increase in impact frequency.
As the bending diameter ratio increases from 1.5 to 3, the impact angle keeps decreasing, but the wear rate still increases. When the bending diameter ratio exceeds 3, the pipeline path becomes longer, allowing particles to pass through the elbow more smoothly, which leads to the decrease of the wall impact and further decreases the impact angle. Additionally, secondary flow is generated and persists for a longer duration with greater particle kinetic energy loss, and the wear rate presents a downward trend, the investigation result is consistent with the experimental findings of Farokhipour (Jia et al., 2021).
Furthermore, Figure 13C reveals the relationship between the impact angle and bending angle under different bending diameter ratios. As the bending diameter ratio increases, the bending degree of the elbow gradually decreases, and solid particles flow more smoothly. Consequently, the impact angle between the particles and wall is small, and the position of the maximum impact angle is closer to the elbow entrance with the increase of the bending diameter ratio.
Figure 14 displays the wear characteristics of elbow 2, the relationship between the impact frequency, wear rate, and impact angle with the bending diameter ratio remains consistent with elbow 1. However, compared to the elbow 1, the impact frequency increasing rate of elbow 2 gradually slows down as the bending diameter ratio increases. The impact angle of elbow 2 exhibits a relatively stable trend within the 65°–85° range, which has a similar variation trend under different elbows spacing.
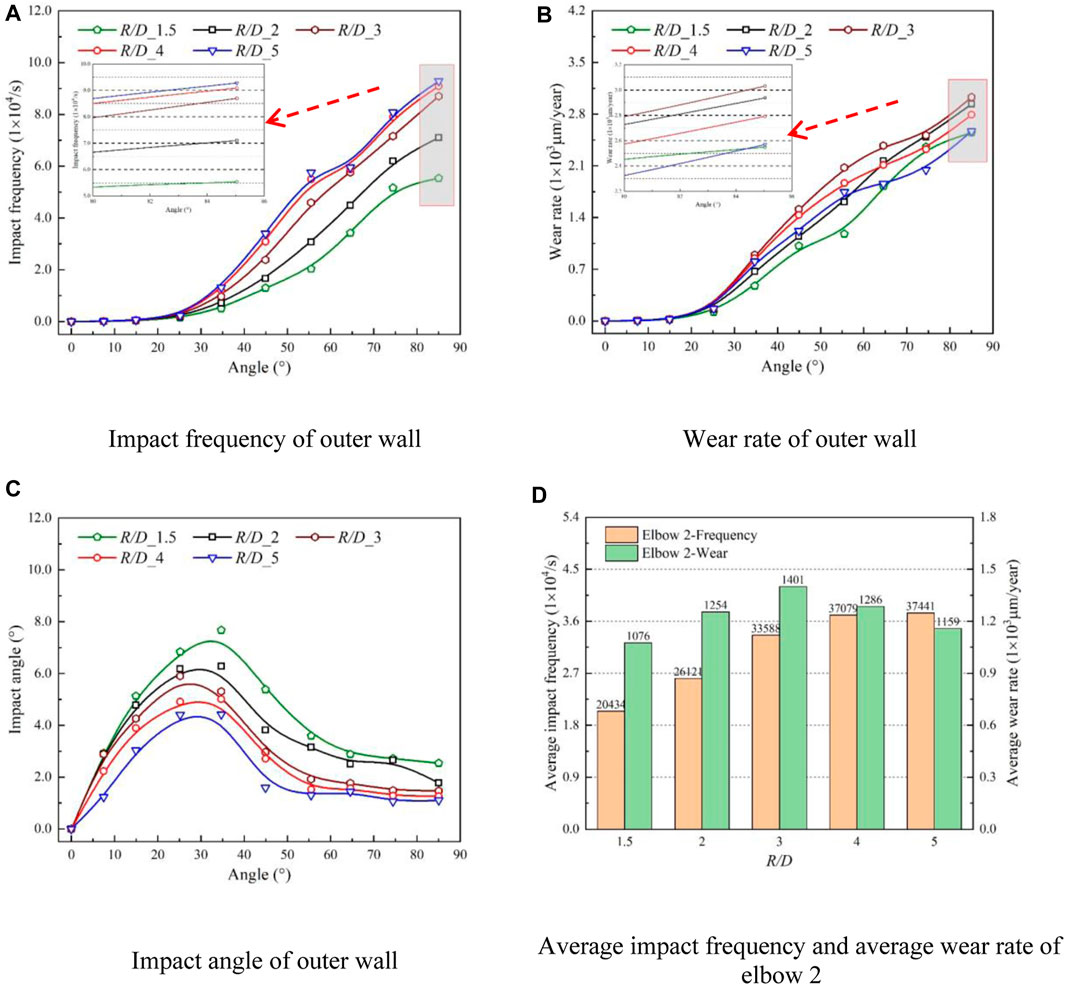
FIGURE 14. Wear characteristics of the elbow 2 with different bending diameter ratios. (A) Impact frequency of outer wall, (B) Wear rate of the outer wall, (C) Impact angle of outer wall, (D) Average impact frequency and average wear rate of elbow 2.
4.3 Effect of particle volume concentration
In pipeline transportation systems, particle mass loading is a crucial factor that significantly affects pipe wall wear. According to the previous research on the wear of gas-solid two-phase flow in pipeline transportation (Jia et al., 2021; Zhao et al., 2023), the shield effect (In particle flow, the shielding effect refers to the phenomenon where smaller particles are constrained by larger particles, preventing them from colliding with the pipeline walls. This reduces the wear on the pipeline walls and provides a certain level of protection) will form with the increases of particle mass loading, which results in the wear saturation. However, few studies have been conducted on this type of flow in solid-liquid two-phase flow. Therefore, the wear characteristics of U-shaped elbows under different particle volume concentrations are simulated in this article using 1 mm particle and 3 m/s flow velocity.
The wear characteristics of elbow 1 under different particle volume concentrations are presented in Figure 15. The corresponding growth rates under operating conditions of 0.5%-1%, 1%–3%, 3%–5%, and 5%–7% are defined as X1, X2, X3, and X4, respectively. It is observed from the results that the growth rate of the maximum impact frequency and wear rate on elbow 1 first increases and then decreases with the increase of particle volume concentration, and the impact frequency and wear rate exhibit a non-linear increase.
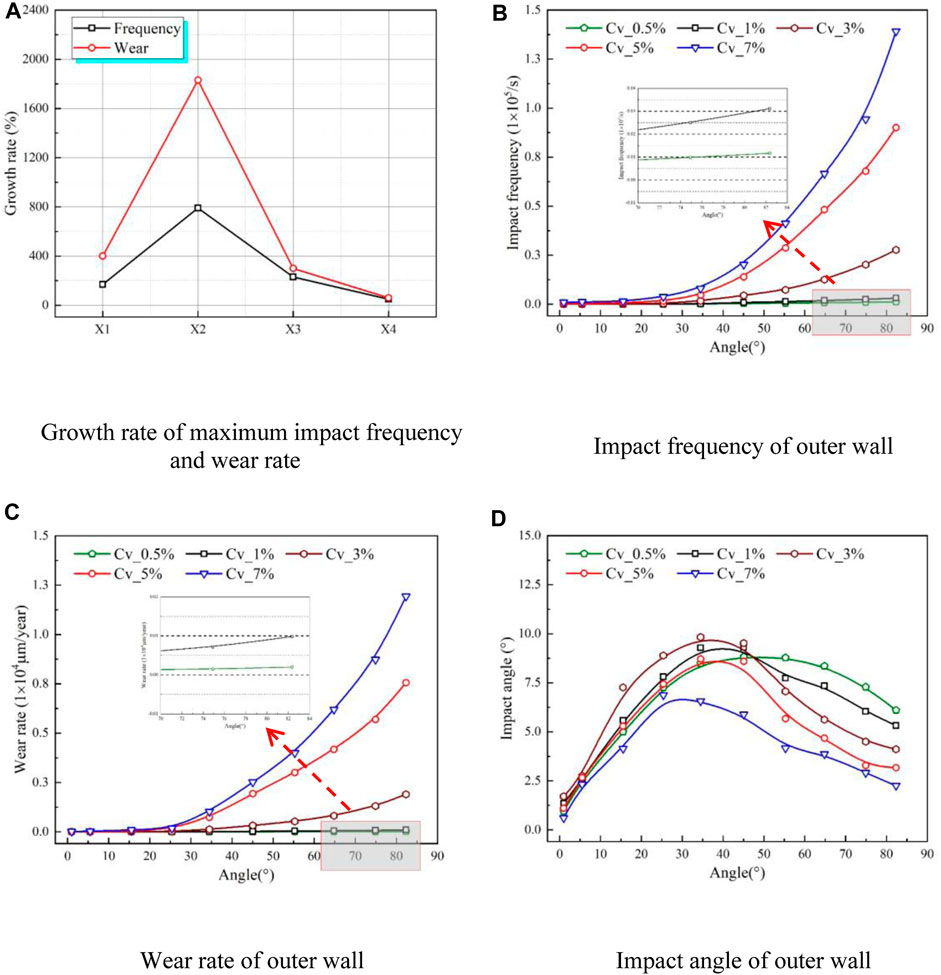
FIGURE 15. Wear characteristics of the elbow 1 under different particle volume concentrations. (A) Growth rate of maximum impact frequency and wear rate, (B) Impact frequency of outer wall, (C) Wear rate of outer wall, (D) Impact angle of outer wall.
When the particle volume concentration is 0.5%, the maximum impact frequency and wear rate are 1,162 times/s and 19.98 nm/year, respectively. As the particle volume concentration rises to 1%, the maximum impact frequency and wear rate increase to 3,110 times/s and 98.32 nm/year, respectively, with growth rates of 170% and 400% for impact frequency and wear rate, respectively. Further increasing the particle volume concentration to 3%, the maximum impact frequency and wear rate improved to 27,681 times/s and 1897.83 nm/year, respectively, with the impact frequency and wear rate showing significant increase and corresponding growth rates of about 790% and 1830%, respectively. With the particle volume concentration increase from 0.5% to 3%, more and more particles impact the wall, which leads to substantial increases in the impact frequency and wear rate, while the corresponding growth rate also reaches a peak.
When the particle volume is 5%, the maximum impact frequency and wear rate are 90,047 times/s and 7556.07 nm/year, respectively. The impact frequency and wear rate are still increasing, but the growth rates decline by about 230% and 300%, respectively. When the particle volume concentration is further increased to 7%, the maximum impact frequency and wear rate reach 139,135 times/s and 11,931.82 nm/year, respectively, with the growth rates of the impact frequency and wear rate further reduced by about 50% and 60%.
This phenomenon is contributed to the improvement of the particle volume concentration, the particle impact at the outer wall, and bounces at a certain angle, which strikes the ensuing particle. So the particles adjacent to the wall form a “virtual barrier” that inhibits the surrounding particles impacting the elbow wall directly, thereby reducing the impact frequency between particles and the elbow wall. This process is further enhanced with an increase in particle volume concentration, which slows down the acceleration of the impact frequency and wear rate.
Figure 15D displays the relationship between the wall impact angle with particle volume concentration and bending angle. When the bending angle increase from 0° to 50°, the impact angle initially increases and then decreases with the improvement of particle volume concentration. Furthermore, when the bending angle is within the range of 50°-90°, particles near the wall exchange momentum with incoming particles, moving toward areas of high particle volume concentration and impacting with the wall again at a lower impact angle. Consequently, the impact angle decreases with an increase in particle volume concentration, thereby further slowing down the increase of wear rate.
Figure 16 displays the wear characteristics of elbow 2, which is the same as that of elbow 1, and the corresponding growth rates under the conditions of 0.5%-1%, 1%–3%, 3%–5%, and 5%–7% are defined as X5, X6, X7, and X8, respectively. As shown in Figure 16 (a), the results indicate that as particle volume concentration increases, the growth trend of the maximum impact frequency and wear rate on elbow 2 are consistent with elbow 1. Most of the particles are concentrated on the outer wall, which leads to the peak value of impact frequency and wear rate of elbow 2 being higher than in elbow 1 b y 1,520% and 5030%, respectively. The corresponding decline rate of elbow 2 is also greater than elbow 1 b y 40% and 50%, respectively, indicating that the “shield effect” appears earlier in elbow 2 than in elbow 1. Secondly, as revealed in Figure 16. (b) and (c) that impact frequency and wear rate of elbow 1 increase with an improvement of bending angle. However, the growth trend of impact frequency and wear rate of elbow 2 exhibit a trend of sharp increase and then slow increase.
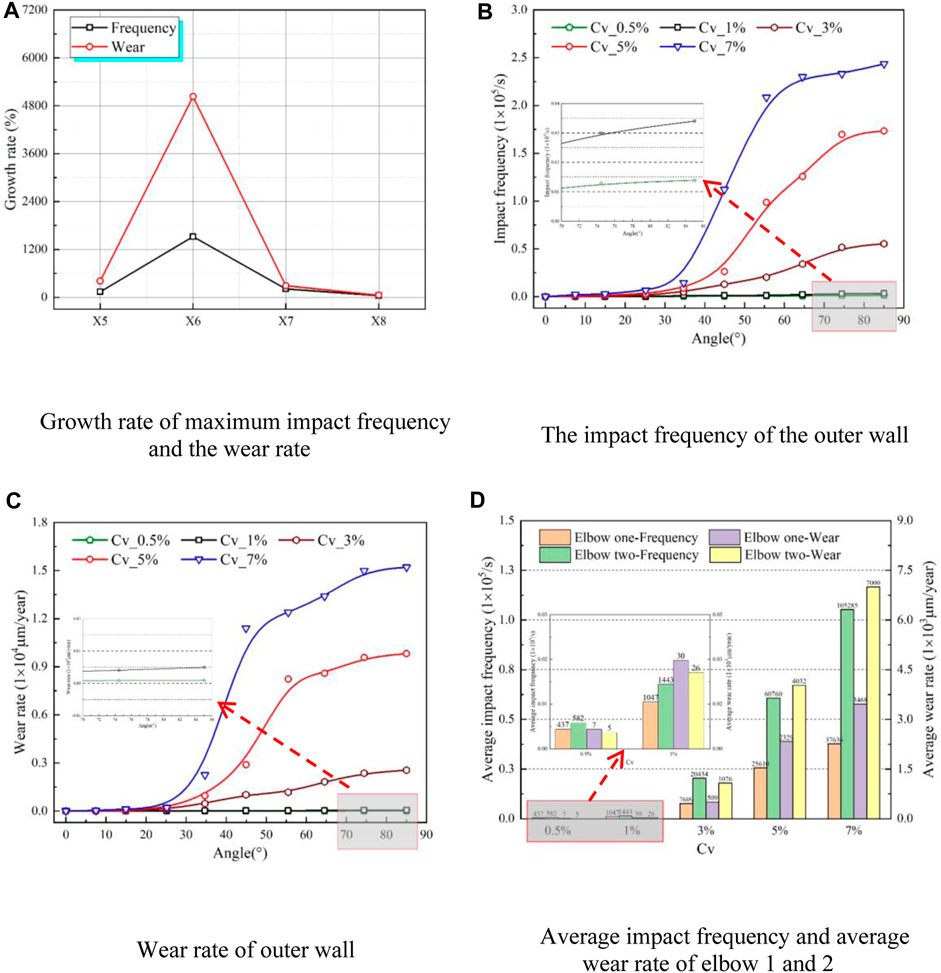
FIGURE 16. Wear characteristics elbow 2 under different particle volume concentrations. (A) Growth rate of maximum impact frequency and wear rate, (B) The impact frequency of the outer wall, (C) Wear rate of outer wall, (D) Average impact frequency and average wear rate of elbow 1 and 2.
Moreover, the transverse acceleration of particles is continuously influenced by the longitudinal secondary flow that develops alongside the main flow of solid-liquid two-phase flow transported by pipeline, thus hampering the particle acceleration process. Although the impact frequency increases slightly compared to elbow 1, the increase is not sufficient to produce a significantly higher wear rate than that of elbow 1. However, with an increase in particle concentration, the impact frequency between particles and the wall surface obviously increases, leading to a higher wear rate of elbow 2 compared to elbow 1.
4.4 Effect of particle size
In pipeline transportation, particle size is a crucial physical parameter. In this paper, the wear characteristics of U-shaped elbow with different particle sizes are simulated, the conveying speed is 3 m/s and the particle volume concentration is 3%. Figure 17 illustrates the wear characteristics of elbow 1 with different particle sizes. Considering the particle volume concentration is constant, the number of particles transported in the pipe declines with an increase in particle size. As a result, the contact position of the pipe wall moves relatively backward, and the impact frequency accordingly decreases.
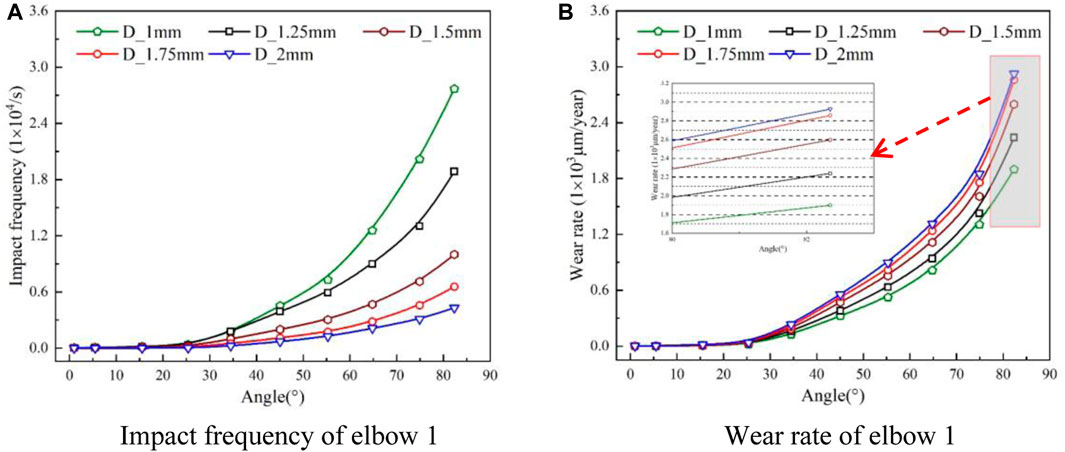
FIGURE 17. Wear characteristics of the elbow 1 under different particle sizes. (A) Impact frequency of elbow 1, (B) Wear rate of elbow 1.
The wear rate exhibits an upward trend with an increase in particle size, this phenomenon is attributed to the increase of particle size, which leads to the decrease of particle number and momentum loss of particle collisions. Furthermore, the influence of inertial force on particle movement is gradually enhanced, but the influence of the secondary flow effect at the elbow on particle movement is weakened, and the particles gradually move away from the streamline. At the same time, under the effect of the inertial force, the particles directly impact the outer wall of the elbow 1, causing serious wear on the outer wall. Nonetheless, as the impact frequency decreases with the improvement of particle size, the growth rate of the wear rate gradually slows down.
Figure 18 presents the impact frequency distribution of the elbow 1 for particle sizes of 1 mm, 1.5 mm, and 2 mm. It is observed that the collision areas are symmetrically distributed about the centerline of the pipeline, beginning from the bending angle of 45° and extending to the elbow outlet. As the particle size increases, the number of conveyed particles decreases, and the high-frequency collision area gradually transforms from an original steeple shape to a dot shape while the corresponding maximum impact frequency also gradually decreases. Meanwhile, the low-frequency collision area is gradually narrowed.
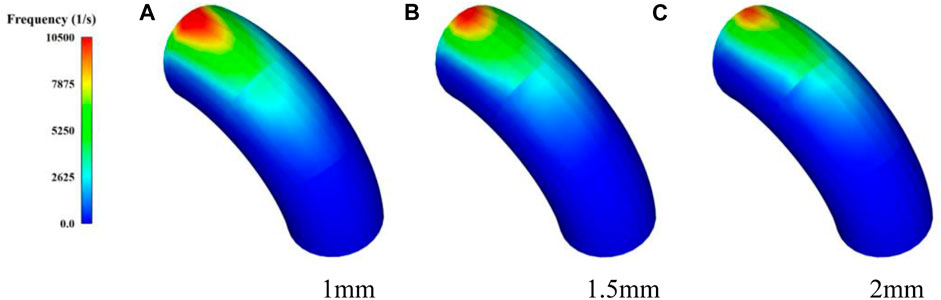
FIGURE 18. Impact frequency distribution of elbow1 under different particle sizes. (A) 1 mm, (B) 1.5 mm, (C) 2 mm.
Figure 19 shows the wear rate distribution of elbow 1. Consistent with the impact frequency distribution, the wear area is also symmetrically distributed about the centerline. The area of high wear area decreases with the increase in particle size. However, the influence of inertial force gradually dominates, leading particles to directly impact the elbow 1 outer wall, thus promoting the maximum wear rate. Specifically, when the particle size is 1mm, the maximum wear rate is 1897.83 nm/year, and the particle size is 1.5mm, and the maximum wear rate is 2596.77 nm/year. When the particle size is 2mm, the maximum wear rate is 2925.71 nm/year.
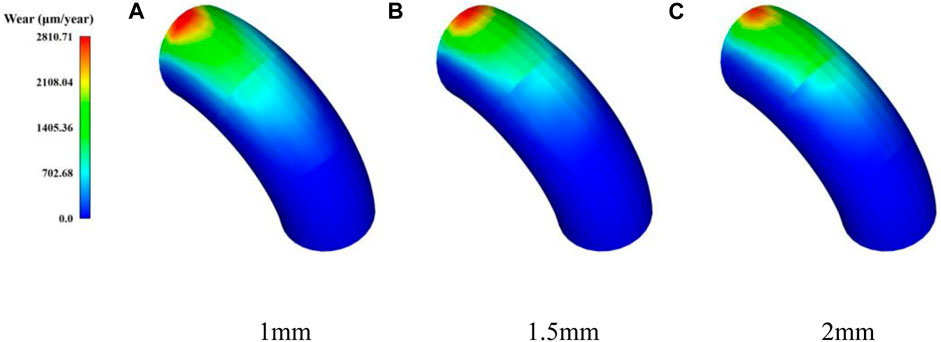
FIGURE 19. The wear rate distribution of elbow 1 under different particle sizes. (A) 1 mm, (B) 1.5 mm, (C) 2 mm.
In Figure 20, the wear characteristics of elbow 2 are presented. It is observed that the average impact frequency of the two elbows decreases with the improvement of particle size, the average impact frequency and wear rate of elbow 2 is larger than elbow 1. Moreover, the average wear rate of elbow 2 first increases and then declines with the improvement of particle size. In addition, the same as elbow 1, affected by the number of particles transported in the pipe, the impact frequency of elbow 2 also gradually decreases with the increase of particle size, and when the transport particle size is greater than 1mm, the impact frequency does not appear to increase sharply first and then slowly increasing trend, which is consistent with the delivery of low particle volume concentration.
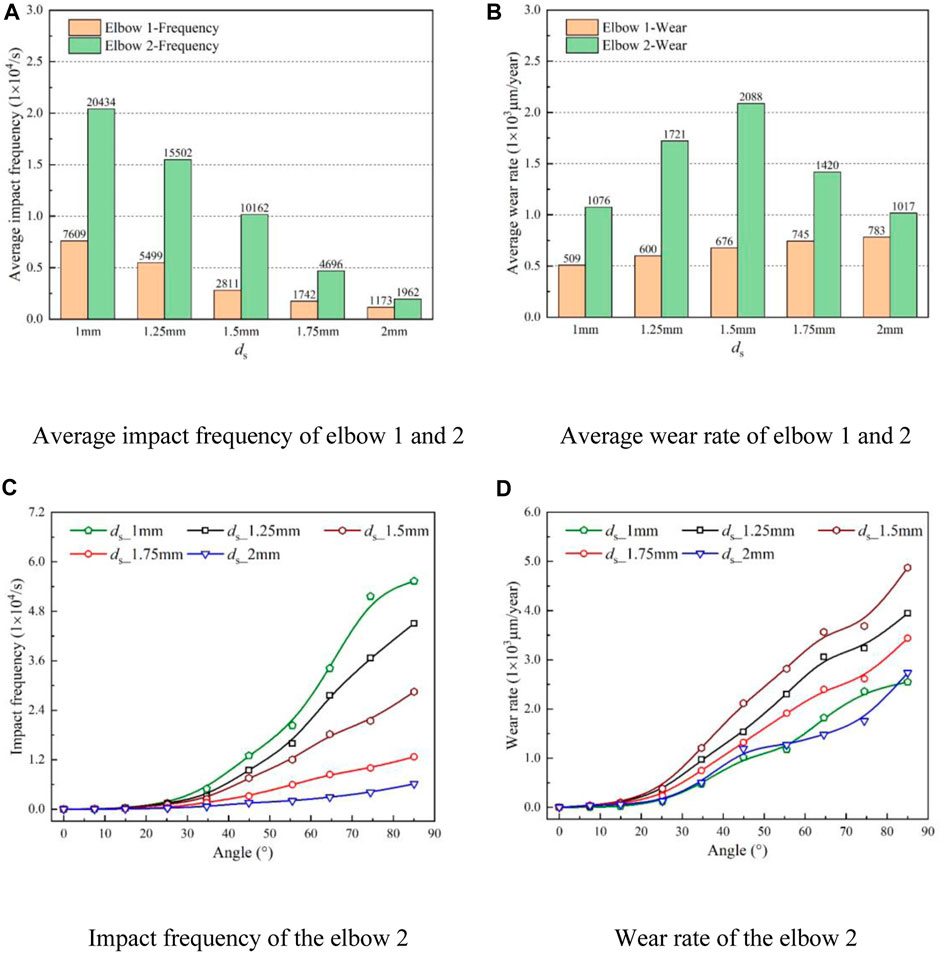
FIGURE 20. Wear characteristics of elbow 2 under different particle sizes. (A) Average impact frequency of elbow 1 and 2, (B) Average wear rate of elbow 1 and 2, (C) Impact frequency of the elbow 2, (D) Wear rate of the elbow 2.
However, the wear rate has the same variation trend as the average wear rate. The critical particle size is 1.5mm, when the particle size is below 1.5mm, the wear rate elevates with an increase in particle size whereas above this particle size, the trend declines. Furthermore, by comparing the wear rate of the pipeline when the particle size of 1 mm and 2mm, it found that the area of bending angle from 0° to 55° and elbow outlet, the wear rate of 2 mm particle is larger than 1 mm. Meanwhile, in the 55°–82° interval, the wear rate for the 2 mm particle size is less than that for the 1 mm particle.
Figure 21 presents the impact frequency distribution of elbow 2, the collision area is symmetrically distributed about the centerline. As the particle size increases, the high-frequency collision area gradually reduces, while the initial position of high-frequency collision shifts toward the elbow outlet. Since the particles are less affected by the secondary flow effect, the inertial force is enhanced, causing the initial collision area position to move toward the elbow inlet.
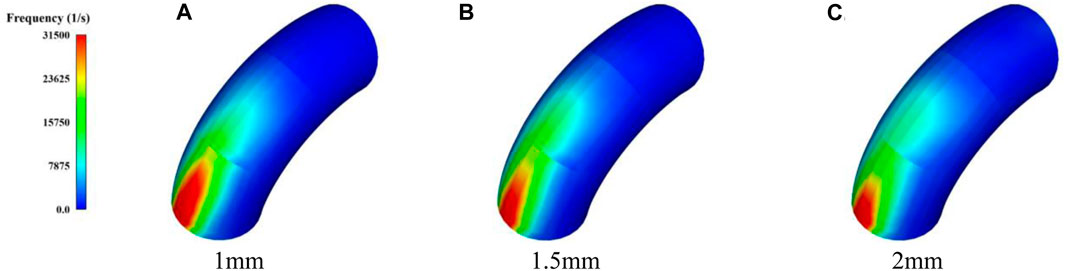
FIGURE 21. Impact frequency distribution of elbow2 under different particle sizes. (A) 1 mm, (B) 1.5 mm, (C) 2 mm.
In Figure 22, the wear rate distribution of elbow 2 is depicted, the wear area is symmetrically distributed about the centerline. The high wear areas are vase-shaped for particle sizes of 1mm and 1.5 mm while becoming spire-shaped for a particle size of 2 mm. Furthermore, the high wear area decreases as particle size increases, and the maximum wear rate shows a trend of initial increase and then decrease. When the particle size is 1mm, the maximum wear rate reaches 2548.47 nm/year, while for particle sizes of 1.5 mm and 2mm, the maximum wear rates are 4873.72 nm/year and 2733.96 nm/year, respectively. Similar to the collision area of elbow 2, the initial position of the wear area shifts towards the elbow inlet as particle size increases.
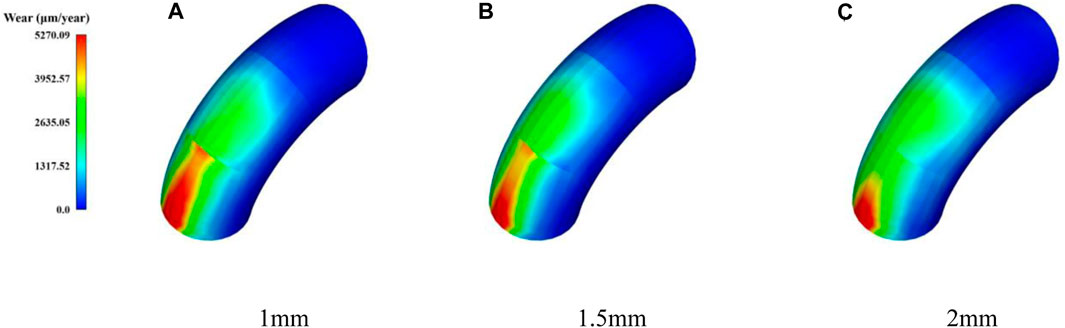
FIGURE 22. The wear rate distribution of elbow 1 under different particle sizes. (A) 1 mm, (B) 1.5 mm, (C) 2 mm.
5 Conclusion
The C++ programming language was utilized to improve the CFD-DEM coupling interface in this paper, and the Loth lift, virtual mass force, and pressure gradient force were introduced for simulating solid-liquid two-phase flows. Meanwhile, the transient fluctuations of flow velocity were employed on the particle motion by using the DRW model. The accuracy of numerical simulation was verified through experiments of the previous research. Subsequently, the improved numerical model of solid-liquid two-phase flow is employed to investigate the wear characteristics of U-shaped elbow under different parameters such as elbow spacing, bending diameter ratio, particle volume concentration, and particle size. The conclusions were obtained as follows:
Increasing the spacing between elbows enhances the effect of gravity on particles, leading to particle settling. The longer the elbow spacing, the higher the settlement, and the lower the position of particle impacts on elbow 2, resulting in increased corresponding bending angles and maximum impact angles. Due to the reduced number of particles inside the pipe, the collision frequency and wear rate decrease significantly, and this improvement in elbow spacing has no impact on Elbow 1. Additionally, under elbow spacing of 2D and 7D, the average impact frequency and wear rate of elbow 2 are much higher than those of elbow 1. When the elbow distance is 12D, the gravity of the particles dominates over the inertial effect, causing the average impact frequency and wear rate of elbow 2 to be much lower than those of elbow 1. Therefore, increasing the elbow spacing is beneficial for reducing wear in elbow pipes.
The improvement of the bending diameter ratio denotes that particles need to traverse a longer pipeline path, thus resulting in larger particle-wall collision areas and gradually increasing impact frequency, the curves corresponding to different bending diameter ratios exhibit three growth regulations of the wear rate. Further, the reduction of the bending degree of the elbow makes the flow of solid particles smoother, and the particles impact the wall at a smaller angle, and the secondary flow will occur earlier and last longer, which will have a greater impact on the kinetic energy loss of the particles, and the wear rate presents the downward trend. Therefore, with the increase of the bending diameter ratio, the wear rate will continue to decrease, and the use of larger-diameter elbows is beneficial to reduce elbow wear.
Considering the influence of inertial force on particle movement is gradually enhanced, the particles move away from the streamline and impact the outer wall of the elbow 1, causing serious wear on the outer wall. Nonetheless, as the impact frequency decreases with the improvement of particle size, the growth rate of the wear rate continually slows down. Additionally, the critical particle size is 1.5 mm, when the particle size is below 1.5mm, the wear rate elevates with an increase in particle size whereas above this particle size, the trend declines. Moreover, with the increase of the particle size, the particles are less affected by the secondary flow effect, and the inertial force is enhanced, causing the initial collision area position to move toward the elbow 2 inlet.
Data availability statement
The original contributions presented in the study are included in the article/supplementary material, further inquiries can be directed to the corresponding authors.
Author contributions
HC: Writing–original draft, Investigation. GJ: Investigation, Writing–review and editing. DY: Data curation, Writing–original draft. GP: Methodology, Writing–original draft. SH: Validation, Writing–original draft. JD: Methodology, Writing–review and editing.
Funding
The author(s) declare that no financial support was received for the research, authorship, and/or publication of this article.
Acknowledgments
The authors gratefully acknowledge the support from Open Research Subject of Key Laboratory of Fluid Machinery and Engineering (Xihua University) grant number LTJX 2021-003; Open Research Subject of Hubei Key Laboratory of Hydroelectric Machinery Design and Maintenance (China Three Gorges University) grant number 2020KJX07; the 69th batch of general funding from the China Postdoctoral Science Foundation grant number: 2021M691298; Natural Science Research Project of Jiangsu Province Colleges and Universities: 21KJB570004, Priority Academic Program Development of Jiangsu Higher Education Institutions (PAPD).
Conflict of interest
DY was employed by Chongqing Pump Industry Co Ltd.
The remaining authors declare that the conduct of this research does not involve any business or financial relationship that could be interpreted as a potential conflict of interest.
Publisher’s note
All claims expressed in this article are solely those of the authors and do not necessarily represent those of their affiliated organizations, or those of the publisher, the editors and the reviewers. Any product that may be evaluated in this article, or claim that may be made by its manufacturer, is not guaranteed or endorsed by the publisher.
References
Ahlert, K. R. (1994). Effects of particle impingement angle and surface wetting on solid particle erosion of AISI 1018 steel. Tulsa: University of Tulsa.
Alajbegović, A., Assad, A., Bonetto, F., and Lahey, R. (1994). Phase distribution and turbulence structure for solid/fluid upflow in a pipe. Int. J. Multiph. Flow 20 (3), 453–479. doi:10.1016/0301-9322(94)90021-3
Archard, J. F. (1953). Contact and rubbing of flat surfaces. J. Appl. Phys. 24 (8), 981–988. doi:10.1063/1.1721448
Bai, L., Han, C., Xu, Y. F., Zhou, L., Zhang, L. J., Shi, W. D., et al. (2022). CFD-DEM numerical simulation and experimental study of bubbling fluidized bed based on different drag force models. J. Drainage Irrigation Mech. Eng. 40 (01), 49–54.
Bilal, F. S., Sedrez, T. A., and Shirazi, S. A. (2021). Experimental and CFD investigations of 45 and 90 degrees bends and various elbow curvature radii effects on solid particle erosion. Wear 476, 203646. doi:10.1016/j.wear.2021.203646
Bitter, J. G. A. (1963a). A study of erosion phenomena part I. Wear 6 (1), 5–21. doi:10.1016/0043-1648(63)90003-6
Bitter, J. G. A. (1963b). A study of erosion phenomena: part II. Wear 6 (3), 169–190. doi:10.1016/0043-1648(63)90073-5
Di Felice, R. (1994). The voidage function for fluid-particle interaction systems. Int. J. Multiph. flow 20 (1), 153–159. doi:10.1016/0301-9322(94)90011-6
Duarte, C. A. R., de Souza, F. J., de Vasconcelos Salvo, R., and dos Santos, V. F. (2017). The role of inter-particle collisions on elbow erosion. Int. J. Multiph. flow 89, 1–22. doi:10.1016/j.ijmultiphaseflow.2016.10.001
Farokhipour, A., Mansoori, Z., Rasoulian, M. A., Rasteh, A., Saffar-Avval, M., and Ahmadi, G. (2020). Study of particle mass loading effects on sand erosion in a series of fittings. Powder Technol. 373, 118–141. doi:10.1016/j.powtec.2020.06.040
Finnie, I. (1960). Erosion of surfaces by solid particles. wear 3 (2), 87–103. doi:10.1016/0043-1648(60)90055-7
Finnie, I. (1979). The fundamental mechanisms of the erosive wear of ductile metals by solid particles. West Conshohocken, PA: ASTM Special Technical Publication, 36–58.
Haider, A., and Levenspiel, O. (1989). Drag coefficient and terminal velocity of spherical and nonspherical particles. Powder Technol. 58 (1), 63–70. doi:10.1016/0032-5910(89)80008-7
Hu, S., Zhang, X. M., Zheng, L., Zhao, B., Yang, N., Wang, M., et al. (2019). Correction to: morphological characterization and gene expression patterns for melanin pigmentation in rex rabbit. J. Drainage Irrigation Mach. Eng. 37 (09), 746–751. doi:10.1007/s10528-019-09934-0
Jia, W., Zhang, Y., Li, C., Luo, P., Song, X., Wang, Y., et al. (2021). Experimental and numerical simulation of erosion-corrosion of 90° steel elbow in shale gas pipeline. J. Nat. Gas Sci. Eng. 89, 103871. doi:10.1016/j.jngse.2021.103871
Laín, S., and Sommerfeld, M. (2019). Numerical prediction of particle erosion of pipe bends. Adv. Powder Technol. 30 (2), 366–383. doi:10.1016/j.apt.2018.11.014
Li, W., Pan, Y. X., Li, H. M., Qi, H. D., Wu, P., Lu, D. L., et al. (2023). Research progress on flow characteristics and wear issues of solid-liquid two-phase flow centrifugal pumps. J. Drainage Irrigation Mach. Eng. 41 (02), 109–117.
Oka, Y. I., Okamura, K., and Yoshida, T. (2005). Practical estimation of erosion damage caused by solid particle impact: part 1: effects of impact parameters on a predictive equation. Wear 259 (1-6), 95–101. doi:10.1016/j.wear.2005.01.039
Oka, Y. I., and Yoshida, T. (2005). Practical estimation of erosion damage caused by solid particle impact: part 2: mechanical properties of materials directly associated with erosion damage. Wear 259 (1-6), 102–109. doi:10.1016/j.wear.2005.01.040
Peng, W., and Cao, X. (2016). Numerical simulation of solid particle erosion in pipe bends for liquid–solid flow. Powder Technol. 294, 266–279. doi:10.1016/j.powtec.2016.02.030
Pouraria, H., Darihaki, F., Park, K. H., Shirazi, S. A., and Seo, Y. (2020). CFD modelling of the influence of particle loading on erosion using dense discrete particle model. Wear 460, 203450. doi:10.1016/j.wear.2020.203450
Sun, G. Y., Zhang, Y. J., Zhang, R. Q., Wang, Y. C., and Mao, X. L. (2022b). Numerical prediction and analysis of Francis turbine abrasion in high sediment flow. J. Drainage Irrigation Mech. Eng. 40 (12), 1197–1203.
Sun, X. L., Liu, H. L., Tan, M. G., Wu, X. F., and Zhang, K. K. (2022a). Effect of mineral particle size on the wear characteristics of deep sea mining pumps. J. Drainage Irrigation Mech. Eng. 40 (11), 1097–1103.
Tarodiya, R., and Gandhi, B. K. (2019). Numerical simulation of a centrifugal slurry pump handling solid-liquid mixture: effect of solids on flow field and performance. Adv. Powder Technol. 30 (10), 2225–2239. doi:10.1016/j.apt.2019.07.003
Uzi, A., and Levy, A. (2018). Flow characteristics of coarse particles in horizontal hydraulic conveying. Powder Technol. 326, 302–321. doi:10.1016/j.powtec.2017.11.067
Vieira, R. E., Mansouri, A., McLaury, B. S., and Shirazi, S. A. (2016). Experimental and computational study of erosion in elbows due to sand particles in air flow. Powder Technol. 288, 339–353. doi:10.1016/j.powtec.2015.11.028
Wang, Q., Huang, Q., Wang, N., Wen, Y., Ba, X., Sun, X., et al. (2021). An experimental and numerical study of slurry erosion behavior in a horizontal elbow and elbows in series. Eng. Fail. Anal. 130, 105779. doi:10.1016/j.engfailanal.2021.105779
Wang, Y. Q., Su, X. H., and Zhu, Z. C. (2022). Flow field and coarse particle motion characteristics in deep-sea mining mixed transport pumps. J. Drainage Irrigation Mech. Eng. 40 (08), 800–806.
Wang, Y., Wang, X., Shang, P., Xu, Z., and Huang, Q. (2023). A numerical study of the slurry erosion in 90° horizontal elbows. J. Pipeline Sci. Eng., 100149. doi:10.1016/j.jpse.2023.100149
Xu, H., Wu, W. Y., Wang, Z. H., and Wang, Q. L. (2020). Hydraulic characteristics analysis and flow field calculation of inclined tee pipe based on CFD. J. Drainage Irrigation Mech. Eng. 38 (11), 1138–1144.
Zeng, D., Zhang, E., Ding, Y., Yi, Y., Xian, Q., Yao, G., et al. (2018). Investigation of erosion behaviors of sulfur-particle-laden gas flow in an elbow via a CFD-DEM coupling method. Powder Technol. 329, 115–128. doi:10.1016/j.powtec.2018.01.056
Zeng, L., Zhang, G. A., and Guo, X. P. (2014). Erosion–corrosion at different locations of X65 carbon steel elbow. Corros. Sci. 85, 318–330. doi:10.1016/j.corsci.2014.04.045
Zhang, Y., Reuterfors, E. P., McLaury, B. S., Shirazi, S., and Rybicki, E. (2007). Comparison of computed and measured particle velocities and erosion in water and air flows. Wear 263 (1-6), 330–338. doi:10.1016/j.wear.2006.12.048
Zhang, Z. C., Li, Y. P., and Chen, D. X. (2023). The influence of two-fluid turbulence model on the calculation of solid-liquid two-phase flow. J. Drainage Irrigation Mech. Eng. 41 (04), 376–383.
Zhao, H. B., Cao, Q., Kang, C., Mao, N., Zhen, W. W., Ren, L. B., et al. (2023). The effect of structural form on the wear characteristics of the sealing surface of the front chamber of a slurry pump. J. Drainage Irrigation Mach. Eng. 41 (03), 247–252.
Zhao, R., Zhao, Y., Si, Q., and Gao, X. (2022). Effects of different characteristics of the dilute liquid-solid flow on the erosion in a 90° bend. Powder Technol. 398, 117043. doi:10.1016/j.powtec.2021.117043
Zhao, R. J., Zhao, Y. L., Zhou, Y., and Zhang, D. S. (2021). Numerical simulation of coarse particle erosion characteristics of solid-liquid two-phase flow in 90° elbow. Journal of Huazhong University of Science and Technology. Nat. Sci. 49 (10), 47–52.
Zheng, Y. G., Yu, H., Jiang, S. L., and Yao, Z. (2008). Effect of the sea mud on erosion–corrosion behaviors of carbon steel and low alloy steel in 2.4% NaCl solution. Wear 264 (11-12), 1051–1058. doi:10.1016/j.wear.2007.08.008
Zhong, L., Feng, G. H., Zhang, J. C., and Wei, G. (2021). Influence rules of erosion and wear of sewage valves based on CFD numerical simulation. J. Drainage Irrigation Mech. Eng. 39 (02), 151–157.
Zolfagharnasab, M. H., Salimi, M., Zolfagharnasab, H., Alimoradi, H., Shams, M., and Aghanajafi, C. (2021). A novel numerical investigation of erosion wear over various 90-degree elbow duct sections. Powder Technol. 380, 1–17. doi:10.1016/j.powtec.2020.11.059
Glossary
Keywords: wear characteristics, two-phase flow, CFD-DEM, U-shaped elbows, elbow erosion
Citation: Chang H, Ji G, Yu D, Peng G, Hong S and Du J (2023) Research on wear characteristics of U-shaped elbows based on CFD-DEM coupling. Front. Energy Res. 11:1282739. doi: 10.3389/fenrg.2023.1282739
Received: 24 August 2023; Accepted: 10 October 2023;
Published: 26 October 2023.
Edited by:
Ran Tao, China Agricultural University, ChinaReviewed by:
Ye Changliang, Hohai University, ChinaFaye Jin, Tsinghua University, China
SHI Guangtai, Xihua University, China
Yongyao Luo, Tsinghua University, China
Copyright © 2023 Chang, Ji, Yu, Peng, Hong and Du. This is an open-access article distributed under the terms of the Creative Commons Attribution License (CC BY). The use, distribution or reproduction in other forums is permitted, provided the original author(s) and the copyright owner(s) are credited and that the original publication in this journal is cited, in accordance with accepted academic practice. No use, distribution or reproduction is permitted which does not comply with these terms.
*Correspondence: Hao Chang, Y2hhbmdoYW9AdWpzLmVkdS5jbg==; Guangjie Peng, cGdqQHVqcy5lZHUuY24=