 Wenwu Zhang1
 Longting Ding
95% of researchers rate our articles as excellent or good
Learn more about the work of our research integrity team to safeguard the quality of each article we publish.
Find out more
METHODS article
Front. Energy Res. , 31 October 2023
Sec. Sustainable Energy Systems
Volume 11 - 2023 | https://doi.org/10.3389/fenrg.2023.1277817
This article is part of the Research Topic Sustainable Road Infrastructure: Technologies and Assessments View all 14 articles
The interlayer bonding of an asphalt pavement significantly influences the mechanical properties and long-term durability of the pavement structure. In order to develop a rapid and comprehensive evaluation method for assessing the interlayer condition of asphalt pavements using 3D GPR, we propose the stacking peak ratio (SPR) method. This method involves stacking the ratio between the amplitude peak of the interlayer and that of surface reflection to evaluate the interlayer state. Comparative analysis with direct shear tests and field measurements leads us to draw several conclusions: the optimal test parameters for the SPR method are a stacking peak ratio at 35 ns with a residence time of 1 us; the SPR method is compatible with various bonding materials and pollution layers, demonstrating its ability to effectively assess the bonding state of asphalt pavements; field tests further validate that the SPR approach can identify insufficient layer bonding and predict potential flaws in advance. Through our test findings and data analysis, it is evident that this SPR approach provides theoretical support and technological assistance for promptly evaluating the bonding status in asphalt pavements.
As transportation power is consistently promoted, China’s transportation industry is rapidly expanding. Currently, China has 5.28 million kilometers of roadways, making it the largest country in the world in terms of its road network size (Yuan et al., 2023). The overall length of expressways among them is the longest in worldwide. Asphalt pavement is the primary component of China’s expressways. The interlayer interface is the part of the asphalt pavement’s upper, middle, and bottom layers that interact with one another (Zhang et al., 2018). Engineers utilize adhesive material between neighboring layers to enable perfect bonding between the layers during construction to ensure that each layer of the asphalt pavement can reach the ideal completely continuous state (Dawei et al., 2022). By minimizing the reflection crack caused by the subgrade, halting water erosion, and achieving good durability and structure-bearing capacity, a good bonding state can ultimately lengthen the life of the road (Cao and Al-Qadi, 2021). Traffic volume, especially heavy traffic, is outpacing the economic growth in China. Stripping damage, which is brought on by the interlayer bonding condition of the asphalt pavement, is prone to adverse stress conditions, resulting in an interlayer shear slip of asphalt pavement, and even pushing cracks, leading to pavement damage, which has a serious impact on the performance of roads in high-temperature summer weather and heavy traffic (Mohammad et al., 2002). Therefore, studying the bonding states between pavement structures is of great significance.
The cause of insufficient bonding between asphalt pavements may come from internal reasons such as the quality of asphalt or the aggregate, the mismatch between design structure parameters and engineering characteristics, or external causes such as interlayer adhesive pollution and dosage deviation of sticky material (Tashman et al., 2008). Under the cyclic loading of temperature and humidity changes, and heavy traffic repeatedly, the stripping damage occurred, which affected the performance of the pavement (Raouf and Williams, 2010).
In “Specifications for Design of Highway Asphalt Pavement” of China, only simple provisions are made on interlayer adhesive materials and related construction technologies. In contrast, the evaluation methodologies and indexes for the bonding state between asphalt surface layers are relatively poor. The typical evaluation method of the bonding state between pavement layers is the shear test, pulling test, torsion shear test, and other indoor tests (Jiang et al., 2020). Meanwhile, the test method of stretching and the torsion shear test of bonding strength between layers is stipulated in the field test methods of highway subgrade and pavement. Leng et al. designed a piece of new direct shear and oblique shear equipment, considering the test temperature and loading speed between the direct shear test method, and proposed shear strength and unit shear strength to verify each other to determine the asphalt pavement interlayer shear strength test technical parameters and the standard test method, by using the corresponding test method (Leng et al., 2011). To determine the indexes affecting the bonding condition of asphalt pavement, Mohamed et al. set different test temperatures, loading speed, bonding material, sprinkling amount, and other indexes with a direct shear equipment, which showed that the test temperature affected the most. When 70 # asphalt binder is used as a bonding material, the bonding strength is better than that of emulsified asphalt (Mohammad et al., 2002). To determine the optimal sprinkling amount of the adhesive layer material between asphalt pavement layers, Zhang et al. used interlayer shear equipment to test the interlayer shear strength of the asphalt pavement. The results show that when the adhesive layer material is SBS-modified emulsified asphalt, the optimal spreading amount is 0.6–1.0 L/m2, and the optimal content of SBS was 2.5% (Zhang, 2017). Wang et al. used a direct shear test to analyze the properties, sprinkling amount, load, and aging of the adhesive layer material of an asphalt pavement; the results show that the shear strength of the asphalt pavement is related to the contact area of the upper and the lower layers. After the external load and aging effect, the bonding strength between the layers and the shear strength of the whole road surface can be improved (Wang et al., 2017).
In recent years, ground-penetrating radar (GPR) technology has witnessed significant advancements and breakthroughs in radar hardware equipment, underground target identification, underground target imaging, and other related aspects as a rapidly evolving non-destructive testing technique. It finds extensive applications in thickness detection and underground disease detection among various fields. Sudyka et al., while evaluating the interlayer bonding state of the asphalt pavement, successfully employed air composite radar to detect horizontal cracks with widths of several millimeters under both dry and wet conditions. This study demonstrates the feasibility of utilizing GPR technology for assessing the bonding state of an asphalt pavement. By employing high-frequency radar coupled with a high-pass filter and Fourier filter techniques, potential invisible diseases within the asphalt pavement, such as gaps, interlayer bonding issues, or looseness, can be effectively eliminated from noise interference. Consequently, an evaluation index termed the “pavement internal damage condition index” is determined to assess the internal health status of asphalt pavements. Furthermore, it was observed that traffic directly influences the probability of interlayer bonding (Sudyka and Krysiński, 2011). The bonding state of an asphalt pavement was investigated by Wang Dawei et al. using three-dimensional ground exploration radar technology. It was observed that the peak amplitude of electromagnetic waves varied across different layers, enabling the evaluation of the asphalt pavement combination state based on reflection amplitudes less than 1.0 mm, indicating a reasonable combination, whereas reflection amplitudes exceeding 2.0 mm indicated weak interlayer bonding (Dawei et al., 2022).
In conclusion, the GPR detection method based on electromagnetic wave transmission–reception technology offers a rapid and convenient non-destructive approach for investigating the interlayer contact conditions in structural analysis, exhibiting distinct advantages over traditional field and laboratory tests (Ma et al., 2021). However, the existing form fails to effectively and promptly assess the overall condition of the layers (Dong et al., 2016). In a comprehensive investigation of indoor shear tests and field tests, we propose the stacking peak ratio approach using 3D GPR based on intrinsic analysis of an asphalt pavement’s amplitude characteristics. This article provides a theoretical framework for evaluating pavement bonding conditions, optimizing bonding materials, and improving interlayer operations.
The 3D GPR system utilizes an antenna to transmit electromagnetic waves for the detection of dielectric materials in underground objects. Its theoretical foundation is based on Maxwell’s equations, which study the propagation process of electromagnetic waves through reflection, scattering, and diffraction in various mediums to obtain relevant data about the measured object. The propagation process is significantly influenced by the material property known as the dielectric constant. Variations in the dielectric constant of different materials cause changes in the phase and amplitude of the passing electromagnetic wave, enabling identification of information about observed targets using the 3D GPR system. These changes are governed by a formula for obtaining reflection coefficient that depends on differences in relative dielectric constants among various materials, determining the amplitude of reflected waves when there is a polarity alignment between the reflected and incident waves.
The working principle of 3D GPR for detecting typical road structures is shown in Figure 1. The 3D ground exploration radar emits a high-frequency electromagnetic wave signal T, according to the corresponding reflection angle through the antenna0, and an electromagnetic wave emission signal T0. The component is reflected through the interface, where the reflection angle is θ0 = θ1. The amount of electromagnetic wave reflection received by the receiving antenna is R0. Because the dielectric constant of the pavement material is much greater than that of the air, a part of the unreflected electromagnetic wave signal energy is lost; only T1—the electromagnetic wave of the component—penetrates interface 1, and the refraction angle α0<θ0. The electromagnetic wave emission amount (T1) is reflected through interface 2, with R1—the electromagnetic wave of the reflected amount—being reflected at the interface. The reflected amount accepted by the receiving antenna is R4, where the electromagnetic wave reflection amount is T1<T0, R1<T1, R1<R4, an angle of refraction α0 = α1, and α1<θ2. Another T1—the electromagnetic wave of the component—penetrates through interface 2, and the base medium reaches interface 3. This process continues to lose part of the energy; T1—the electromagnetic wave for the element—is reflected by interface 3, passes through interface 2 and interface 1, and the reflection amount received by the radar antenna is R5, among R5<R3<R2, β0<α1<θ3, which completes an electromagnetic wave propagation cycle. In principle, if the medium between the interface is uniform and infinite and there is no foreign matter, the energy loss of the transmitted electromagnetic wave signal through the medium is equal to the transmitted amount, and the receiving antenna does not reflect the movement. Because the road is through a mixture of layered paving, the dielectric constant of different structure layers is another form of the reflection angle, and the reflection amount is also different; 3D ground exploration radar, according to the received reflection signal (electromagnetic waves in the layers of medium reflection signal accumulation), describes the reflection in the form of peak-trough (Figure 2) for electromagnetic wave routing table to the base of the typical map. With the increase in the detection depth, the loss of electromagnetic wave energy in different media also increases. The reflection peak also decreases, and the decay phenomenon of electromagnetic wave propagation in the medium is reflected (Soldovieri et al., 2011).
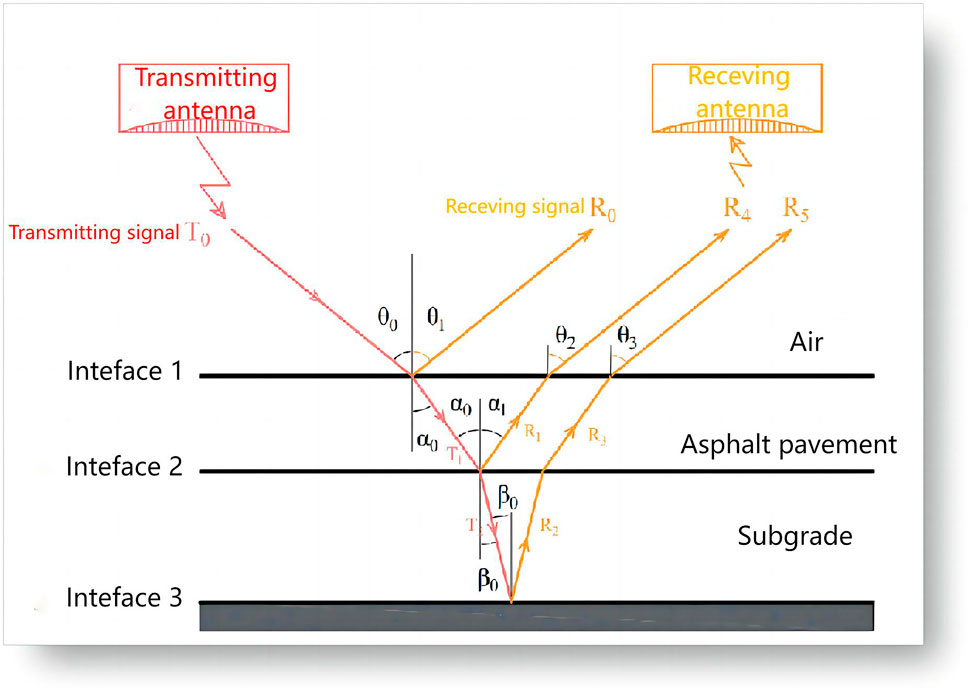
FIGURE 1. Working principle of 3D GPR.
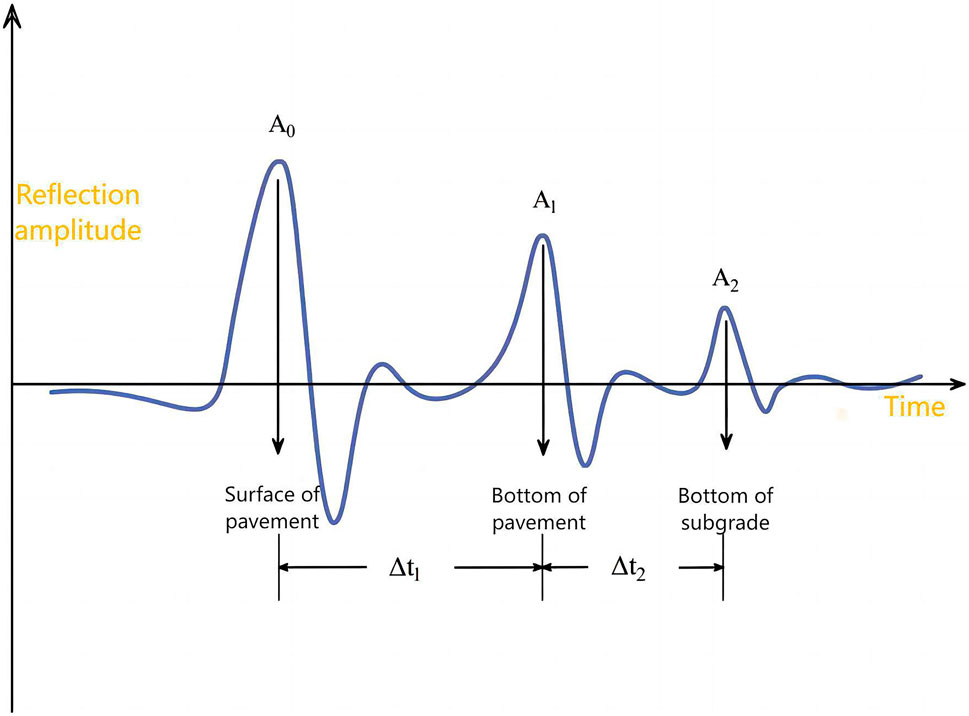
FIGURE 2. Typical map of the electromagnetic wave transferred from the surface to the base.
The 3D penetrating radar GeoScope MKⅣ 3D, manufactured by the Norwegian company 3D-Radar, is employed in this study and equipped with the DX1821 air coupling antenna, as illustrated in Figure 3. The utilized radar system utilizes the digital stepping frequency technology to precisely emit sine wave signals within controlled frequency steps in the frequency domain, effectively mitigating irrelevant noise through system optimization (Sala et al., 2012). The DX1821 air-coupled antenna comprises 21 channels, with each channel housing two scanning arrays. The standard spacing between each pair of antenna arrays is set at 75 mm, while the effective detection width measures 1.8 m, effectively addressing the issue of low detection efficiency. Composed of a butterfly unipolar antenna boasting a wide bandwidth, the coupled antenna can cover frequencies ranging from 100 MHz to 3,000 MHz, thereby significantly enhancing the detection efficiency (Khamzin et al., 2017).
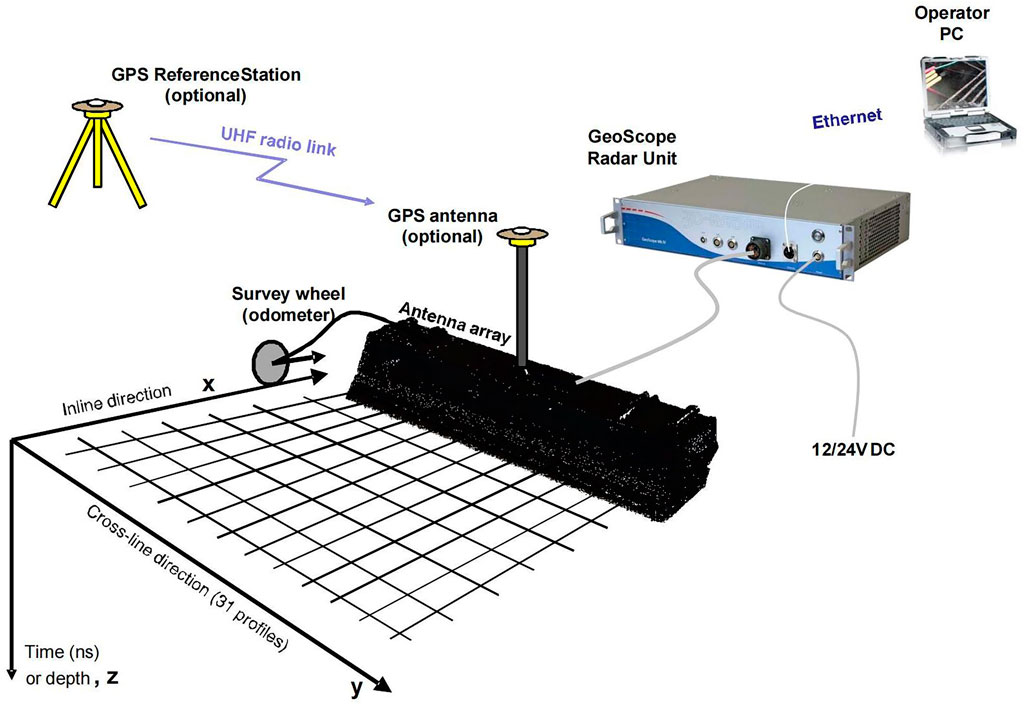
FIGURE 3. Three-dimensional GPR system.
The A-scan diagram represents the amplitude curve of the reflected electromagnetic wave signal captured by the air-coupled antenna at a specific location. It is generated when an electromagnetic wave transitions from a structural layer with a lower dielectric constant to one with a higher dielectric constant. As shown in Figure 4A, there is a negative peak surrounded by two sporadic positive peaks. Figure 4B shows the A-scan diagram for the transmission of electromagnetic waves from a high-dielectric constant structural layer to a persistent low-dielectric constant structure layer, exhibiting a positive peak flanked by two intermittent negative peaks.
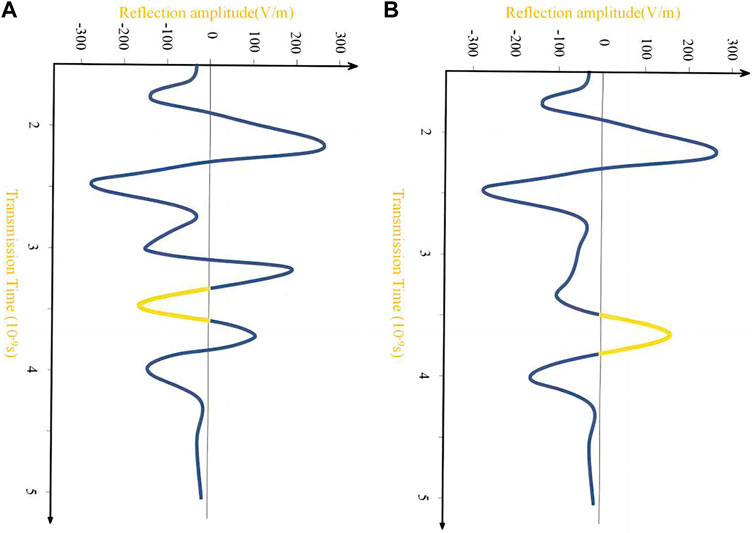
FIGURE 4. A-scan of electromagnetic waves propagated by different media. (A) Low dielectric constant to high dielectric constant. (B) High dielectric constant to low dielectric constant.
For a properly bonded asphalt pavement as the detection area, the A-scan diagram displays two distinct positive peaks. The first peak corresponds to reflections from the road surface and air, while the second peak corresponds to reflections from internal layers at a high frequency. Under typical interlayer bonding conditions (as depicted in Figure 5A), a direct contact between the road table and air leads to a noticeable increase in the reflection amplitude due to a greater difference in relative dielectric constants. As electromagnetic waves interact with the asphalt pavement surface, tighter bonding between layers results in only marginal increases in peak amplitude propagation within upper layers as penetration depth increases. Consequently, there is a decrease in the peak reflection amplitude as electromagnetic wave attenuation gradually occurs within the material. In contrast, poor pavement bonding (as shown in Figure 5B) allows air to reach interfaces, significantly reducing the interlayer material’s dielectric constant; weak layer bonding is directly proportional to the interface gap width and consequently leads to an increased positive reflection amplitude as the interface gap widens. To investigate the effects of asphalt layer bonding on reflection amplitude, we utilized 3D GPR on defective specimens and well-adhered specimens for confirmation purposes. By employing techniques such as surface position adjustment, time-zero correction, infinite pulse response filtering, and finite pulse response filtering for noise removal at both high-frequency and low-frequency ranges from obtained characteristic maps distinguishing well-bonded samples from stripping-damaged samples (Soldovieri et al., 2011; Dong et al., 2016).
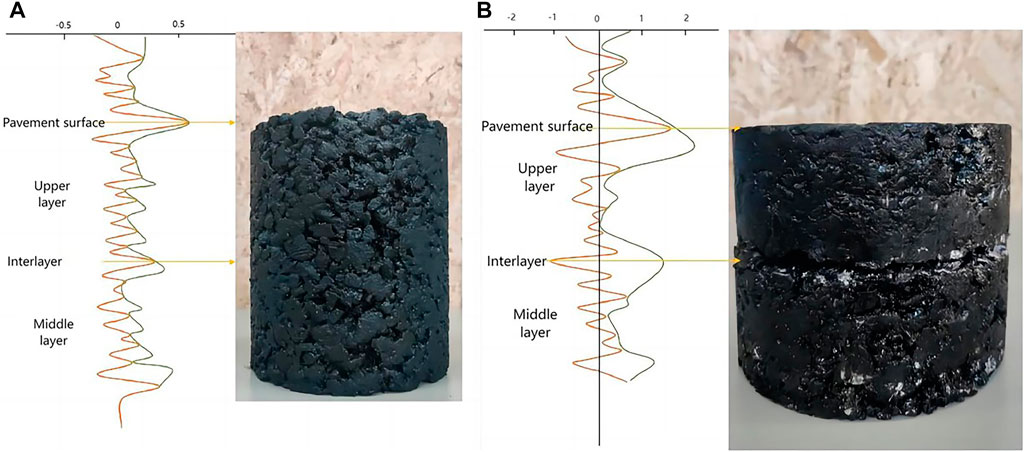
FIGURE 5. Typical radar map of specimens of different interlayer states. (A) Good bonding between layers and (B) poor bonding between layers.
The peak of the amplitude slightly rises in comparison with the propagation between the higher layers because of the strong connection between the two layers. The loss of electromagnetic waves in the material gradually rises with an increased penetration depth, and the peak of the reflection amplitude gradually declines. The propagation of electromagnetic waves through the road surface to the upper layer is identical (Khamzin et al., 2017). The bonding between the upper and middle layers in the upper and center portions is still penetrated by air and water, which significantly interferes with electromagnetic wave transmission. The peak amplitude increased noticeably, mostly in the direction of the positive axis.
On the basis of this, we developed a novel technique known as the stacking peak ratio (SPR) approach, which compares the interlayer amplitude peak to the asphalt pavement’s surface reflection amplitude peak to assess the bonding status between the two surfaces.
Among them, Ai is the positive amplitude of electromagnetic waves in the range of the asphalt surface, A0 is the surface reflection amplitude of the asphalt pavement, and n is the number of positive peaks in the surface. For the same radar parameter, its value increases with the increase in surface layer thickness. This method addresses the issue that it is challenging to determine the peak depth and offers a rapid form to assess the bonding condition of the asphalt surface.
For the DX1821 air-coupled stepping frequency antenna, the early acquisition parameters of 3D GPR are the sampling interval, sampling time window, and residence time (Sala et al., 2012).
The 3D radar’s sampling interval reflects the air coupling antenna’s sampling density (Ma et al., 2021). The sampling interval for the pulse radar is inversely related to the central frequency and inversely proportional to the sampling rate. The sampling interval must be appropriate for the tested object’s size. Neither very large nor very small sampling interval will prevent data overflow from happening. Since the test’s specimen is small, a very small sampling interval, like 1 cm, is employed. The sampling interval can be changed to 5 cm–7.5 cm if a wide detection range is conducted on expressways, national, or provincial roadways.
The sampling time window represents the duration required for the electromagnetic wave signal to propagate through the target medium and be transmitted and received by the 3D GPR. This characteristic is determined by the speed of electromagnetic waves and the detection depth of the 3D GPR system. The central frequency and relative permittivity exert significant influence on the residence time of the 3D GPR, which defines the total emission time of each step frequency’s electromagnetic wave signal. It plays a crucial role in acquiring internal data from objects, affecting both detection procedures and outcomes, making them essential research objectives for optimizing the 3D GPR parameters.
We constructed two distinct types of asphalt mixture specimens in accordance with the technical requirements for highway asphalt pavement construction, aiming to investigate the optimal acquisition parameters for an asphalt pavement. The first type, completely bonded sample: AC-20 asphalt mixture compacted 75 times, serves as an exemplary interlayer condition. For the top layer, the SMA-13 asphalt mixture underwent 100 rounds of rotary compaction. As recommended by interlayer construction guidelines, the ideal amount of emulsified asphalt to be sprinkled on the surface is 0.6 kg/m2. The second type consists of completely segregated layers: the SMA-13 asphalt mixture was subjected to 100 rounds of rotary compaction, followed by a natural cooling period of 48 h; the AC-20 asphalt mixture experienced 75 repetitions of rotary compaction and then remained inactive for another 48 h without any intermediate processing before being directly stacked on top material, facilitating easy separation. Figure 6 and Figure 7 illustrate the gradation curves for SMA-13 and AC-20, respectively. To ensure optimum measurement height at all times, we adjusted the height of the 3D radar antenna accordingly. Each type of sample was tested five times in total, from which mean values and standard deviations were computed. Acquisition parameters used to evaluate bonding in the asphalt pavement are more discernible when there is a greater difference between them; thus, we selected these differences as optimal acquisition parameters along with regular residency times (0.6, 1, 1.5, and 2 us) and standard time window values (25, 35, 50, 62, and 83 ns).
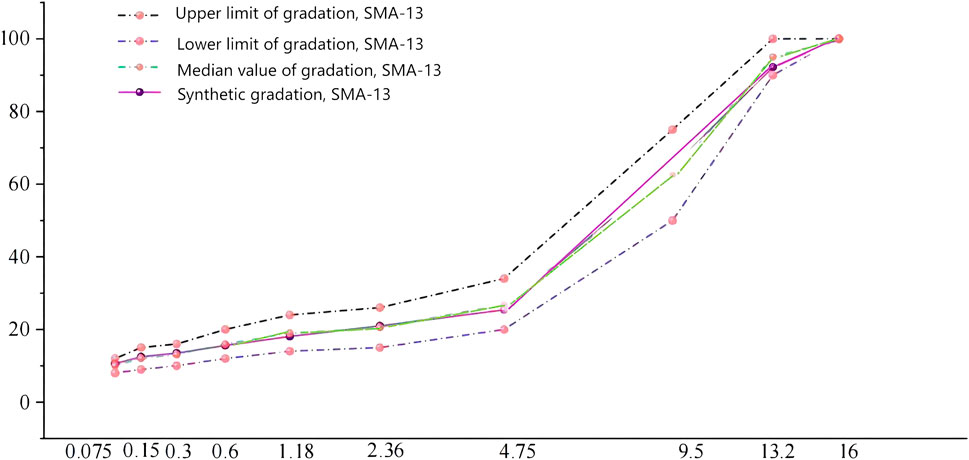
FIGURE 6. Gradation curve of SMA-13.
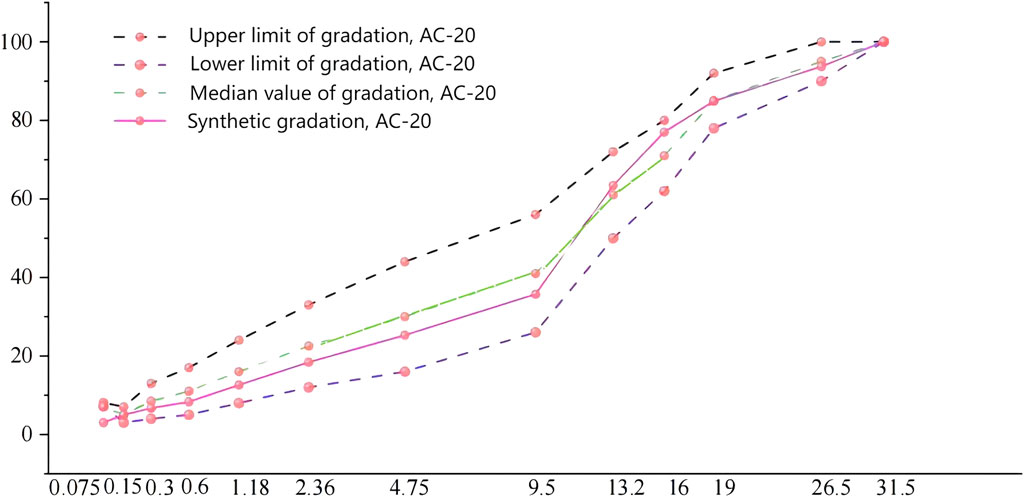
FIGURE 7. Gradation curve of AC-20.
As shown in Figure 8, the investigation found that, with a difference of 38.8%, the average peak value of well-bonding layers was 4.41 and that of separated layers was 6.12. Additionally, the SPR of the isolated samples from each data group was higher than that of the samples with a good interlayer state, indicating that this method can be used to assess the interlayer bonding state with regular parameters. Furthermore, the residence time of 1 µs and the time window of 35 ns were chosen as the optimal parameters for measuring the interlayer state using the stacking peak ratio approach since these values coincided with the appearance of the highest difference value, in Figure 9.
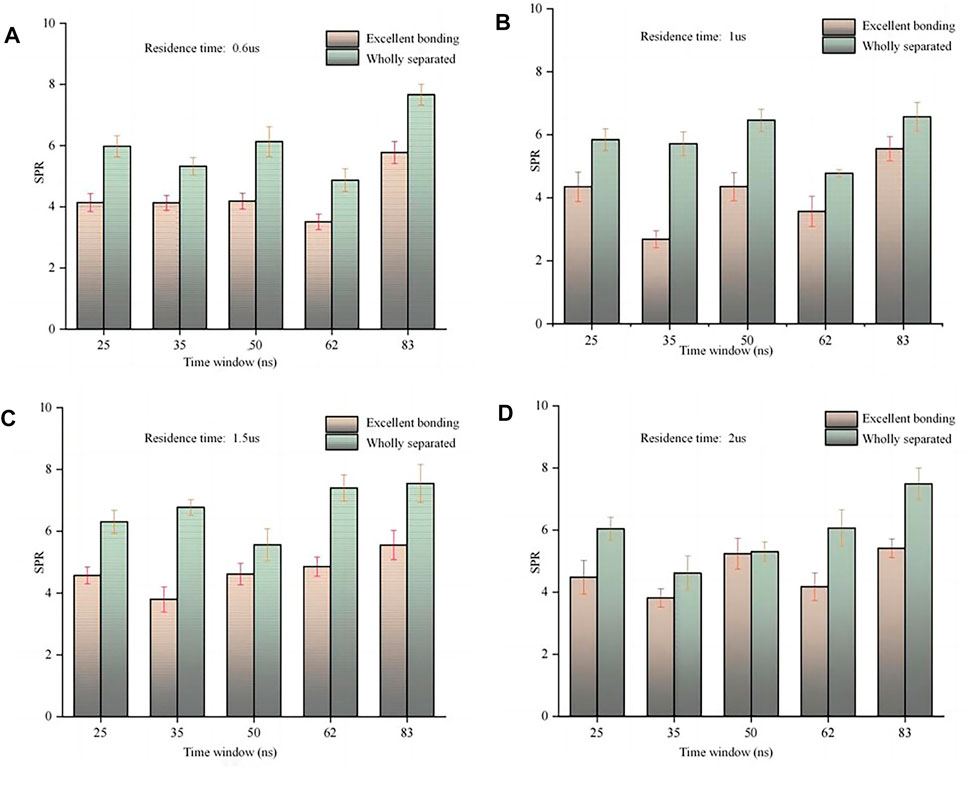
FIGURE 8. SPR under different time windows. Residence time: (A) 0.6us; (B) 1us; (C) 1.5us; (D) 2us.
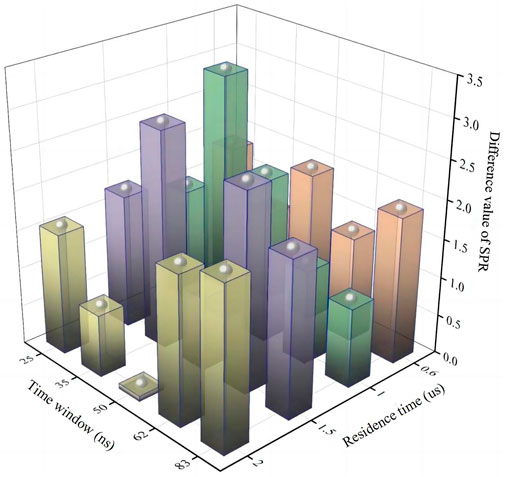
FIGURE 9. Different values of SPR under different parameters.
To better understand the assessment impact of the SPR technique, we set up controllable tests contrasting the SPR method and the straight shear method in an effort to recreate diverse real-world interlayer bonding situations for the asphalt pavement. We used four distinct adhesive materials, each with six gradients of sprinkling amount and six further gradients of interlayer pollution to match existing criteria as much as possible, and we compared the test results under various circumstances.
The forming method of the test specimen was combined with rotary compaction, the upper layer of the sample is SMA-13 asphalt mixture, and the lower layer is the AC-20 asphalt mixture (Zhang et al., 2018). The specific technical indexes are the same as in the previous section. First, a 60-mm-thick AC-20 asphalt mixture was used as the lower layer of the specimen. The compaction was 75 times and stands for 48 h under natural conditions. Then, we mixed the SMA-13 asphalt mixture and placed the heated material into the rotary compaction test mold after insulation so that the compaction hammer can fall ten times 20 cm from the surface of the SMA-13 mixture to form a foundation plane. The preparation process of different bonding materials was as follows: the adhesive layer materials were heated to the flow state; SBS-modified asphalt binder, 70 # matrix asphalt binder, and rubber asphalt binder were sprinkled to the upper surface of the AC-20 mixture. In addition, the modified emulsified asphalt needs to wait for an emulsion breaking before operation. The specific amount of spraying and level is shown in Table 1. The preparation process of test pieces with different pollution degrees is as follows: first, apply 0.6 kg/m2 emulsified asphalt, and then, sprinkle six different amounts of loess particles, such as 0.1 kg/m2–1.1 kg/m2 on the emulsified asphalt to simulate the interlayer pollution caused by the dust on the adhesive layer (Tashman et al., 2008).
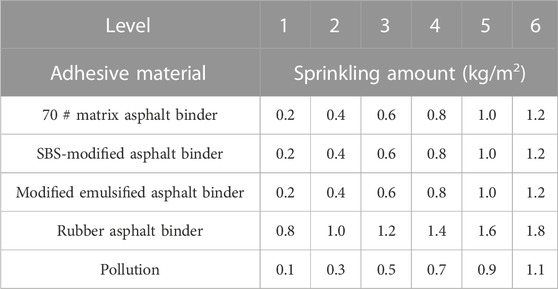
TABLE 1. Different spraying amounts of adhesive materials.
GeoScope MKⅣ 3D GPR and DX1821 air coupling antenna are adopted in the test. The acquisition parameters are as follows: a sampling interval of 1 cm, 35 ns at sampling time, 1 µs at residence time, and a driving speed was less than 20 km/h. The specimens were arranged in a straight line during the test, and each sample was 1 m apart. Iron plates were placed between models with different adhesive materials to distinguish. We controlled the antenna to ensure that 6–16 channels crossed the center of the specimen and collected the data three times for the average result. The direct shear test used a UTM-30 multi-function material testing machine with a direct shear module. After measuring the height and diameter, we put the specimen into a 25°C incubator for 4 hours. Then, the sample was put into the straight shear module, ensured that the lower layer of the selection was fixed to the whole circle, and the interlayer position was located between the upper half ring and the entire ring. Then, the height of the upper ring and the surface of the specimen were adjusted to make contact. The loading rate was 50 mm/min, and the test procedure will show the specimen’s real-time shear stress and deformation displacement. The test was stopped when the displacement–stress curve peak drops.
The peak and maximum shear strengths of the same specimen exhibit an inverse relationship, as shown in Figure 10 and Figure 11, while Figure 13 demonstrates a satisfactory fitting effect. This substantiates the effectiveness and feasibility of the stacking peak ratio method for assessing interlayer bonding in the asphalt pavement. Moreover, when comparing three types of asphalt binders at equal quantities, the bonding effect between the modified emulsified asphalt binder and 70# asphalt binder surpasses that of the SBS-modified asphalt binder. Notably, employing 0.6 kg/m2 as the interlayer bonding material is recommended due to its superior bonding effect ratio. Conversely, the rubber asphalt binder yields inferior results compared to the other three materials; however, it remains challenging to discern changes in its content lawfully. Figure 12 reveals an inverse relationship between SPR (shear resistance parameter) values for polluted samples and pollution levels. Similarly, maximum shear strength exhibits an inverse correlation with the pollution level and displays a linear connection with excellent fit, thereby demonstrating that SPR can effectively assess interlayer pollution levels as well. Figure 13 shows both the SPR method and shear strength test on various specimens demonstrate a significant correlation between these two methods; additionally, distinct variations in bonding materials with additional contents or varying pollution levels were highlighted while maintaining consistent regularity throughout observations. These findings underscore how the SPR method consistently aligns with direct shear tests and can be employed for the rapid assessment of interlayer bond conditions in asphalt pavements.
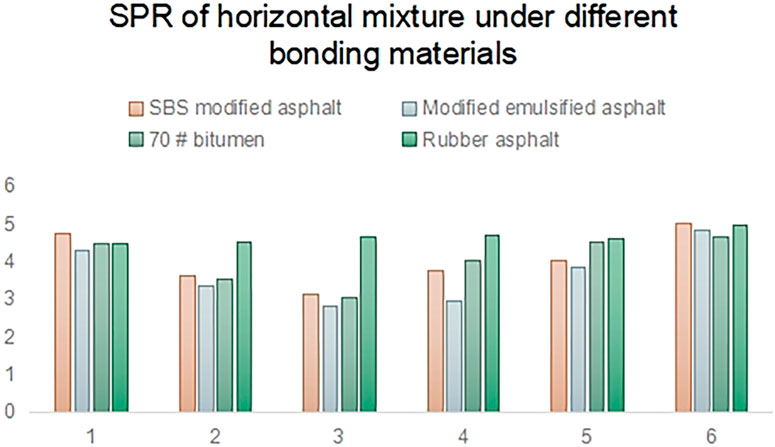
FIGURE 10. SPR under different materials.
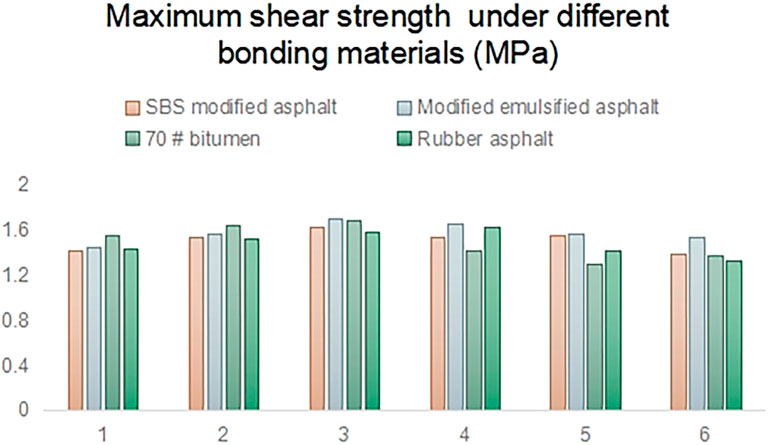
FIGURE 11. Maximum shear strength under different materials.
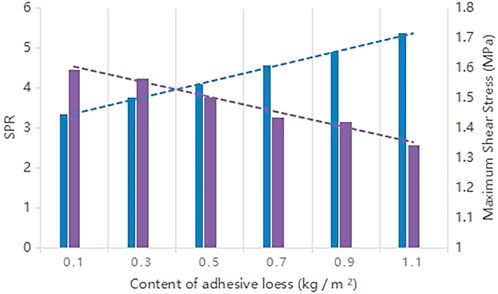
FIGURE 12. SPR and maximum shear strength under different material pollution.
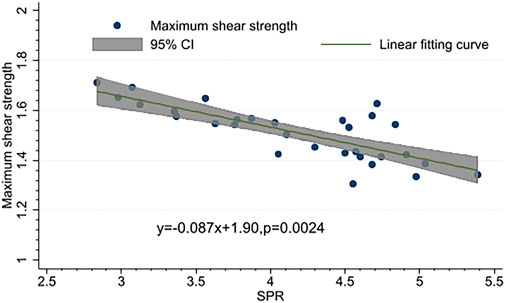
FIGURE 13. Linear fitting curve of SPR and maximum shear strength.
To further verify the effect of the SPR method, this paper relied on a highway reconstruction construction project in Linyi City, Shandong province, for a field test. The highway has been serviced for more than 10 years, with the asphalt pavement surface thickness of 6 cm AC-20 asphalt mixture and an upper layer of 4-cm-thick SMA-13 asphalt mixture. The effective detection width of the empty coupling antenna used in this detection is 1.5 m. The leading equipment of GPR included the following: a driving computer, GPS, RTK, ranging wheel, radar host, and DX1821 air coupling antenna. For emergency lane detection, we collected the data by a 3D radar into 3DR-Examiner software for pretreatment, and then, we used MATLAB to extract the depth of the amplitude data. We calculated the global stacking peak ratio and its distribution, selected abnormal SPR areas for GPS coordinates, and determined the specific location using RTK for accurate positioning of abnormal areas with core verification. The acquisition parameters were as follows: sampling interval 1 cm, 35 ns at sampling, 1 µs at residence, and driving speed less than 20 km/h. The total length of the test is 1 km, and the test line was located in the left half of the emergency lane of the expressway, which is close to the white solid line of the right road. The core samples were subjected to a direct shear test if necessary.
The SPR macro-distribution map, Figure 14, generated by the SPR method, is utilized for core validation in regions with multiple SPRs, and the illustration of pavement cores is shown in Figure 15. It can be observed that at core sample position A, the average SPR value of 4.873 indicates inadequate interlayer bonding potential. Conversely, at core sample position B, an average SPR value of 2.825 suggests an excellent interlayer bonding performance. In the region surrounding core-sample C, an average SPR value of 5.981 implies poor interlayer adhesion and a likelihood of interlayer separation; this has been confirmed through subsequent core verification procedures. Similarly, near to core sample D, an average SPR value of 5.749 indicates poor interlayer bonding and an actual occurrence of interlayer separation in drilled cores. The mean SPR values around cores E and F are measured as 3.983 and 4.112, respectively; these signify potential stripping defect sites due to inadequate interlayer bonding. Furthermore, the maximum shear strength recorded for samples A, B, E, and F are measured as l.21, 1.65, 1.40, and l.36 MPa, respectively. These field results demonstrate that the use of the SPR method effectively identifies existing defects while also predicting possible future issues related to asphalt pavement evaluation. The SPR method requires a rapid and comprehensive evaluation approach for pavement bonding during road maintenance and repair, thus establishing a basis for precise and environmental friendly maintenance.
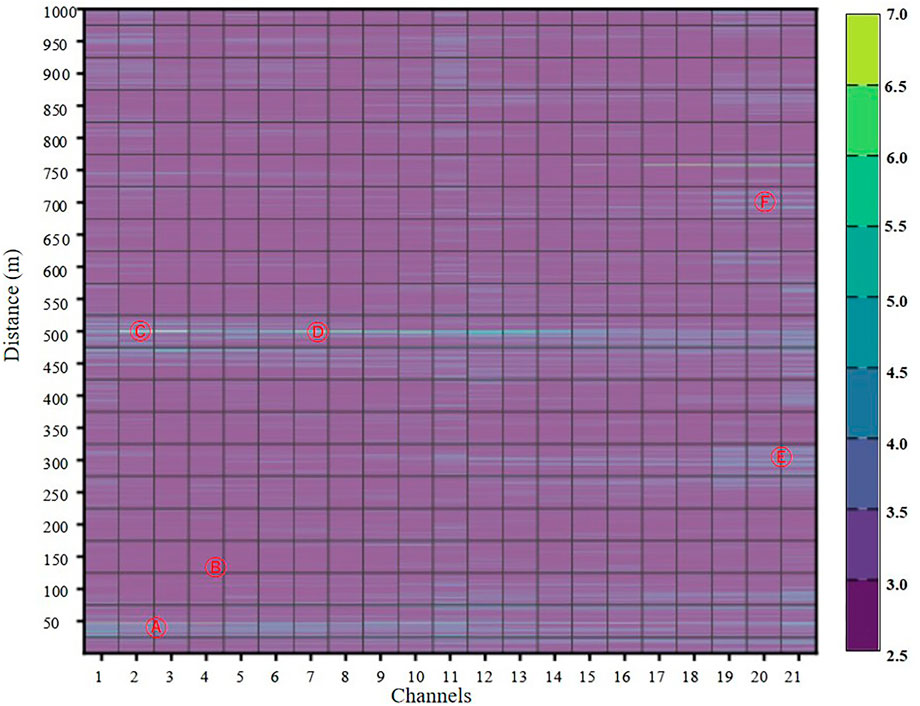
FIGURE 14. Distribution map of SPR and the core of the detected road.
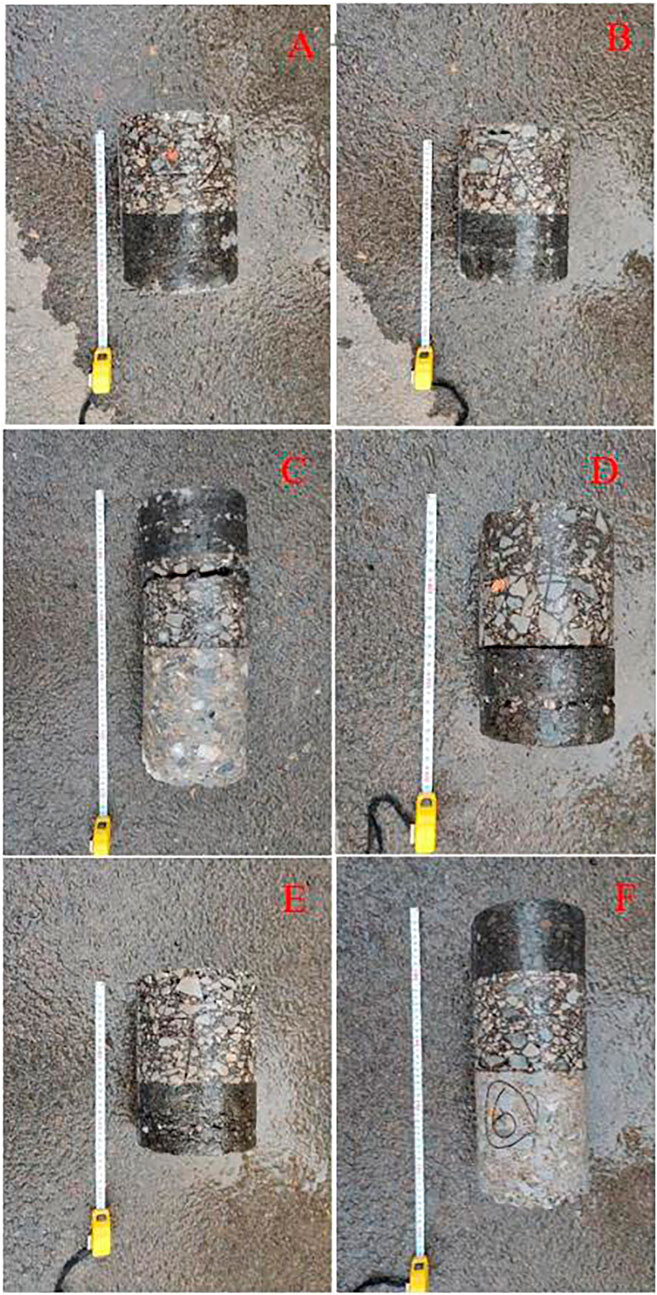
FIGURE 15. Illustration of pavement cores with varying SPR. SPR of cores: (A) 4.873; (B) 2.825; (C) 5.981; (D) 5.749; (E) 3.983; (F) 4.112.
This paper introduces the method of the principle of the stacking peak ratio method, studies the best parameters of this method, compares the results with the direct shear test, finally analyzes the existing interlayer bonding state, and obtains the following conclusions eventually:
(1) The interlayer bonding state of the asphalt pavement can be determined by superimposing the ratio of the peak interlayer amplitude and the peak surface reflection amplitude as the radar wave reflection image at the poor interlayer bonding of the asphalt pavement will significantly enhance the amplitude of the positive axis direction.
(2) The best test parameter for the SPR method is found to be the time window of 35 ns and the residence time of 1 µs through comparison testing of specimens with various bonding states.
(3) It is demonstrated that the SPR method of the same specimen is inversely proportional to the maximum shear strength and that the regularity of diverse specimens of the two ways is consistent by comparing the SPR method and direct shear test of different bonding materials and different contamination layers.
(4) The outcomes of field tests demonstrate that the SPR approach performs well in assessing the current bad bonding and anticipating the inadequacies of possible bonding defects, offering a practical tool for quickly assessing the bonding state of the asphalt pavement.
The datasets presented in this article are not readily available due to commercial restrictions, as the raw data was generated at Shandong Hi-Speed Group Co. Derived data supporting the findings of this study are available from the corresponding author Longting Ding on request.
WZ: conceptualization, methodology, and writing—original draft. LN: formal analysis and writing—original draft. SW: investigation, software, and writing—review and editing. HW: project administration, resources, and writing—original draft. LD: writing—review and editing.
The authors declare that no financial support was received for the research, authorship, and/or publication of this article.
Authors WZ, SW, and LD were employed by Shandong Hi-Speed Group Co, Ltd.
The remaining authors declare that the research was conducted in the absence of any commercial or financial relationships that could be construed as a potential conflict of interest.
All claims expressed in this article are solely those of the authors and do not necessarily represent those of their affiliated organizations, or those of the publisher, the editors, and the reviewers. Any product that may be evaluated in this article, or claim that may be made by its manufacturer, is not guaranteed or endorsed by the publisher.
Cao, Q., and Al-Qadi, I. L. (2021). Effect of moisture content on calculated dielectric properties of asphalt concrete pavements from ground-penetrating radar measurements. Remote Sens. (Basel) 14, 34. doi:10.3390/rs14010034
Dawei, W., Haotian, L., Fujiao, T., Chengsen, Y., and Pengfei, L. (2022). Intelligent detection technology of contact state between asphalt pavement layers based on 3D ground penetrating radar technology. J. Beijing Univ. Technol. 2022, 48. doi:10.11936/bjutxb2021110016
Dong, Z., Ye, S., Gao, Y., Fang, G., Zhang, X., Xue, Z., et al. (2016). Rapid detection methods for asphalt pavement thicknesses and defects by a vehicle-mounted ground penetrating radar (GPR) system. Sensors (Basel) 16, 2067. doi:10.3390/s16122067
Jiang, W., Yuan, D., Shan, J., Ye, W., Lu, H., and Sha, A. (2020). Experimental study of the performance of porous ultra-thin asphalt overlay. Int. J. Pavement Eng. 23, 2049–2061. doi:10.1080/10298436.2020.1837826
Khamzin, A. K., Varnavina, A. V., Torgashov, E. V., Anderson, N. L., and Sneed, L. H. (2017). Utilization of air-launched ground penetrating radar (GPR) for pavement condition assessment. Constr. Build. Mater 141, 130–139. doi:10.1016/j.conbuildmat.2017.02.105
Leng, Z., Al-Qadi, I. L., and Lahouar, S. (2011). Development and validation for in situ asphalt mixture density prediction models. NDT E Int. 44, 369–375. doi:10.1016/j.ndteint.2011.03.002
Ma, Y., Elseifi, M. A., Dhakal, N., Bashar, M. Z., and Zhang, Z. (2021). Non-destructive detection of asphalt concrete stripping damage using ground penetrating radar. J. Transp. Res. Board 2675, 938–947. doi:10.1177/03611981211014199
Mohammad, L. N., Raqib, M., and Huang, B. (2002). Influence of asphalt tack coat materials on interface shear strength. J. Transp. Res. Board 1789, 56–65. doi:10.3141/1789-06
Raouf, M. A., and Williams, R. C. (2010). Temperature and shear susceptibility of a nonpetroleum binder as a pavement material. J. Transp. Res. Board 2180, 9–18. doi:10.3141/2180-02
Sala, J., Penne, H., and Eide, E. (2012). “Time-frequency dependent filtering of step-frequency ground penetrating radar data,” in 2012 14th International Conference on Ground Penetrating Radar (GPR), Shanghai, China, 04-08 June 2012 (IEEE).
Soldovieri, F., Solimene, R., Lo Monte, L., Bavusi, M., and Loperte, A. (2011). Sparse reconstruction from GPR data with applications to rebar detection. IEEE Trans. Instrum. Meas. 60, 1070–1079. doi:10.1109/tim.2010.2078310
Sudyka, J., and Krysiński, L. (2011). Radar technique application in structural analysis and identification of interlayer bonding. Int. J. Pavement Res. Technol. 4, 176–184. doi:10.1046/j.1365-313X.1994.6020225.x
Tashman, L., Nam, K., Papagiannakis, T., Willoughby, K., Pierce, L., and Baker, T. (2008). Evaluation of construction practices that influence the bond strength at the interface between pavement layers. J. Perform. Constr. Facil. 22, 154–161. doi:10.1061/(asce)0887-3828(2008)22:3(154)
Wang, X., Su, Z., Xu, A., Zhou, A., and Zhang, H. (2017). Shear fatigue between asphalt pavement layers and its application in design. Constr. Build. Mater 135, 297–305. doi:10.1016/j.conbuildmat.2016.12.151
Yuan, D., Jiang, W., Sha, A., Xiao, J., Wu, W., and Wang, T. (2023). Technology method and functional characteristics of road thermoelectric generator system based on Seebeck effect. Appl. Energy 331, 120459. doi:10.1016/j.apenergy.2022.120459
Zhang, K., Zhang, Z., and Luo, Y. (2018). Inspection method and evaluation standard based on cylindrical core sample for rutting resistance of asphalt pavement. Meas. (Lond) 117, 241–251. doi:10.1016/j.measurement.2017.12.002
Keywords: ground-penetrating radar, bonding between asphalt pavement, non-destructive rapid detection, reflection amplitude, road engineering
Citation: Zhang W, Niu L, Wang S, Han W and Ding L (2023) Study on the interlayer bonding state of an asphalt pavement based on the stacking peak ratio method. Front. Energy Res. 11:1277817. doi: 10.3389/fenrg.2023.1277817
Received: 15 August 2023; Accepted: 11 September 2023;
Published: 31 October 2023.
Edited by:
Meng Jia, Shandong University of Science and Technology, ChinaReviewed by:
Wangjie Wu, Chang’an University, ChinaCopyright © 2023 Zhang, Niu, Wang, Han and Ding. This is an open-access article distributed under the terms of the Creative Commons Attribution License (CC BY). The use, distribution or reproduction in other forums is permitted, provided the original author(s) and the copyright owner(s) are credited and that the original publication in this journal is cited, in accordance with accepted academic practice. No use, distribution or reproduction is permitted which does not comply with these terms.
*Correspondence: Longting Ding, ZGx0cGhkMjAxOEAxNjMuY29t
Disclaimer: All claims expressed in this article are solely those of the authors and do not necessarily represent those of their affiliated organizations, or those of the publisher, the editors and the reviewers. Any product that may be evaluated in this article or claim that may be made by its manufacturer is not guaranteed or endorsed by the publisher.
Research integrity at Frontiers
Learn more about the work of our research integrity team to safeguard the quality of each article we publish.