 Zhou Jian1
 Xuan Liu
 Tianyang Zhao
- 1State Key Laboratory of Disaster Prevention and Reduction for Power Grid, State Grid Hunan Electric Power Co., Ltd., Changsha, China
- 2Energy and Electricity Research Center, Jinan University, Guangzhou, China
Tropical cyclone (TC) track forecasting is critical for wind risk assessment. This work proposes a novel probabilistic TC track forecasting model based on mixture density network (MDN) and multitask learning (MTL). The existing NN-based probabilistic TC track prediction models focus on directly modeling the distribution of the future TC positions. Multitask learning has been shown to boost the performance of single tasks when the tasks are relevant. This work divides the probabilistic track prediction task into two sub-tasks: a deterministic prediction of the future TC position and a probabilistic prediction of the residual between the deterministic prediction and the actual TC location. The MDN is employed to realize the probabilistic prediction task. Since the target values of the MDN in this work are the residuals, which depend on the prediction result of the deterministic task, a novel training method is developed to train the MTL model properly. The proposed model is tested against statistical and other learning-based models on historical TC data. The results show that the proposed model outperforms other models in making probabilistic predictions. This approach advances TC track forecasting by integrating MDN and MTL, showing promise in enhancing probabilistic predictions and improving disaster preparedness.
1 Introduction
Tropical cyclones are among the most destructive natural disasters and often come with storm surges, high waves, and extreme winds. TCs spawned in the western North Pacific have massive impacts on the economies and inhabitants of Chinese coastal areas. For instance, typhoon Lekima in 2019 caused approximately 51.53 billion CNY losses and affected 14.02 million people across ten provinces in China (Zhang et al., 2019). Given the severity of TC impacts, it is necessary to have TC risk assessment tools to inform preemptive actions that can mitigate economic losses and save lives.
TC track prediction is crucial for assessing TC risks. With the aid of satellites, precise tracking of TCs across the globe has become feasible in recent decades. Notably, the accuracy of TC track forecasting models has significantly improved over the past few decades. The National Hurricane Center (NHC) reports a decline in the average 24-h TC track forecast error from
Numerous efforts have been made to enhance TC track prediction models, which fall into four primary categories: statistical, numerical, ensemble, and deep learning (DL) models. Statistical models, also termed analytical models, were among the earliest operational guidance systems (Hope and Neumann, 1970). These models leverage historical TC data for statistical analysis. The 1998 climatology and persistence (CLIPER5) model (Aberson, 1998), a stepwise regression model, captures the nonlinear relationship between input predictors and predictands. The CLIPER5 model’s performance often serves as a benchmark. Prior to 1990, statistical models typically outperformed numerical models. Numerical models, complex mathematical models executed on supercomputers, process atmospheric physics and motion equations (Cangialosi, 2021). Advances in computing power, satellite data assimilation, and model physics have bolstered the accuracy of numerical models. Since approximately 1990, numerical models have surpassed statistical models in forecasting accuracy. Ensemble forecasts, which combine multiple predictions, yield improved outcomes (Leith, 1974; Mullen and Baumhefner, 1994; Rappaport et al., 2009; Simon et al., 2018). This approach has been formally integrated into operational TC track forecasting. Even a basic consensus technique, averaging forecasts from multiple models, outperforms the best-performing model within the ensemble (Rappaport et al., 2009). More advanced consensus methods adaptively weight models based on their historical error characteristics to mitigate biases (Simon et al., 2018). Presently, many meteorological agencies worldwide produce official forecasts using extensive ensemble models. Recently, DL-based TC track forecasting has shown to be a plausible alternative to the operating models (Alemany et al., 2019).
TC risk assessment requires substantial track data. Although numerical and ensemble models are accurate, their computational demands are high. In risk assessment, lightweight statistical or DL models are preferred over dynamical or ensemble models.
The early TC risk assessment models used single-site probabilistic simulation (Russell, 1971; Tryggvason et al., 1976; Batts et al., 1980). In these models, Site-specific TC traits were parameterized via statistical distributions, with Monte Carlo simulations calculating site-specific TC risks. Vickery et al. developed a risk model based on stepwise multiple linear regression (MLR) track models (Vickery et al., 2000). They achieve probabilistic track predictions by adding a random error term to MLR models. Subsequent work has refined MLR-based track models (James and Mason, 2005; Hall and Jewson, 2007; Zhang and Nishijima, 2012; Snaiki and Wu, 2020). Another common statistical approach is using Markov chains (Risi, 2004; Emanuel et al., 2006). These models link TC position at each step to both the previous TC parameters and the probability distribution of motion at the current position and time.
Although the effectiveness of statistical track models is well appreciated, the simplicity of these models makes it difficult to capture the dynamic of hurricane movement very well. Recently, DL has been widely adopted in the energy industry (Fu et al., 2020; Fu, 2022; Fu and Niu, 2022; Fu and Zhou, 2022). DL models has shown to be a powerful alternative tool in cyclone track forecasting since they can learn complex relationships between the input features and the target values. While it may take a long time to train the DL models, the predictions can be made almost instantly once the models are properly trained. The existing DL-based TC track models often take time series (Alemany et al., 2019) or multi-modal data as input. Recurrent neural networks (RNNs) are shown to be very effective at learning temporal relationships from time series data (Alemany et al., 2019; Lian et al., 2020; Bose et al., 2021), while convolutional neural networks (CNNs) are considered the best tool for learning spatial relationships from satellite images (Fang et al., 2022a; Qin et al., 2022).
When integrated with TC genesis, intensity, decay, and wind field models, the TC track model becomes a valuable tool in TC risk assessment Snaiki and Wu (2020). In the energy industry, applications of risk assessment methods using TC track models encompass assessing annual exceedance probabilities for wind speed Emanuel et al. (2006), directional design wind speed Snaiki and Wu (2020), and maximum sustained wind speed during specific TC events at critical locations, such as wind farms Zhao et al. (2021).
DL models exhibit superior performance compared to statistical models (Alemany et al., 2019), but only a few of them are designed for probabilistic predictions. A common approach is to generate TC initial conditions randomly and make deterministic predictions based on these conditions (Fang et al., 2022b), which can be combined with any deterministic model. However, this method does not consider uncertainty along the track. Mixture Density Networks (MDN) are better for modeling TC track uncertainties as they directly learn the parameter distributions (Dabrowski et al., 2020; Hao et al., 2021). In this work, we adopt MDN similarly to MLR-based statistical models, splitting the track prediction into deterministic and random error tasks, learned by a fully connected NN and MDN respectively. Multitask learning (MTL) efficiently trains both tasks simultaneously. Additionally, an improved training strategy based on uncertainty-based loss weights (Cipolla et al., 2018) is proposed.
The main contributions of this paper are summarized as follows:
• A novel stochastic TC track model based on MDN and MTL is proposed. The multitasking of making deterministic and probabilistic predictions improves the probabilistic prediction performance of the model.
• A novel multitask training strategy is developed for the proposed model to learn the two tasks where the target value of one task depends on the prediction results of the other task.
• The proposed approach is tested on historical TC data against statistical models and single-task NN models. The results show that the proposed model outperforms other models in making probabilistic TC track predictions. An example risk assessment system illustrates the model’s application in TC risk assessment for offshore wind farms.
The rest of this paper is structured as follows: The data preprocessing and details of the proposed MTL model are presented in Section 2. Section 3 illustrates the results of the case studies. Conclusions and future work are highlighted in Section 4.
2 Materials and methods
For TC risk assessment, it is desirable to obtain the probability density distribution rather than the exact location of the TC track. This section presents the probabilistic prediction methodology for TC tracks. Instead of directly predicting the distribution of the future TC position, this work divides the probabilistic track prediction task into two sub-tasks: a deterministic prediction of the TC position and a probabilistic prediction of the residual. The probability density distribution of the predicted TC position can then be expressed as the sum of the two predictions.
2.1 Problem formulation
We start by defining the probabilistic TC track prediction problem:
Definition 2.1. TC Track: A TC track X is composed of a series of consecutive spatial-temporal points X = {X0, X1, … , XT}, where X0 is the initial spatial-temporal point. Each spatial-temporal point Xi contains several parameters that essentially characterize the TC track: Xi = [λi, ϕi, pci], where λi, ϕi are the latitude and longitude coordinates, and pci is the central pressure of the TC center.
PROBLEM 2.1. Given a TC track
In this work, we only consider one-step-ahead predictions since only the sets of predictors for one-step-ahead TC predictions in the Northwest Pacific are verified by existing works. The predictor sets for different timescale predictions will be different, and extensive data analysis is required to obtain the best sets of predictors for different models. Nevertheless, the proposed model can be easily modified to make multiple-step-ahead predictions by fitting multiple models to the data with corresponding predictors. Nonetheless, errors would inevitably accumulate over time for multiple time steps or extended prediction horizons.
2.2 Data preprocessing
In this study, historical TC track data was employed to train the proposed prediction model. The primary data source is the tropical cyclone best track dataset from the China Meteorological Administration (CMA) (Ying et al., 2014; Lu et al., 2021), encompassing TCs originating in the Western North Pacific region since 1949. Figure 1 gives a visualization of all the tracks in the dataset. The raw dataset provides 6-hourly track and intensity information. Additionally, for TCs making landfall after 2017, extra 3-hourly records are available. To ensure consistent TC track representation, the 3-hourly data were excluded. A data cleaning process was then performed to remove records containing extreme values (λ > 55° N, ϕ > 180° E or V > 30 m/s) and records with missing data. The translation speed V is calculated utilizing the haversine formula:
Where R = 6,371 km is the earth radius, Δt = 6 h is the time difference between two consecutive records, and hav denotes the haversine distance between the TC centers of two consecutive records.
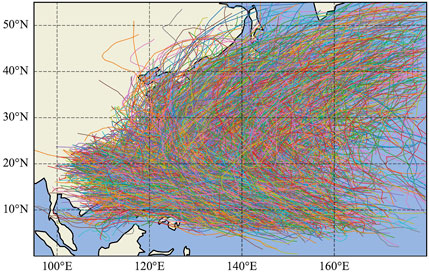
FIGURE 1. Visualization of the CMA tropical cyclone best track dataset.
To construct the feature space for the track prediction model, the latitude, longitude, and central pressure of each record were extracted from the raw data. These values were then used to calculate the predictors selected by the climatology and persistence (CLIPER) models (Knaff et al., 2003; Hao et al., 2021). Two sets of predictors are calculated for the latitude and longitude prediction, respectively. The predictors are then normalized and split into training, validation, and test datasets with a ratio of 7:2:1. A more detailed description of the predictors is given in Table 1. The problem is solved using two separate models for longitude and latitude predictions.
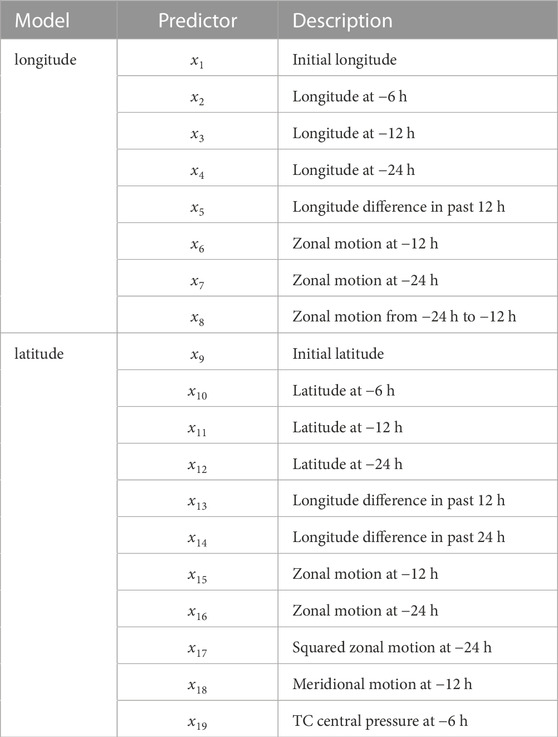
TABLE 1. List of predictors used by the proposed model.
2.3 Artificial neural network
The deterministic prediction task can be described as a regression problem, which can be solved using artificial neural networks (ANNs or NNs). NNs are layered mathematical models that mimic the human brain’s way of processing data. The most basic form of ANN is a multilayer perceptron (MLP), which is a fully connected (FC) NN with only feed-forward connections. An MLP consists of an input layer, one or more hidden layers, and an output layer, as shown in Figure 2. In MLP, each node in one layer connects to every node in the next layer with associated weight (w) and bias (b) parameters. An activation function is applied to each connection after adding up the weighted input and the bias. The activation functions are responsible for introducing non-linearity to the NN models.
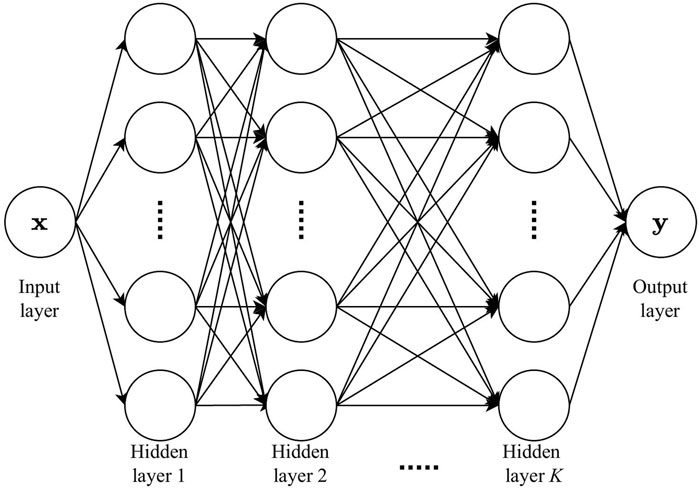
FIGURE 2. Illustration of an MLP structure with K hidden layers.
To train the neural network for regression tasks, the mean square error (MSE) loss between the training target and the predicted value is minimized:
where θ is the set of trainable parameters of the NN (including w and b), N is the number of training data, y is the target value, and
2.4 Mixture density network
While the basic NN is sufficient for the deterministic prediction task, it does not fit the probabilistic prediction task very well. MDN is employed to enable probabilistic predictions with NNs. The MDN was first proposed in (Bishop, 1994) in 1994. In MDN, a mixture model is combined with the NN model to predict a conditional probability distribution.
The mixture model typically consists of K mixture components, with the components belonging to the same parametric distribution functions but with different parameters. A common choice of distribution family for the mixture components is the Gaussian distribution:
where μ is the mean and σ is the standard deviation of the distribution. Each component has its associated mixture weights, which is the probability of choosing this component when sampling from the mixture distribution. The weights of the components add up to 1. The Gaussian mixture model can be expressed as:
Where π is the weight of the mixture component and p (y|x) denotes the conditional probability distribution of the output y given input x. To sample from a mixture model, we first sample a value I from the categorical distribution parametrized by vector π = (π1, π2, … , πK). Then, we sample from Gaussian distribution parametrized by μI and σI to get the result value.
In the MDN, the output of the NN is fed to the mixture model to determine the parameters of the mixture model. The negative log-likelihood (NLL) loss is minimized on the training dataset to obtain the optimal parameters for the mixture model:
where θMDN is the set of trainable parameters of the MDN (including w, b, π, μ and σ), and x, y are from the training set
2.5 Multitask learning model
MTL (Caruana, 1997) can improve the prediction performance of related tasks by learning several tasks at the same time. MTL is considered a type of transfer learning. The commonality across related tasks can be used as an inductive bias in MTL, which can improve the generalization ability of individual tasks.
In contrast to prevalent neural network-based TC track prediction models that concentrate solely on either deterministic or probabilistic predictions, our proposed MTL model takes a pioneering stride. By concurrently mastering both tasks, our model aims to elevate probabilistic prediction performance. Of particular note is our approach in the probabilistic prediction task, wherein we forecast the residuals between deterministic predictions and true values, as opposed to directly predicting the TC track’s distribution. This strategy, often simpler and more potent, effectively addresses systematic errors inherent in deterministic predictions. The probabilistic residual model adeptly handles these errors, enhancing overall predictive reliability.
MTLs are usually achieved by sharing hidden representations extracted by NN layers among tasks. The basic form of parameter sharing is called hard parameter sharing, which is achieved by sharing the low-level hidden layers between all tasks while keeping task-specific output layers. In this work, the task-specific output layers for the deterministic and probabilistic prediction tasks are a fully connected layer and an MDN, respectively. The network structure of the proposed MTL network is illustrated in Figure 3. This architectural decision is driven by the desire to extract and utilize common features that are relevant to both deterministic and probabilistic predictions. By sharing intermediate features and concurrently training for both deterministic and probabilistic predictions, we aim to harness the synergistic benefits of the MTL framework, leading to a more robust and accurate TC track prediction model.
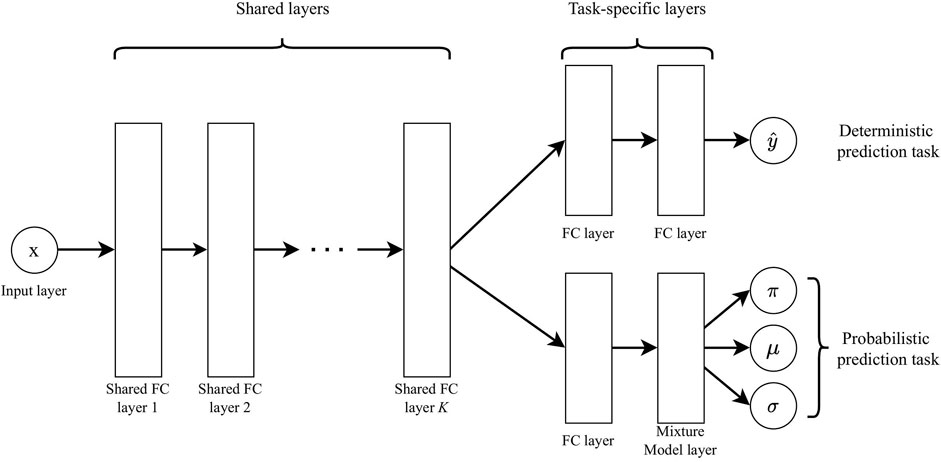
FIGURE 3. Illustration of the proposed MTL model structure.
The simplest way to train the MTL model is to minimize a linear combination of the individual task losses:
where θMTL is the set of trainable neural network weights of the MTL model, T is the number of tasks, and α is the weight of the task-specific loss.
However, in this work, the target of the probabilistic prediction is the residual between the deterministic prediction results and the true values. Therefore the NLL loss given by Eq. 8 cannot be directly applied. The combined loss of the proposed tasks is calculated by:
Where
Where
3 Case studies
3.1 Case description
To validate the performance of the proposed model, the following cases are considered in the case studies:
• MLR: a MLR model with a random error term. The random error term is a logistic distribution that estimates the residual of the MLR model. The model can be expressed as:
Where xi are the predictors described in Table 1, ai and bi are the regression coefficients of the MLR models, and ϵϕ, ϵλ are the random error terms. The MLR regression coefficients are obtained by fitting the model to historical data. The random error terms are obtained by fitting logistic distributions to the difference between the MLR predictions and historical data. This model can make both deterministic and probabilistic predictions.
• Ridge: a ridge regression model with a random error term. The random error term is modeled using the same method as the MLR model.
• LASSO: a least absolute shrinkage and selection operator (LASSO) model with a random error term. The random error term is modeled using the same method as the MLR model.
• Elastic: an elastic net model with a random error term. The random error term is modeled using the same method as the MLR model.
• MDN: a single-task MDN model with Gaussian mixture components. The MDN model can make deterministic predictions by outputting the expected value of the mixture model.
• SEQ: a sequential model where an MLP model is trained to predict the latitude/longitude first, and then an MDN model is trained to model the distribution of the residual of the MLP model. This model learns the two tasks separately and does not benefit from learning through the common characteristics of different tasks as the proposed model does.
• MTL: the proposed multitask model.
The training, validation, and test dataset generation process is described in Section 2.2. In each case, two models were trained for latitude and longitude prediction, respectively. In addition, the latitude and longitude prediction results were combined during postprocessing to generate track prediction results. For probabilistic prediction, the probability density function of the track is the product of the latitude and longitude probability density function:
All the neural networks have the same structure except for the task-specific output layers. The neural networks are implemented and trained using Tensorflow (Abadi et al., 2015) on a machine equipped with an NVIDIA GeForce RTX 3090 GPU.
3.2 Evaluation metrics
3.2.1 Deterministic prediction metrics
• Coefficient of determination (R2)
• Root mean square error (RMSE)
• Mean absolute error (MAE)
• Mean absolute percentage error (MAPE)
3.2.2 Probabilistic prediction metrics
• NLL as described in Eq. 8.
• Akaike’s information criterion (AIC)
• Prediction interval (PI), a common metric to evaluate model prediction uncertainty with a given probability. PI gives a range within which the model is reasonably sure that the future observation lies. The given probability describes the sureness of the model about a certain PI. In this study, the future observation is modeled using Gaussian mixture distribution. Therefore, the PI of a given probability 1 − α can be estimated using the following percentile-based algorithm:
1. For a given typhoon initial condition, get the mixture parameters
2. Solve F(x) = α/2 and F(x) = (1 − α)/2 using Brent’s method (Brent, 2013) to get the percentile xα/2 and x(1−α)/2, which gives an 1 − α prediction interval of [xα/2, x(1−α)/2].
The most commonly used PI is the 95% PI. In this study, we also calculate the 70% PI to further analyze the uncertainty of the models. To evaluate the model on the test dataset, we denote that the prediction is correct if the test target value is within 95% PI. Then, we can calculate the 95% PI-based model “accuracy” by dividing the number of correct predictions by the total number of records in the test dataset.
3.2.3 Track prediction metrics
• AIC as described in the probabilistic prediction metrics.
• Mean haversine distance error (HAV). HAV gives the mean haversine distance from the true location to the predicted location. The calculation process of the haversine distance is described in Eqs 1, 2.
• Predict regions. Similar to PI, the prediction region is an ellipse that covers both the longitude and latitude PIs.
3.3 Test results
3.3.1 Longitude and latitude models
Tables 2, 3 show the numerical results of the longitude and latitude prediction evaluations, respectively. Figure 4 gives the stacked evaluation results of both the longitude and latitude models. For the deterministic predictions, the MTL model performance does not surpass the other models. There is no significant improvement in R2, RMSE, MAE, or MAPE using the proposed model. However, the proposed MTL model outperforms the other models in the probabilistic prediction task. For longitude predictions, the NLL decreased by about 24%–27% compared to the statistical models, 11.4% to the MDN model, and 3.7% to the SEQ model. For latitude predictions, the test NLL with the proposed model decreased by about 10% compared to the statistical models and about 2.7% to the MDN and SEQ models.
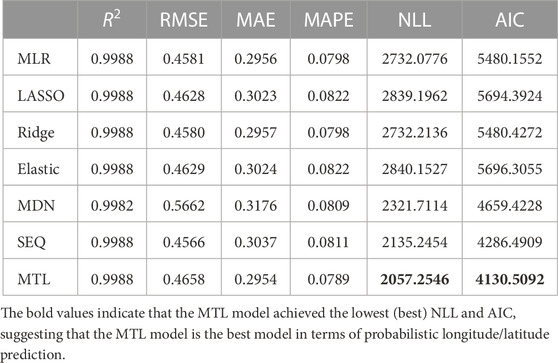
TABLE 2. Longitude prediction evaluation results.
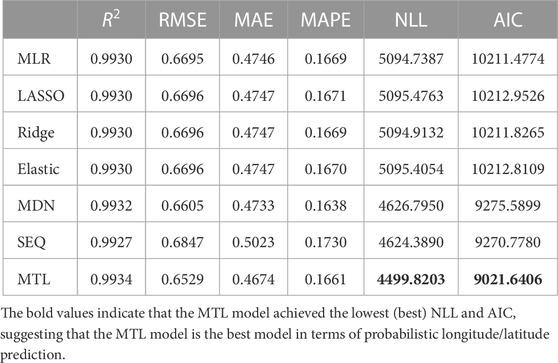
TABLE 3. Latitude prediction evaluation results.
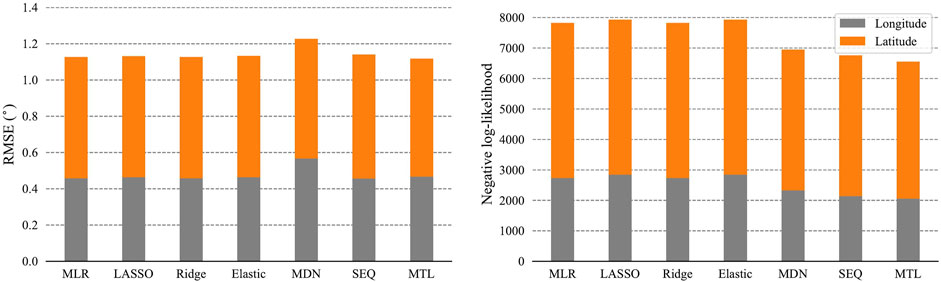
FIGURE 4. Visual comparison of the longitude and latitude model evaluation results.
The 95% PI-based model accuracy of different models is given in Table 4. The statistical models perform poorly since the random error distributions in these models are not conditional. The conditional probabilistic models generally capture the output uncertainty under different input values very well, and the proposed model performs the best among the conditional probabilistic models.
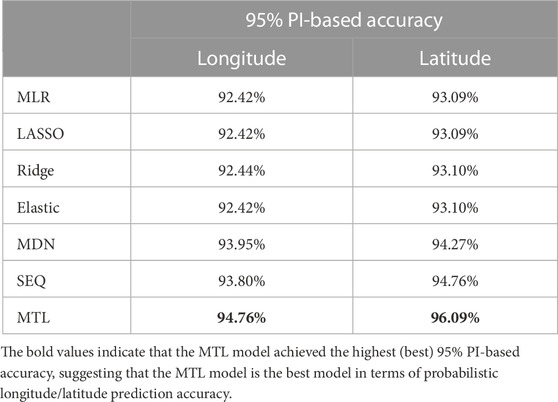
TABLE 4. PI-based accuracy of the longitude and latitude models.
Taking a sample full TC track in the test dataset as an example, the PIs under 95% and 70% probabilities obtained by the proposed MTL longitude and latitude model are shown in Figure 5. As shown in Figure 5, the PIs under different probabilities and the real values of the longitude/latitude have similar fluctuation. Since the 70% PIs are narrower than the 95% PIs, a small number of real values fall outside the 70% PI. Overall, the real values are well captured by the 95% and 70% PIs.
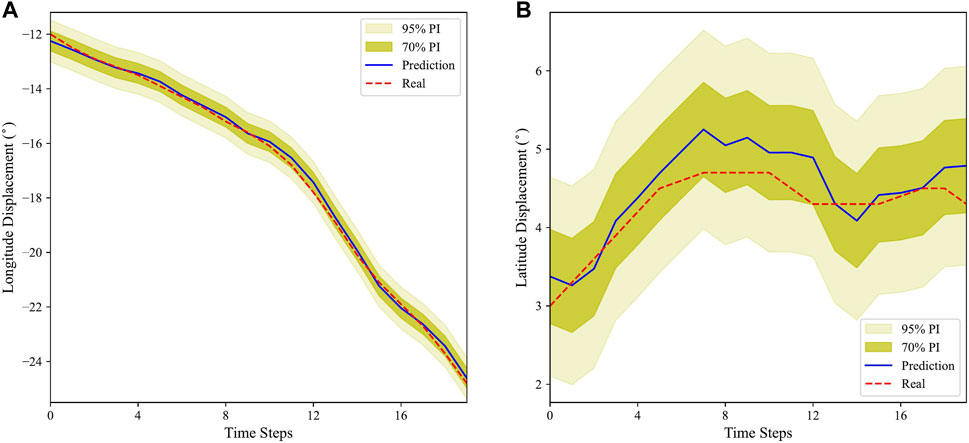
FIGURE 5. PIs of the proposed longitude (A) and latitude (B) models on a test typhoon track.
We also compare the 95% PIs of the MLR and the proposed MTL model by plotting the PIs of both models under the sample TC track in Figure 6. Although both models are able to capture the real track values within 95% PI, the interval length of the MTL model is smaller, indicating that the MTL model can capture the real value with a smaller uncertainty.
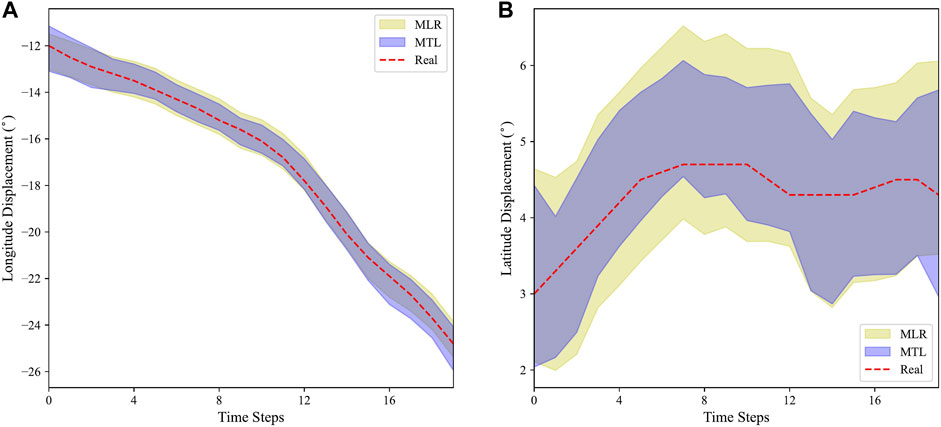
FIGURE 6. Comparison of the 95% PIs of the MLR model and MTL model for longitude (A) and latitude (B) predictions on a test typhoon track.
3.3.2 Track models
Table 5 presents the combined evaluation results for track prediction, while Figure 7 illustrates the corresponding bar chart. The results for the latitude and longitude prediction indicate that although there is not much enhancement in deterministic predictions, there is a significant improvement in probabilistic prediction performance. Specifically, compared to statistical models, the proposed model reduced the test NLL by approximately 16%–17%, 5.6% for the MDN model, and 3.0% for the SEQ model. In terms of 95% PI-based accuracy, the statistical models performed poorly, whereas the conditional probabilistic models effectively captured the output uncertainty. The proposed model exhibited the best performance in this regard.
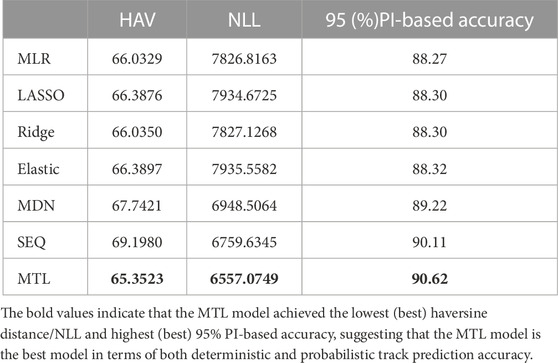
TABLE 5. Combined track models performance.
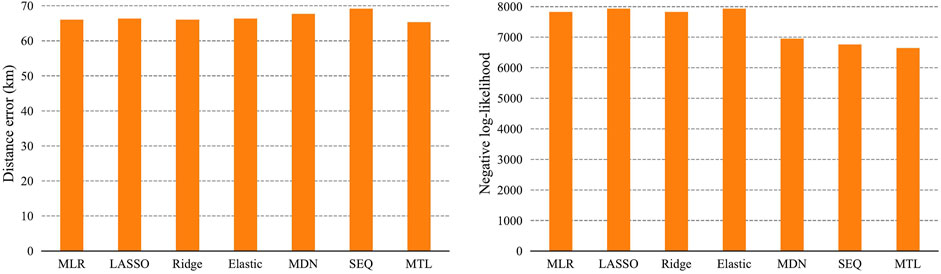
FIGURE 7. Comparison of the track model evaluation results.
Figure 8 shows the combined prediction region under 95% and 70% probabilities obtained by the proposed MTL track model. It can be seen that a few true values fall outside the 70% prediction regions, and all but one true values fall within the 95% prediction regions, which shows that the proposed MTL model can capture the dynamic uncertainties of the TC position under different input values.
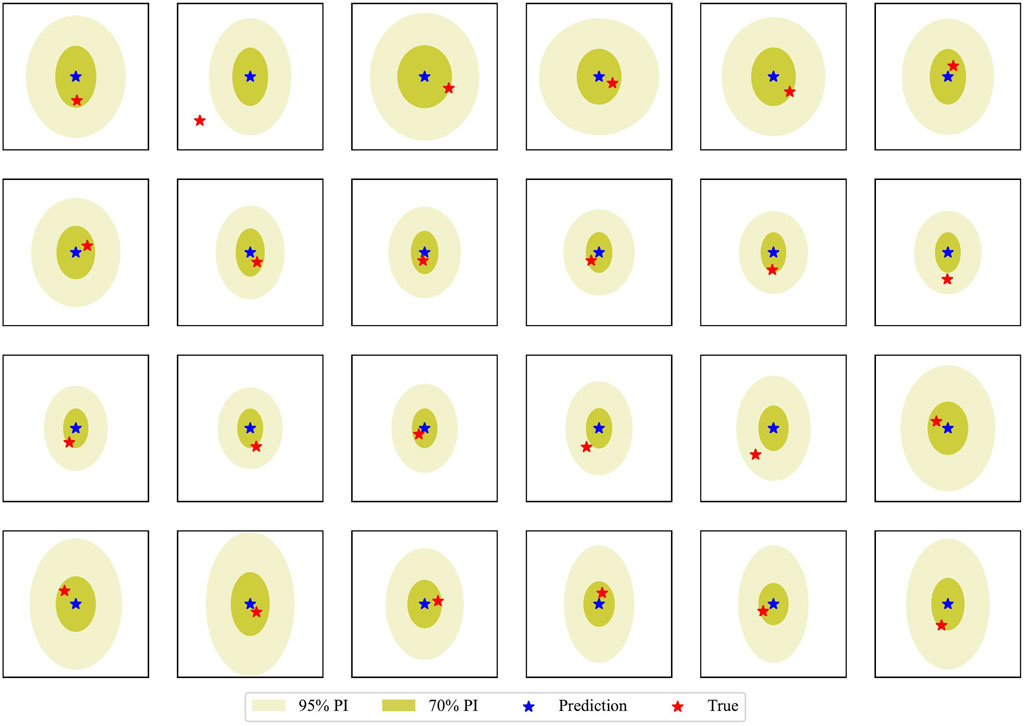
FIGURE 8. Prediction regions of the proposed track model on a test typhoon track.
The above test results indicate that the proposed MTL model yields better probabilistic predictions compared to the statistical model, the single-task MDN model, and the sequential model. Although the improvements of the proposed MTL model on PI-based accuracy are rather marginal when compared to the sequential model, the computational cost of the proposed model is much lower than the sequential model. The proposed longitude/latitude MTL models take 170.66s/159.84s to train, while the sequential models take 190.45s/196.51s. Additionally, the final value of the loss weight parameter α1 after training suggests that the weight for the deterministic loss should be at least 30 times larger than the probabilistic loss weight, suggesting that the deterministic prediction task performance is the dominating factor for the overall model performance. Therefore, by training the deterministic task well first, the sequential model can perform comparably to the MTL model. However, since the sequential model requires training two models separately, the training time will be significantly increased. Overall, the proposed MTL model provides the best performance with reasonable training time. By employing the deterministic prediction task as an auxiliary task, the probabilistic prediction performance can be improved.
3.4 Risk assessment
The proposed TC track prediction model can be easily integrated into TC risk assessment methodologies. An example use case involves evaluating the maximum sustained wind speeds during TC events. To illustrate its utility, we integrate the proposed model with both a statistical intensity forecasting model and a linear wind field model, forming a comprehensive system for appraising the maximum sustained wind speed at a wind farm site during TC occurrences.
When a TC approaches the monitoring site, like a wind farm, relevant historical TC event data is gathered from publicly available weather forecasting systems. Subsequently, this previous TC information serves as input for the proposed TC track model, in combination with the statistical intensity model, yielding anticipated future TC parameters. The wind field model is then employed to compute wind speeds at the monitoring site, utilizing the output from the TC track and intensity models. The complete workflow of the wind risk assessment system is depicted in Figure 9.
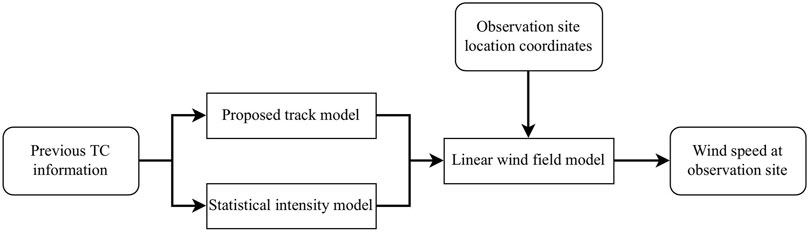
FIGURE 9. Workflow of the test risk assessment system.
In this particular study, the Guishan offshore wind farm situated at (22.155N, 113.732E) is chosen as the test site, and Typhoon Higos (2020) is selected as the TC event for testing purposes. The input TC parameters are sourced from the CMA best track dataset, as mentioned in Section 2.2, while wind speed data for verification is obtained from the Guishan offshore wind farm’s records.
Due to the intricate relationship between input TC parameters and output wind speeds within this system, calculating the PI of the wind speed using the algorithm outlined in Section 3.2.2 is unfeasible. Consequently, in this case study, the PIs for wind speeds are determined empirically. The resulting outcomes are presented in Figure 10. Analogous to the longitude and latitude predictions, the actual wind speed aligns favorably with the 95% PIs, although one value does fall beyond the 70% PI. The test system adeptly captures the uncertainty inherent in wind speed assessments.

FIGURE 10. Test results of the test wind speed assessment system.
4 Conclusion
In this paper, we proposed a novel probabilistic TC track prediction model. MDN and MTL are utilized to model the distribution of TC tracks and improve the model performance. MDN enables the NN model to make probabilistic predictions. The probabilistic prediction task performance is enhanced by learning a deterministic prediction task with shared representation in lower-level hidden layers using MTL. A training loss that considers both tasks is proposed for training the MTL model. Extensive evaluation using historical TC data shows that the proposed approach learns the probabilistic prediction task with significantly lower NLL than the statistical and single-task learning models. The results indicate that MTL is very effective in improving the probabilistic TC track prediction performance. In future work, we aim to expand our model to include more TC-related prediction tasks, such as central pressure or wind speed prediction. Other interesting directions to improve the framework include introducing time-series data to the model and automatic tuning of the MTL model structure.
Data availability statement
Publicly available datasets were analyzed in this study. This data can be found here: https://tcdata.typhoon.org.cn/en/zjljsjj.html.
Author contributions
ZJ: Writing–original draft, Writing–review and editing. XL: Writing–original draft. TZ: Writing–review and editing.
Funding
This work was supported by the State Key Laboratory of Disaster Prevention and Reduction for Power Grid under Grant SGHNFZ00FBYJJS21.
Conflict of interest
Author ZJ was employed by State Grid Hunan Electric Power Co., Ltd.
The remaining authors declare that the research was conducted in the absence of any commercial or financial relationships that could be construed as a potential conflict of interest.
Publisher’s note
All claims expressed in this article are solely those of the authors and do not necessarily represent those of their affiliated organizations, or those of the publisher, the editors and the reviewers. Any product that may be evaluated in this article, or claim that may be made by its manufacturer, is not guaranteed or endorsed by the publisher.
Abbreviations
AIC, Akaike’s information criterion; ANN, Artificial neural network; CDF, Cumulative distribution function; CLIPER, Climatology and persistence; CLIPER5, 5-day climatology and persistence; CMA, China meteorological administration; CNN, Convolutional neural network; DL, Deep learning; FC, Fully connected; HAV, Haversine distance error; LASSO, Least absolute shrinkage and selection operator; MAE, Mean absolute error; MAPE, Mean absolute percentage error; MDN, Mixture density network; MLP, Multilayer perceptron; MLR, Multiple linear regression; MSE, Mean square error; MTL, Multitask learning; NHC, National hurricane center; NLL, Negative log-likelihood; PI, Prediction interval; RMSE, Root mean square error; RNN, Recurrent neural network; SGD, Stochastic gradient descent; TC, Tropical cyclone.
References
Abadi, M., Agarwal, A., Barham, P., Brevdo, E., Chen, Z., Citro, C., et al. (2015). TensorFlow: Large-Scale machine learning on heterogeneous systems. Tech. rep. Software available from tensorflow.org.
Aberson, S. D. (1998). Five-day tropical cyclone track forecasts in the north atlantic basin. Weather Forecast. 13, 1005–1015. doi:10.1175/1520-0434(1998)013⟨1005:FDTCTF⟩2.0.CO;2
Alemany, S., Beltran, J., Perez, A., and Ganzfried, S. (2019). Predicting hurricane trajectories using a recurrent neural network. Proc. AAAI Conf. Artif. Intell. 33, 468–475. doi:10.1609/aaai.v33i01.3301468
Batts, M. E., Simiu, E., and Russell, L. R. (1980). Hurricane wind speeds in the United States. J. Struct. Div. 106, 2001–2016. doi:10.1061/jsdeag.0005541
Bose, R., Pintar, A. L., and Simiu, E. (2021). Forecasting the evolution of north atlantic hurricanes: A deep learning approach. Tech. rep. National Institute of Standards and Technology. doi:10.6028/NIST.TN.2167
Brent, R. P. (2013). Algorithms for minimization without derivatives. N. Chelmsford, MA: Courier Corporation.
Cangialosi, J. P. (2021). National hurricane center forecast verification report. Tech. rep. National Hurricane Center.
Cipolla, R., Gal, Y., and Kendall, A. (2018). “Multi-task learning using uncertainty to weigh losses for scene geometry and semantics,” in 2018 IEEE/CVF conference on computer vision and pattern recognition (Salt Lake City, UT, USA: IEEE), 7482–7491. doi:10.1109/CVPR.2018.00781
Dabrowski, J. J., Zhang, Y., and Rahman, A. (2020). “ForecastNet: A time-variant deep feed-forward neural network architecture for multi-step-ahead time-series forecasting,” in Neural information processing: 27th international conference (Bangkok, Thailand: Springer), 12534, 579–591. doi:10.1007/978-3-030-63836-8_48
Emanuel, K., Ravela, S., Vivant, E., and Risi, C. (2006). A statistical deterministic approach to hurricane risk assessment. Bull. Am. Meteorological Soc. 87, 299–314. doi:10.1175/BAMS-87-3-299
Fang, W., Lu, W., Li, J., and Zou, L. (2022a). A novel tropical cyclone track forecast model based on attention mechanism. Atmosphere 13, 1607. doi:10.3390/atmos13101607
Fang, Y., Sun, Y., Zhang, L., Chen, G., Du, M., and Guo, Y. (2022b). Stochastic simulation of typhoon in Northwest Pacific basin based on machine learning. Comput. Intell. Neurosci. 2022, 1–16. doi:10.1155/2022/6760944
Fu, X., Guo, Q., and Sun, H. (2020). Statistical machine learning model for stochastic optimal planning of distribution networks considering a dynamic correlation and dimension reduction. IEEE Trans. Smart Grid 11, 2904–2917. doi:10.1109/TSG.2020.2974021
Fu, X., and Niu, H. (2022). Key technologies and applications of agricultural energy internet for agricultural planting and fisheries industry. Information processing in agriculture. S2214317322000841. doi:10.1016/j.inpa.2022.10.004
Fu, X. (2022). Statistical machine learning model for capacitor planning considering uncertainties in photovoltaic power. Prot. Control Mod. Power Syst. 7, 5. doi:10.1186/s41601-022-00228-z
Fu, X., and Zhou, Y. (2022). Collaborative optimization of PV greenhouses and clean energy systems in rural areas. IEEE Trans. Sustain. Energy 1, 642–656. doi:10.1109/TSTE.2022.3223684
Hall, T. M., and Jewson, S. (2007). Statistical modelling of North Atlantic tropical cyclone tracks. Tellus A Dyn. Meteorology Oceanogr. 59, 486. doi:10.1111/j.1600-0870.2007.00240.x
Hao, F., Dou, L., and Jin, J. (2021). “Mixture density networks for tropical cyclone tracks prediction in south China sea,” in 2021 international joint conference on neural networks (IJCNN), 1–8.
Hope, J. R., and Neumann, C. J. (1970). An operational technique for relating the movement of existing tropical cyclones to past tracks. Mon. Weather Rev. 98, 925–933. doi:10.1175/1520-0493(1970)098<0925:aotfrt>2.3.co;2
James, M. K., and Mason, L. B. (2005). Synthetic tropical cyclone database. J. Waterw. Port, Coast. Ocean Eng. 131, 181–192. doi:10.1061/(asce)0733-950x(2005)131:4(181)
Knaff, J. A., DeMaria, M., Sampson, C. R., and Gross, J. M. (2003). Statistical, 5-day tropical cyclone intensity forecasts derived from climatology and persistence. Weather Forecast. 18, 80–92. doi:10.1175/1520-0434(2003)018⟨0080:SDTCIF⟩2.0.CO;2
Leith, C. (1974). Theoretical skill of Monte Carlo forecasts. Mon. weather Rev. 102, 409–418. doi:10.1175/1520-0493(1974)102<0409:tsomcf>2.0.co;2
Lian, J., Dong, P., Zhang, Y., and Pan, J. (2020). A novel deep learning approach for tropical cyclone track prediction based on auto-encoder and gated recurrent unit networks. Appl. Sci. 10, 3965. doi:10.3390/app10113965
Lu, X., Yu, H., Ying, M., Zhao, B., Zhang, S., Lin, L., et al. (2021). Western north pacific tropical cyclone database created by the China meteorological administration. Adv. Atmos. Sci. 38, 690–699. doi:10.1007/s00376-020-0211-7
Mullen, S. L., and Baumhefner, D. P. (1994). Monte Carlo simulations of explosive cyclogenesis. Mon. weather Rev. 122, 1548–1567. doi:10.1175/1520-0493(1994)122<1548:mcsoec>2.0.co;2
Qin, W., Tang, J., Lu, C., and Lao, S. (2022). A typhoon trajectory prediction model based on multimodal and multitask learning. Appl. Soft Comput. 122, 108804. doi:10.1016/j.asoc.2022.108804
Rappaport, E. N., Franklin, J. L., Avila, L. A., Baig, S. R., Beven, J. L., Blake, E. S., et al. (2009). Advances and challenges at the national hurricane center. Weather Forecast. 24, 395–419. doi:10.1175/2008WAF2222128.1
Risi, C. (2004). Statistical synthesis of tropical cyclone tracks in a risk evaluation perspective. Tech. rep. Massachussets Institute of Technology.
Robbins, H., and Monro, S. (1951). A stochastic approximation method. Ann. Math. statistics 22, 400–407. doi:10.1214/aoms/1177729586
Rumelhart, D. E., Hinton, G. E., and Williams, R. J. (1986). Learning representations by back-propagating errors. nature 323, 533–536. doi:10.1038/323533a0
Russell, L. R. (1971). Probability distributions for hurricane effects. J. Waterw. Harb. Coast. Eng. Div. 97, 139–154. doi:10.1061/awhcar.0000056
Simon, A., Penny, A. B., DeMaria, M., Franklin, J. L., Pasch, R. J., Rappaport, E. N., et al. (2018). A description of the real-time hfip corrected consensus approach (hcca) for tropical cyclone track and intensity guidance. Weather Forecast. 33, 37–57. doi:10.1175/waf-d-17-0068.1
Snaiki, R., and Wu, T. (2020). Revisiting hurricane track model for wind risk assessment. Struct. Saf. 87, 102003. doi:10.1016/j.strusafe.2020.102003
Tryggvason, B. V., Davenport, A. G., and Surry, D. (1976). Predicting wind-induced response in hurricane zones. J. Struct. Div. 102, 2333–2350. doi:10.1061/jsdeag.0004496
Vickery, P. J., Skerlj, P. F., and Twisdale, L. A. (2000). Simulation of hurricane risk in the U.S. Using empirical track model. J. Struct. Eng. 126, 1222–1237. doi:10.1061/(asce)0733-9445(2000)126:10(1222)
Ying, M., Zhang, W., Yu, H., Lu, X., Feng, J., Fan, Y., et al. (2014). An overview of the China meteorological administration tropical cyclone database. J. Atmos. Ocean. Technol. 31, 287–301. doi:10.1175/jtech-d-12-00119.1
Zhang, K., Feng, M., and Lei, D. (2019). Review of the defense work of typhoon lekima no.201909. China Flood Drought Manag. 29, 8–11+15. doi:10.16867/j.issn.1673-9264.2019190
Zhang, S., and Nishijima, K. (2012). “Statistics-based investigation on typhoon transition modeling,” in Proc. Seventh int. Colloquium on bluff body aerodynamics and application, 364–373.
Keywords: tropical cyclone, track prediction, multitask learning, mixture density network, deep learning
Citation: Jian Z, Liu X and Zhao T (2023) A probabilistic track model for tropical cyclone risk assessment using multitask learning. Front. Energy Res. 11:1277412. doi: 10.3389/fenrg.2023.1277412
Received: 14 August 2023; Accepted: 04 September 2023;
Published: 28 September 2023.
Edited by:
Zhengmao Li, Aalto University, FinlandReviewed by:
Yang Zhang, Royal Institute of Technology, SwedenYalong Li, China University of Mining and Technology, Beijing, China
Copyright © 2023 Jian, Liu and Zhao. This is an open-access article distributed under the terms of the Creative Commons Attribution License (CC BY). The use, distribution or reproduction in other forums is permitted, provided the original author(s) and the copyright owner(s) are credited and that the original publication in this journal is cited, in accordance with accepted academic practice. No use, distribution or reproduction is permitted which does not comply with these terms.
*Correspondence: Xuan Liu, eGxpdTUxNEBnbWFpbC5jb20=