 Muhammad Yousaf Raza1
 Boqiang Lin2*
- 1School of Economics, Shandong Technology and Business University, Yantai, Shandong, China
- 2School of Management, China Institute for Studies in Energy Policy, Xiamen University, Xiamenm, Fujian, China
Pakistan is moving toward the large-scale use of coal. Coal plays a dominant role in Pakistan’s energy mix and is estimated to reach 30% by 2030. The purpose of this study is to analyze coal imports and indigenous reserves in relation to CO2 emissions. In particular, this study constructs the logarithmic mean Divisia index (LMDI) method to see the impact of the factors, decoupling index for the economic relationship, and pollution from coal-fired power plants from 1986 to 2019. The empirical results show that 1) coal consumption and imports are interrelated, while coal production has had the lowest production level since 1986; 2) the energy intensity impact plays a medium role in decreasing coal utilization, followed by the coal share effect; however, the aggregated impact accounts for 0.023% of the total coal use; 3) the economic and population activity effects progressively increase with coal consumption by 0.25% and 0.35%, respectively, with the annual average growth; 4) only “three” decoupling states were observed: expansive coupling, expansive negative decoupling, and weak decoupling. Expansive negative decoupling occurred due to high energy share and energy intensity. Expansive coupling occurred only in 2001 due to rapid growth in coal proportion and a sluggish decrease in energy intensity, and weak decoupling showed a decoupling association between economic growth and coal utilization; and 5) the various coal compositions, such as moisture, volatile matter, fixed carbon, ash, and sulfur, can be evaded by 1.82, 4.83, 5.16, 1.43, and 0.39 Mt currently. Finally, environmental analysis recognized that implementing clean coal technologies significantly saves fuel and, consequently, reduces emissions. This study also discusses further policies.
1 Introduction
Energy consumption has become one of the important influences on an individual country’s economic development, environment, climate change, food security, health, employment, and social factors (Zheng and Walsh, 2019). For huge production, the world protected and applied multiple huge fuels, particularly for emerging nations, which will influence localities, people, living standards, and natural resources (Lin and Raza, 2019). Being the second largest populated nation in South Asia, Pakistan has stayed on the rising focused agenda, lined with vast investments from established countries such as the United States (US), China, and Russia.
Pakistan has the world’s seventh largest coal reserves, with a heating value of approximately 9,000 British thermal units (Btu/lb) and reserves of 185.175 billion tons (Pakistan Energy Vision, 2016; Vision, 2035, 2014). This was discovered in 1991 by Pakistan’s Geological Survey and the US agency for international development. This will maximize coal consumption (CC) in the energy sector before 2025 in terms of coal efficiency, electricity supply, electricity demand, and energy production. Currently, coal fulfills the commercial energy needs of Pakistan by 15.4%. The domestic production of coal was 5.46 million tons of oil equivalents (Mtoe) in 2019, which showed an increase of 34.3% over the previous year, while coal production started flowing from the Thar coal field (HDIP, 2019), in which coal imports increased by 14.6% during 2019. As shown in Figure 1, the overall coal consumption increased significantly by 19.7% compared to the previous year.
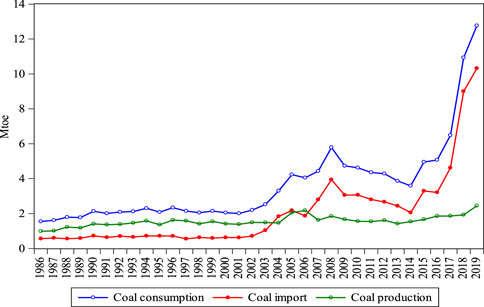
FIGURE 1. Pakistan’s coal consumption, production, and import from 1986 to 2019.
Regarding the energy mix, Pakistan is attempting to encourage coal consumption and increase its share in the energy mix because of energy security. The energy mix of oil, coal, gas, and LPG was counted at 31.58%, 18.72%, 31.4%, and 2.1% in 2019, respectively (HDIP, 2019), as shown in Figure 2. It is obvious that coal consumption is the third highest fuel in the energy mix and shows a positive trend over the period. Coal is the main energy source in Pakistan and plays a strategic role in the country’s economic development. Due to its abundance in proven reserves and its constancy in supply, coal will continue to be an imperative component of the primary energy mix in the country, at least over the next few decades. Although it adds to a large share of greenhouse gas (GHG) emissions, reducing this carbon-constrained worldwide environment is unavoidable, and the Pakistan coal industry might be significantly influenced by GHG emission reduction policies. As a developing country in Asia, Pakistan’s growing population and industrialization influenced huge energy utilization in various sectors, which rely heavily on fossil fuels (i.e., oil, coal, and gas) (Lin, B., & Raza, 2020a). Currently, domestic energy resources cannot meet the increasing energy demand; thus, the government should utilize clean technologies to reduce the pollution and energy crisis in the country. This study, therefore, measures the population, economic activities, energy intensity, and coal share for 34 years, which are the key factors in increasing the economy. Given the availability of current information about coal emissions in 2019, we estimated plant efficiency.
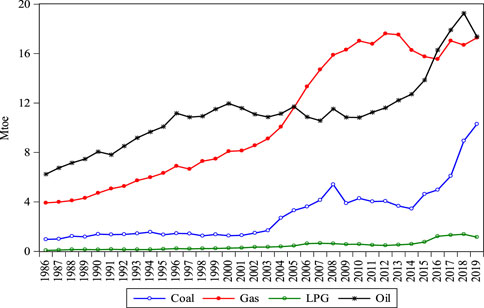
FIGURE 2. Pakistan’s energy mix from 1986 to 2019.
Pakistan is still in the initial development phase compared to advanced and developing countries. It is unavoidable that Pakistan needs additional energy to fulfill its domestic demands. However, the coal-related energy framework has led to grave ecological pollution. Confronted with the huge pressure of national environmental safety and worldwide climate variation, regulating fast-growing coal consumption has become a key concern for the government of Pakistan. Thus, investigating the decoupling association between coal utilization and economic growth (EG) may benefit from distinguishing energy policy and energy security strategy.
As per Kraft and Kraft (1978), many researchers have broadly reviewed the association between EG and energy consumption (EC). However, such research did not reach a definite decision regarding the causative direction between EG and EC. Few studies found directional causalities using extended datasets. For example, Abosedra and Baghestani (1989) for the US from 1947 to 1987; Narayan and Smyth (2005) for Australia; Ho and Siu (2007) for Hong Kong; Hu and Lin (2008) for Taiwan; Zhang and Cheng (2009) for China; Acaravci (2010) for Turkey; and Payne and Taylor (2010) found unidirectional causality. Several studies also investigated the bidirectional causality between EC and EG; for example, by investigating facts for G-7 and G-10 developing countries besides Pakistan, Soytas and Sari (2003) found bidirectional causality between energy use and economy in Argentina from 1950 to 1990.
Moreover, research on the existing topic has concentrated on emerging nations; for example, Yuan et al. (2007) for China using the cointegration method between electricity and EG; Chiou-Wei et al. (2008) for the US and Asian emerging countries using linear and nonlinear Granger causality tests; Ruhul et al. (2008) for six non-Organization of Economic and Cooperation Development (OECD) Asian emerging nations using Granger causality; Bowden and Payne (2009) for the US using Granger causality; Yoo and Ku (2009) for 20 European and Asian countries using cointegration; and Ozcan and Ari (2015) for 15 OECD countries using bootstrap causality tests. However, they found unidirectional and bidirectional causalities among the variables.
In various countries, numerous researchers have investigated coal ingestion and its significance for EG using new and longer time-series statistics. Jinke et al. (2008) reviewed the causative association between coal utilization and EG in the main OECD and non-OECD countries. Yang et al. (2020) analyzed the structural path for China’s coal consumption using input–output methods and found that investment, exports, and households are the main factors in coal consumption. Asghar (2008), for five South Asian countries using causality analysis from 1971 to 2003, found that there is a unidirectional causality running from coal to economic growth in Sri Lanka, Bangladesh, and Pakistan. Wolde-Rufael (2010) used the causality analysis between coal consumption and EG for “six” key coal-consuming nations, covering the period of 1965–2005, and found that there is a unidirectional causality running from coal to economic development in India and Japan; however, an opposite causality was estimated in China and Korea. Li and Leung (2012) investigated the association between China’s coal consumption and real GDP using panel data and revealed that there is a bidirectional causality in the coastal and central regions and a unidirectional causality in the Western region. Bloch et al. (2012) analyzed a similar factor’s association in China. Bildirici and Bakirtas (2014) analyzed the causality for six Asian and European countries from 1980 to 2011 using long-run causality analysis found between coal and economic growth with a bidirectional causality for India and China, and Lei et al. (2014) used the causality investigation between coal utilization and economic development for the US, and European and Asian countries over 2000–2010. They estimated a bidirectional causality association between coal use and economic development in Russia, Japan, and Germany; however, a unidirectional causality exists only in China. Govindaraju and Tang (2013) used the robust technique of cointegration to obtain conclusive outcomes between EG and coal consumption in China and India. They revealed that there is a bidirectional causal relationship between coal and economic growth, both in the short and long-run periods. Raza and Shah (2019) used causality analysis among domestic factors in Pakistan from 1981 to 2017 and found that there is bidirectional causality between coal consumption and economic growth both in the long and short run. Lin and Raza (2020b) employed input–output analysis for coal consumption of various sectors in Pakistan from 1999 to 2018. They estimated that the economic scale is the factor that drives the growing coal use in Pakistan. Khan et al. (2020) investigated the overall energy and carbon emissions of various sectors using the quantile regression method but could not differentiate which fuel is more efficient in a rising economy. With the positive results of past studies, the coal and economic factors in the current era’s decoupling are yet to be analyzed, especially for Pakistan.
However, whether economies are becoming less reliant on sources of energy assets has become another imperative issue. The decoupling investigation has become an imperative technique to examine these issues; decoupling is a strand of research on the dilemma between EG and carbon pollution, the concept of which was originally taken from the field of physics. Zhang (2000) initially used the decoupling analysis definition to investigate the association between CO2 emissions and EG in China at the start of the 2000s. OECD defines decoupling as dissociating economic growth from environmental degradation, such as by breaking the relationship between them (OECD-2010, 2002). In 2002, this analysis was generally applied and formally defined by the OECD. This analysis is generally applied in the carbon emission-related literature at the country, sector, and regional levels (Grand, 2016; Raza and Lin, 2020). Presently, there are two methods of determining the decoupling association among energy, energy-related emissions, and EG.
First, as per Juknys (2003), there are three types of decoupling (i.e., primary, secondary, and double decoupling). However, primary decoupling is the decoupling relationship between natural resource utilization and EG. Secondary decoupling is the decoupling of ecological pollution from utilizing natural resources. Double decoupling occurs if both primary and secondary decoupling occur meanwhile. Thus, following Juknys’ decoupling thought, Tapio (2005) re-defined the Tapio decoupling indicator and found “three” decoupling states, i.e., decoupling, coupling, and negative decoupling. This showed the decoupling of states in the transport sector of Europe. For a better understanding, Tapio divided “three” decoupling states into “eight” logical possibilities (i.e., weak negative decoupling, weak decoupling, expansive decoupling, strong decoupling, expansive negative decoupling, recessive coupling, expansive coupling, and strong negative decoupling), which are presented in the following section. After that, the decoupling index proposed by Tapio was broadly applied to investigate the impact of energy, the economy, and the environment. For example, De Freitas and Kaneko (2011) applied the Tapio index for Brazil’s CO2 emissions and EG over 2004–2009; Zhang et al. (2018) employed Tapio decoupling to estimate the association between coal ingestion and EG in China; Raza and Lin (2020) used this technique to estimate EC and EG for Pakistan’s transport sector over 1984–2018; and Lin and Raza (2021) employed a similar method to estimate electricity utilization and EG in Pakistan from 1989 to 2018.
Following the logarithmic mean Divisia index (LMDI) technique, Zhang et al. (2015) discussed the major motivations for the decoupling process, while Diakoulaki and Mandaraka (2007) stated a decoupling indicator that was applied to evaluate the actual struggles assumed in the individual region and their impact on decoupling the environmental dimensions and EG. For this, Zhang et al. (2013) measured the decoupling relationship between electricity uses from EG in China. This technique was also employed by Zhang and Guo (2013) and Zhang et al. (2018) for Chin’s EC and per capita income. Furthermore, clean coal technologies (CCTs) aim to lessen the ecological influence of coal consumption and include technologies for organizing coal, coal gasifying, and enhancing efficiency in power plants, eliminating contaminants for CO2 emission and storage. For this reason, investments in CCTs are costly and employed only if they are maintained by technical, ecological, and economic viability (Mishra et al., 2015). To be considered a CCT, coal-fired power plants should fulfill a minimum of one of the given standards: a) high production compared to the traditional power plants because of their operation at maximum pressures and temperatures; b) based on the carbon storage system; and c) minimize nearby pollutants (i.e., heavy metals, particular matter, NOx, and SOx). This system, together with other machines that permit lessening emissions, could drive each plant’s discharges to near “0” (Rocha et al., 2021). Thus, the applicability of CCTs in various coal power plants considerably influences overall efficiency and pollution reduction. Moreover, subcritical, supercritical, and ultra-supercritical coal-fired plants are samples of CCTs since they permit clean and highly proficient coal use, making it feasible to produce energy with minimum environmental pollution (Oboirien et al., 2018). The statement of supercritical originates from the thermodynamic concept of the critical point, which, for water, mentions the condition with a pressure of 22 MPa and a temperature of 374°C; in a process where steam situations are higher than that, this point is named supercritical. On the other hand, ultra-supercritical is more advanced than supercritical, which is usually stated for systems including a pressure of steam higher than 25 MPa and a temperature of more than 580°C, but it varies from country to country (Fan et al., 2018). Therefore, this research measures the various coal compositions that influence the environment at lower heating values (LHVs); however, they also carry a greater carbon emission of produced energy at that time. Thus, the objective of the environmental excellence index is to examine the extensive variability of coal compositions, which might support future decisions. Thus, this study adds to the literature on aspects of CCTs, fired-power plant efficiency, and integrating economic and ecological aspects, particularly for Pakistan.
To date, numerous scholars have concentrated on the relationship between EC and EG in Pakistan using causality and simple regression methods. Furthermore, there is a strong association between EG and EC in Pakistan (Lin and Raza, 2020a). Thus, using these factors for Pakistan’s productivity, a study that impacts coal consumption, coal efficiency, and CCT is not yet analyzed. This research aims to answer the current issue. Currently, the decoupling indicator is based on the decomposition outcome status, of which the state lies in coal consumption and Pakistan’s EG, such as the strong, weak, or no decoupling state. Moreover, the description of the decoupling indicator is controlled by whether the economic activity impact is negative or positive. Ang (2004) decided that the LMDI technique was ideal compared with different decomposition approaches. In order to reduce this issue, the existing study again applies a decoupling indicator based on the decomposition outcomes of the LMDI process.
This study has the following motivations: first, the position of indigenous coal production, coal consumption, and coal imports is investigated. Second, the LMDI technique is employed to discover the influence of the factors that affected coal consumption in Pakistan from 1986 to 2019. Third, a decoupling index is established based on decomposition outcomes, which are applied to estimate the decoupling association between coal consumption and EG in Pakistan. Fourth, the research analyzes the efficiency range of highly effectual coal (i.e., supercritical and ultra-supercritical) compared to subcritical power plants at lower and higher heating values (HHVs). Importantly, it quantifies i) environmental impacts using coal-fired power plants; ii) subcritical, supercritical, and ultra-supercritical technologies at lower and higher heating values; iii) carbon emissions avoided under various coal composition components; and iv) the country’s economic valuation using up-to-date data to describe the systematic, influential, and realistic picture of the coal power system. Thus, this study first attempted to analyze the factor’s decomposition and decoupling progress with coal technology installed in Pakistan. Finally, the study provides energy security, CCT efficiency, and import reduction policies for Pakistan under the umbrella of the Intended Nationally Determined Contribution (INDC) (Vision 2025–2035, 2014) and coal plans linked to the China–Pakistan Economic Corridor (CPEC). In addition, few studies have been conducted nationally or internationally; for instance, Yin and Zhao (2023) conducted a descriptive analysis to analyze a clean, low-carbon, and diversified modern rural new energy system for China. Yu and Yin (2023) used a quantum evolutionary game model for new energy enterprises and village collectives. Raza and Dongsheng (2023) employed the decomposition method to investigate the carbon damage and carbon sources in Pakistan. Zhao et al. (2023) used the evolutionary game method to develop a green novel environment in photovoltaic building materials for manufacturing mechanisms. Raza and Lin (2023) used decomposition analysis for Bangladesh’s natural gas consumption. They analyzed the energy, economy, and pollution effects based on energy aggregates or an individual source using limited factors without discussing the current measures. With the intention of enhancing past research, the novelty of the present research is to apply more accurate measures of energy efficiency. Due to different factors employed in various countries, sectors and individual countries have developed their own models using economic growth, energy consumption, fossil fuels, renewable energy, etc., at different time intervals (e.g., Ang, 2004; Ang and Liu, 2007; Diakoulaki and Mandaraka, 2007; Lin and Raza, 2020a; Zhao et al., 2023) in the literature due to their desirable properties. Few of the past studies have analyzed countries’ energy efficiency based on decomposition models (Goh and Ang, 2019); however, they missed individual fuel consumption and their efficiency in the process of energy–economic growth. For forecasts and policy estimations, only a few studies have analyzed industrialized countries or regions without using the current factors of this study. On this basis, the present study fills the gap in previous work, observing current progress in the decomposition analysis and reporting the results of the main economic factors and their efficiency. Based on study objectives and motivations, our study answers the following questions: what are the key impacting factors that actually lead to energy and economic activity? What are the factors that decouple coal from economic growth? What has been the relationship between coal production, imports, and consumption since 1986? What are the effects of LHVs and HHVs of fuel in the current period? Which policies are imperative to distinguish fuel and economic sustainability in Pakistan? Thus, the current study will bridge the gaps in the coal sector and encourage evidence-based scientific models that are significantly useful for academics and policymakers, particularly in emerging countries, toward sustainability.
The remaining portion of the study is structured as follows: Section 2 provides the methodologies employed in this study; Section 3 describes data collection and its sources; Section 4 presents the major results; and Section 5 concludes the results and policy implications.
2 Research and data methodology
2.1 Logarithmic mean Divisia index
The LMDI technique can be shown as an extended Kaya identity, which was first established by Kaya (1989). This technique is generally employed to analyze the impacting factors, including energy consumption and pollution emissions (Lin and Raza, 2019). The selected variables (i.e., coal consumption, economic progress, population, and total energy consumption) are significant and define the strength and effects. Thus, the LMDI technique is employed to estimate the variations in various sectors and coal utilization in Pakistan and can be applied to test the economic situation. Therefore, the existing variables are imperative to analyze their relationship because Pakistan’s small economy depends on coal (Lin and Raza, 2020b). Currently, the decomposition can be estimated in two ways: a) structural decomposition analysis (SDA) and b) index decomposition analysis (IDA). IDA has been broadly employed to better analyze trends of influencing factors in energy and emissions, which are consistent with the studies by Wang et al. (2017), Raza and Lin (2019), and Wei et al. (2020), considering time-series statistics is the key benefit of IDA. Furthermore, the IDA method has “two” approaches: a) the LMDI technique and b) the complete decomposition technique. By matching different IDA approaches, Ang (2004) found that LMDI was the best technique. The major advantage of the LMDI method is that it deals with zero-value problems and is also commonly used in energy analysis and its impact on other influencing factors (i.e., CO2, population, energy intensity, etc.). To handle “0” values in the LMDI technique, Ang and Liu (2007) described eight strategies. However, the decomposition model for coal consumption could not include important factors, e.g., the efficiency of coal-fired power generation and share in total electricity, due to the unavailability of information. Thus, we estimated fuel and environmental efficiency for the current period, which could be further analyzed using the decomposition method based on information availability. In the existing research, the LMDI technique is applied to decompose coal utilization into some impacting factors. Regarding the modeling process, coal consumption is an energy-related aggregate, four major factors contribute to variations in coal consumption over time, and an individual factor is linked to a quantifiable variable, whereby there are different variables (i.e., coal, total energy, economic growth, and population). The general IDA identity is given in Eq. 1.
where CC, TEC, GDP, POP, and t indicate the coal consumption, total energy consumption, gross domestic product, population, and time in years, respectively.
The variation in coal utilization in Pakistan between 0 and t year (base year to the current year), represented by
where
The index number form could be as follows:
2.2 Decoupling analysis
The decoupling method confirms the relationship between the associated variables. As per the statement of various factors shown in Section 2.1,
As per the proportion of efforts lessening coal consumption and its leading influences that drive CC and the decoupling standards given by Tapio (2005), eight types of decoupling states are stated in the present study, as shown in Table 1. The annual growth rate of coal consumption is less than or equal to zero, showing that coal use is absolutely decoupled from economic growth.
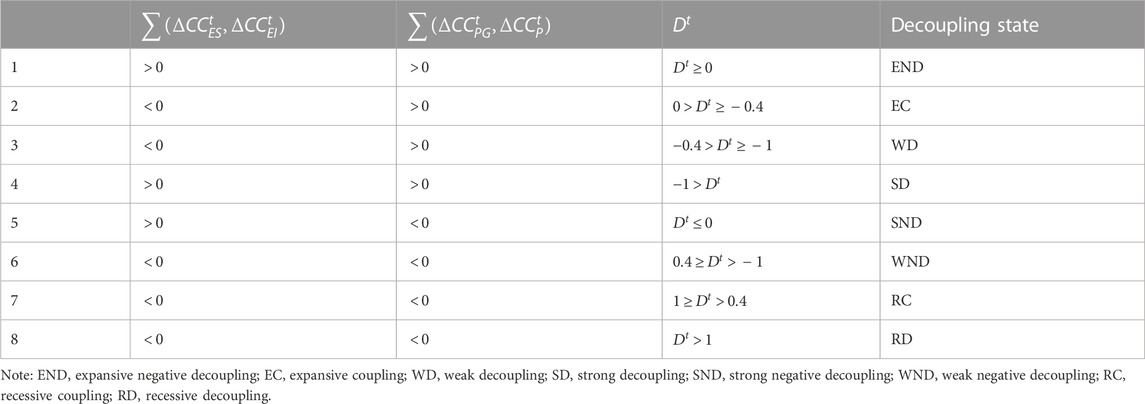
TABLE 1. Evaluation criteria of the decoupling indicator.
2.3 Fuel efficiency and CO2 emissions
The estimation was conducted by observing the current installed capacity based on its efficiency as per the operation technology. In this way, the analysis is linked with a study by Rocha et al. (2021). The method established is a mechanism to analyze various substitutes from fuel efficiency and environmental viewpoints, showing how coal composition can influence decision-making. The scope for enhancement of the investigation was established with an installed capacity of 186,700 million tons of coal reserved and an LHV and HHV of 174,346 and 239,910 Btu/lb, respectively, as shown in Table 2. Table 2 shows an efficiency range for supercritical and ultra-critical technologies since there is an efficiency range for similar technologies because of additional factors independent of the technology used. However, as per HDIP (2019), investigating the coal-fired plants as a whole, the average value is 0.4, while novel plants might have a maximum capacity factor greater than 0.5; therefore, standardizing the boundary conditions of the research that accepts current units will function on the basis of the country’s structure.
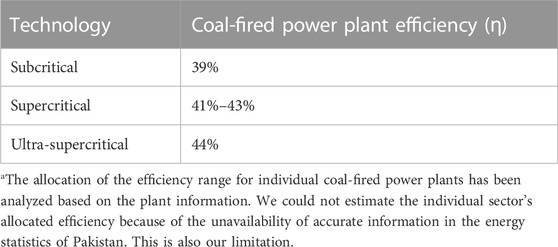
TABLE 2. Allocation of the efficiency range set for individual estimated technologya.
Thus, to calculate the fuel efficiency of the individual set, situations for the enhancement of environmental investigations can be taken as by Eq. 10:
where
Furthermore, the environmental estimation was conducted by estimating the CO2 emissions using the various coal compositions and computing how the plant productivity can support encouraging an energy matrix with a lower intensity of CO2 releases. Thus, the CO2 emissions rate and the emission factors regarding various coal compositions can be calculated by Eq. 11. Eq. 11 makes it probable to obtain the carbon emission rate and the emission factor in million tons. The CO2 releases avoided by the process with maximum efficiency are considered. Further outcomes are discussed in the following section.
where
2.4 The data
The study period in the current study is from 1986 to 2019. The present study used yearly time-series data bounding a period of 34 years on the maximum availability of data. Furthermore, the various industries (i.e., cement, brick kilns, Pak steel, power, and domestic sectors) played an active role and mostly motivated the country’s economy. Due to the intensive usage of coal in the cement, brick kilns, and power sectors in Pakistan, the development in these sectors is naturally linked with an increase in coal consumption. As per HDIP (2019), the cement/other sectors consumed the maximum coal by 47.5%, the power sector by 27.4%, and brick kilns by 25% in 2019. All the energy-related data in the existing research are collected from different annual books of HDIP (2019). The measurement unit of energy data is taken as Mtoe. Because of the lack of data on Pakistan’s provinces, i.e., Punjab, Sindh, Baluchistan, Khyber Pakhtunkhwa, Gilgit-Baltistan, and Azad Jammu and Kashmir, this study does not include these six provinces and states. The GDP data are composed of WDI (2020). The unit of GDP is a million USD at a constant 2010 price. Population data are obtained from the World Development Indicators and the Pakistan Economic Survey (2020). All the population data have been arranged in millions. Data related to aggregate coal-fired power plants’ LHV, HHV, coal-installed power capacity, and coal composition are collected from HDIP (2019). The measurement units of LHV and HHV are considered to be Btu/lb, coal power capacity as million tons, and the overall estimated coal-fired plant efficiency and coal composition data as a percent.
3 Empirical outcomes and discussion
3.1 Description of Pakistan’s coal reserves/resources
Pakistan’s coal production, coal consumption, and import trends are shown in Figure 1. It can be seen that coal utilization and coal imports in Pakistan increased by a record after 2014. Coal consumption and imports reached 12.76 Mtoe and 10.32 Mtoe from 1.54 Mtoe and 0.56 Mtoe from 1986 to 2019, with an average rate of 9.6% and 17.4%, respectively. During the period, the increase in coal production did not cause significant fluctuations. In 2019, the indigenous coal production was 2.44 Mtoe, which increased at an average rate of 1.48% from 1986 to 2019. The reason is that since 2014, Pakistan has become a net coal importer, which has stopped indigenous coal production at the demand level. Although coal accounted for exceeding 24.5% of the overall primary energy consumption in 2019, in 1986, 6.15% of coal was consumed by various industrial sectors (HDIP, 2019).
Table 3 shows the available coal reserves in Pakistan during the current period. However, the trend in Figure 1 shows that Pakistan’s coal energy consumption statistics are becoming more and more accurate. Various coalfields have not changed from 2014 to 2019, as per available information because of Pakistan’s high energy crisis; the energy shortfall surpasses 6,000 megawatts (Lin and Raza, 2019). The rapid demand for energy from increasing demographic burdens and extreme industrial development has added to the crisis. Currently, domestic coal plays a small role in the energy mix; notwithstanding, the Thar Desert is one of the biggest underdeveloped coal assets in the world. The annual demand of Pakistan for coal exceeds the supply; therefore, Pakistan depends on foreign coal to satisfy its needs, especially for industrial consumption. Based on the availability of huge coal resources (see Table 3), the aim of emerging Thar coal deposits is to produce energy from Pakistan’s coal assets, to lessen the imported coal dependency, and to add toward bridging the gap between energy demand and supply.
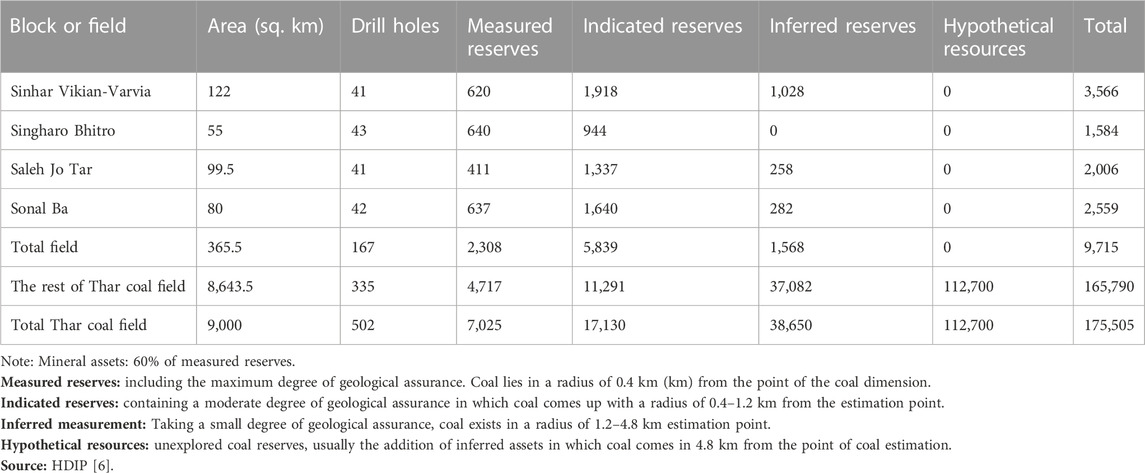
TABLE 3. Present Thar coal reserves on 30 June 2019 (million tons).
Thar, with 175 billion tons of coal, is home to the seventh biggest coal mine in the world and is predictable as a merely feasible and supportable outcome of Pakistan’s shortfall. Based on huge field assets linked in energy terms to the collective oil reserves of Saudi Arabia and Iran, they are proficient in generating 100,000 megawatts of electricity for the next 200 years. Based on various blocks/fields, coal drilling, and different reserves, the current situation suggests that a cheap and sustainable energy roadmap for Pakistan is necessary to exploit the utilization of domestic resources in mixed energy. To reduce the energy crisis and increase energy security, the government is also determined to improve coal capacity to approximately 38,000 megawatts by 2047 using the Indicative Generation Capacity Expansion Plan (IGCEP). Moreover, CPEC, worth $46 billion, frequently focuses on energy projects, of which $6.4 billion is bound for coal energy employing clean coal technologies.
Overall, during the study period, the cement sector was the highest coal user (54.3%) amongst all the other subdivisions, i.e., power (27.4%), brick kilns (25%), and coke use (1.7%) in 2019 (HDIP, 2019). In 2019, coal consumption by the power sector increased by 105.6%, the industrial sector by 23.5%, and brick kilns by 14.6% compared to the previous year, 2018. However, the domestic sector stopped coal consumption after 2007, which was 2.33% of the total coal consumption; therefore, the industrial sector is the most nominated end user of coal in the current study. Thus, the share of the remaining sectors remains relatively consistent during the study period and is forthcoming.
3.2 Decomposition analysis
Decomposition outcomes based on the LMDI approach are shown in Table 4. The energy intensity effect (

TABLE 4. Decomposition analysis with various factor variations from 1986 to 2019 (unit: %).
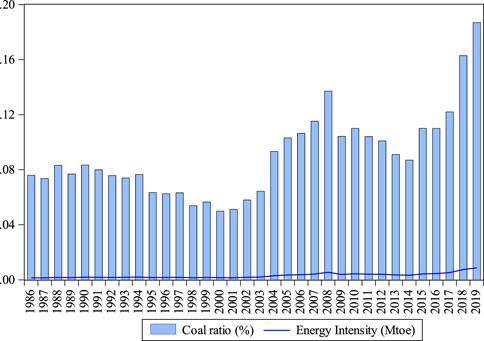
FIGURE 3. Trend in Pakistan’s energy intensity and coal ratio from 1986 to 2019. Source: author’s calculation.
As shadowed by
The economic activity effect (
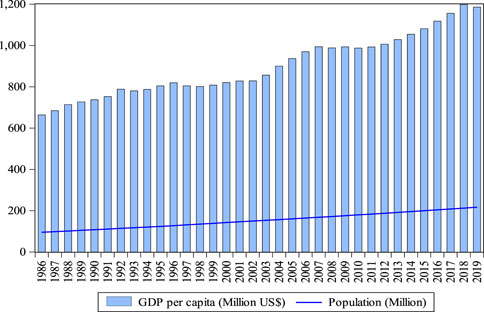
FIGURE 4. Trend in Pakistan’s GDP per capita and population from 1986 to 2019 (Pakistan Economic Survey, 2019-2020; WDI, 2020).
3.3 The decoupling estimations
As per the decoupling index (DI) definition in Section 2.2, DI is stated as the proportion of the total of coal share influence and energy intensity effect
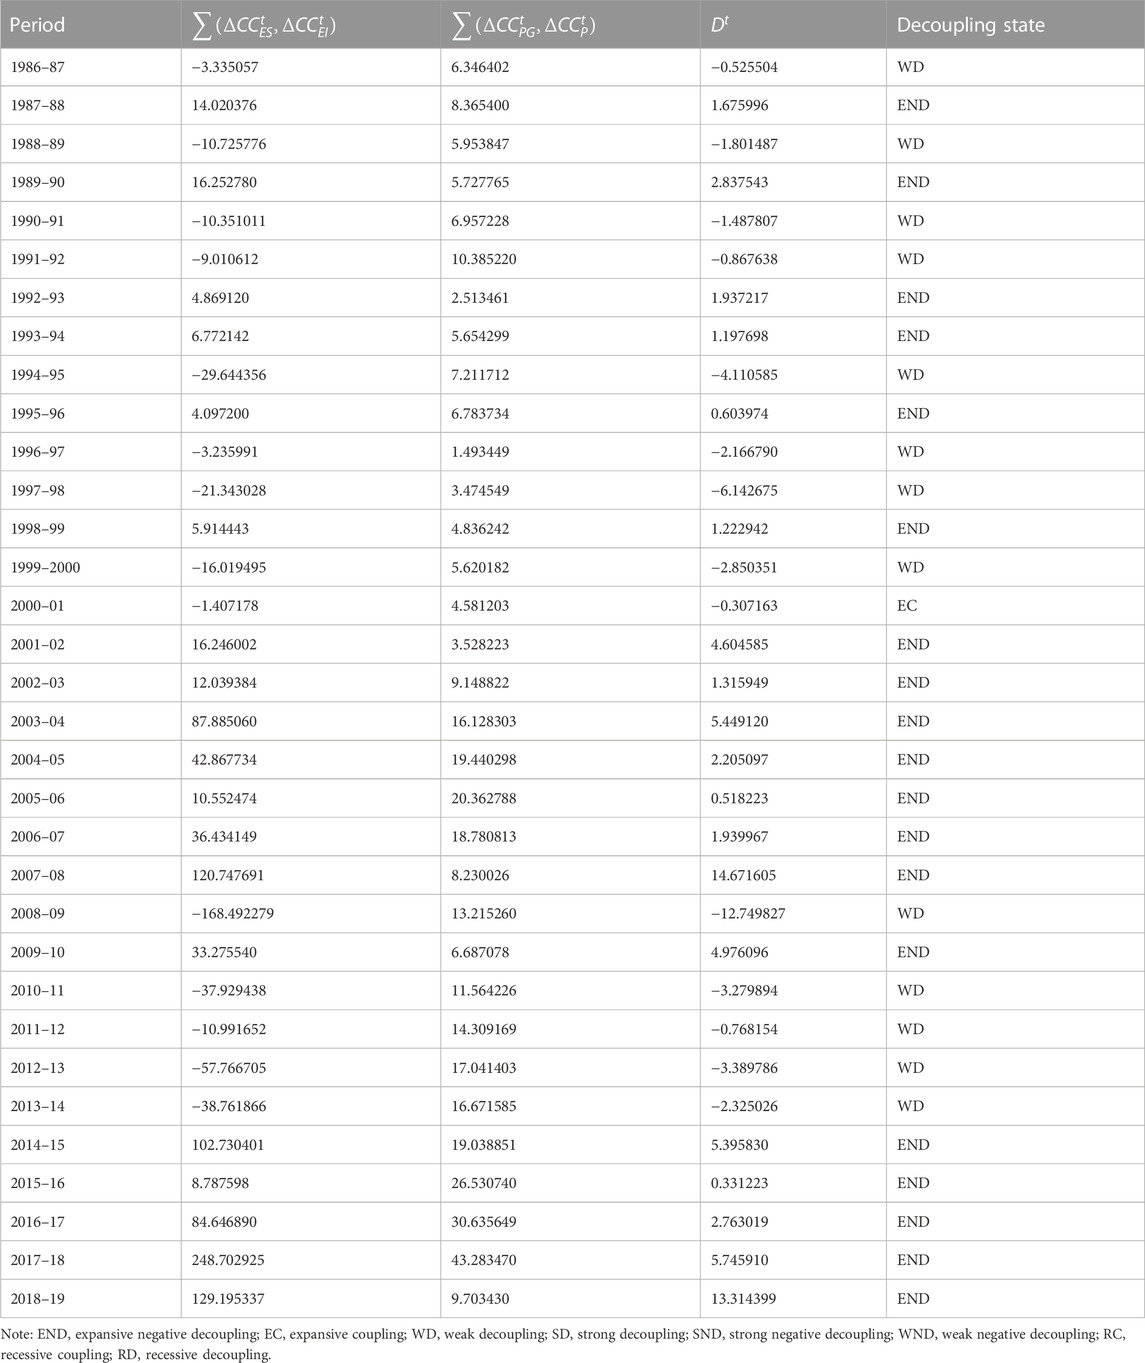
TABLE 5. Estimation of decoupling states between coal consumption and economic growth in Pakistan from 1986 to 2019.
Expansive coupling only appeared in 2001, and the decoupling indicator was −0.31. Expansive negative decoupling occurred in 19 years, 1988, 1990, 1993–94, 1996, 1999, 2002–08, 2010, and 2015–19, and the decoupling indicators were 1.67, 2.83, 1.93, 1.19, 0.60, 1.22, 4.60, 1.31, 5.44, 2.20, 0.51, 1.93, 14.67, 4.97, 5.39, 0.33, 2.76, 5.74, and 13.31, respectively. The coal utilization provided weak decoupling in 13 years, 1988, 1990, 1993–94, 1996, 1999, 2002–08, 2010, and 2015–19, and decoupling indicators were −0.52, −1.80, −1.48, −0.86, −4.11, −2.16, −6.14, −2.85, −12.74, −3.27, −0.76, −3.38, and −2.32, respectively (see Table 5). These results are consistent with the results obtained by Lin and Raza (2020b) and Wang et al. (2017).
The appearance of expansive negative decoupling in 1988, 1990, 1993–94, 1996, 1999, 2002–08, and 2010 can be discussed by the variation in the energy intensity impact and coal share impact, as shown in Table 4. As shown in Figure 3, EI slowly increased to 0.00021 Mtoe/million in 1989–1990 from 0.00020 Mtoe/million. Figure 3shows that the coal ratio also increased during 1989–1990, 1993–1994, 1996, 1999, 2002–08, and 2010 because of fluctuations in energy intensity.
The advancement in 2001 showed expansive coupling, which is also referred to as the variation in
As per Table 4,
3.4 Environmental analysis
According to Eq. 10 and outcomes shown in Table 6, coal savings are almost linear in their relationship with efficiency at both LHV and HHV coal-fired levels, including subcritical, supercritical, and ultra-supercritical. Thus, fuel conservation can be extrapolated to efficiencies outside the examined range based on a linear regression of the statistics, which is in accordance with the research by Rocha et al. (2021). Moreover, as proved, because of numerous various coal compositions, a calculation on the basis of data estimation would need curve construction and data linearity for every composition under investigation, which makes the specificity of individual coal kinds obvious. Therefore, this piece of evidence should be taken into consideration when deliberating the ecofriendly benefits of employing novel CCTs and technologies for coal production.
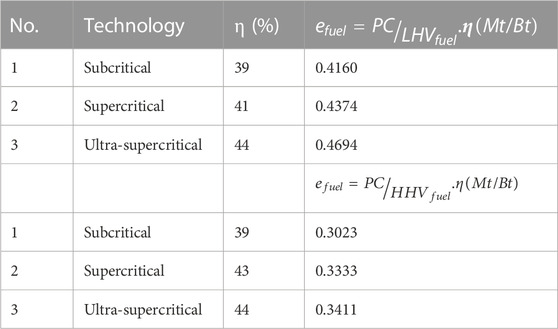
TABLE 6. Saving coal consumption based on different efficiencies and subcritical, supercritical, and ultra-supercritical technologies.
Currently, CO2 emissions signify the largest concern about coal-fired power plants because of their characteristics as gases (Yue et al., 2021). The carbon emissions rate and emission factors relating to different coal compositions (i.e., moisture, volatile matter, fixed carbon, ash, and total sulfur) in Pakistan, which are also released, have advanced technologies that are broadly employed to eliminate these contaminants from the exhaust gas with maximum productivity. However, technologies concerned with CO2 capture machinery are on the way to becoming feasible for implication on a huge scale. As Pakistan’s energy sector has already been going through a transition over the last few years, oil consumption for power production has been substituted by coal (HDIP, 2019). However, it would be wise to widely measure and recognize this evolution in Pakistan, which will influence efforts for environmental degradation, economy, and climate change burdens now and for the coming generations. The cost linked to these advanced systems shows that the way to economic viability also includes plant application and advancement, for instance, ultra-supercritical technology to lessen the condition of the system in a way that the prices linked with the carbon capture could punish economic indicators less intensely (Hammond and Spargo, 2014). Therefore, there are ways to avoid emissions, i.e., the establishment of high-efficiency plants, which are of necessary application in coal-fired plants in reducing emissions and commercial energy needs.
As per Eq. 11, carbon emissions rates based on different coal compositions are given in Table 7. Table 7 shows a significant amount of CO2 emissions for 186,007 million tons of installed coal capacity. It is likely to prove the evaded discharges from various coal compositions under particular conditions of higher efficiency. It is obvious that each composition, e.g., moisture, volatile matter, fixed carbon, ash, and total sulfur, avoids emissions by 1.82, 4.83, 5.16, 1.43, and 0.39 Mt, respectively. Odeh and Cockerill (2008) estimated emissions from coal-fired power plants in the UK using sensitivity analysis at LHV, and Rocha et al. (2021) quantified coal-fired power plant emissions for Brazil using hypothetical analysis of various plants at LHV. The previous estimations are completely different and focused on coal-fired plants, but the various economic factors, coal efficiency, coal composition, and CO2 emissions reduction for Pakistan were not considered; therefore, the wide range recognized for estimation made it conceivable to assume imperative issues. It can be noted that the emission from each composition might be evaded under the condition of 34% efficiency (HHV). Overall, the fuel efficiency and CCTs are highly expressive for embedding power production units and decision-making.
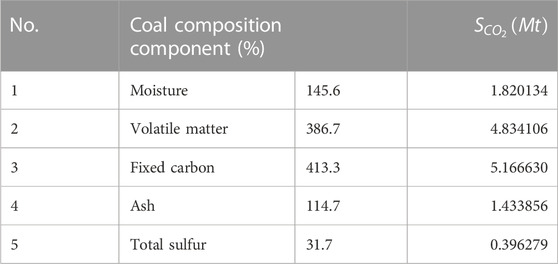
TABLE 7. Avoidance of the CO2 emission rate and the emission factors concerning various coal compositions.
4 Conclusion and policy recommendations
4.1 Conclusion
Using the yearly data from 1986 to 2019, this study syndicates the logarithmic mean Divisia index with the Tapio index model to measure coal consumption into four influencing factors: coal share, energy intensity, economic activity, and population effects. Moreover, it also assessed the decoupling index and the coal consumption in Pakistan associated with economic development. Thus, based on the aforementioned findings, the major conclusions are as follows.
First, the results exhibited a significant (1.34%) reduction in total coal consumption. However, ups and downs existed during the period, but the overall impact was negative, followed by the coal share effect. The population and economic effects slightly increased throughout the entire period, particularly in the current years. The economic share and population effects progressively increased coal consumption by 0.84% and 1.18% over the study period, respectively. Concerning economic development, minimum production adjustments naturally add to decreasing the CO2 emission level; however, the consumption of coal will contribute to enhancing economic development.
Second, expansive negative decoupling is observed in the majority of subperiods, involving 1987–88, 1989–90, 1992–94, 1995–96, 1998–99, 2001–08, 2009–10, and 2014–19. This seemed to be because economic growth rates have slowed down with increased coal consumption. Growth in energy substitution and numerous other government policies likely impacted the huge consumption rate. The expansive coupling occurred only in 2001 because of the rapid growth in coal proportion and sluggish decrease in energy intensity (1.4%), while weak decoupling showed a decoupling association between coal consumption and the economy during 1986–87, 1988–89, 1990–92, 1996–98, 1999–2000, 2008–09, and 2010–14 with a decreasing trend in coal and intensity. This presents that coal share is the only factor that played an imperative role in the weak decoupling process.
Third, the implications of supercritical and ultra-supercritical technologies would provide significant fuel savings and, subsequently, could evade huge CO2 emission releases. It was estimated that the emissions from various coal compositions (i.e., moisture, volatile matter, fixed carbon, ash, and sulfur) could be avoided by 1.82, 4.83, 5.16, 1.43, and 0.39 Mt during the current time. Thus, on the basis of our results, subsequent policy recommendations should be given greater attention.
Finally, many questions remain unanswered, for instance, we use the decomposition and decoupling approaches and compare the different efficiency technologies for saving coal consumption for the current period. The objective is to discuss the coal situation regarding economic and population growth. Thus, in our future work, our research direction is to comprise further factors for long intervals under clean coal technologies and extend the model to a case in which the market demand is impacted by a domestic price on the availability of data on the basis of sector-wise economic efficiency and pollution factors that will check energy substitution and technical change (i.e., clean coal technologies).
4.2 Policy recommendations and discussion
For Pakistan, its growing population and industrialization caused huge energy consumption. Coal is Pakistan’s third primary energy source, having the world’s seventh largest coal reserves in Thar. However, Pakistan is still in the early stages of growing energy security, economy, and urbanization, leading to more coal consumption. Currently, domestic energy resources cannot meet the increasing energy demand due to a lack of technology and infrastructure. To check the energy security and economic situation, we analyzed the association between coal consumption and EG because of an imperative issue. Under the energy-related policies for Pakistan, INDC, Vision-2025 and Pakistan 2025, 2014, Vision-2035, 2014, and coal projects linked to the China–Pakistan Economic Corridor (CPEC) are imperative from energy and economic perspectives. Pakistan, the net coal importer, has directly impacted current reserves (185.175 billion tons) and indigenous coal production (5.8 million tons) to fulfill its industrial needs (HDIP, 2019). Furthermore, the Thar Desert has one of the largest underdeveloped coal reserves in the world, with 175 billion tons. Therefore, for long-run energy security, domestic resources could be utilized. Furthermore, due to its acute energy crisis, the enormous reserves of coal could be utilized to maintain its energy security and industrial needs. Therefore, the following policies might support economic development and environmental protection in the future.
a) Based on the consumption, production, and coal import situation, Pakistan should promote scientific and technological innovation capacity. Currently, the energy crisis in Pakistan is a serious issue, which could be fulfilled by utilizing national energy resources (i.e., oil, gas, coal, and renewable resources). Moreover, Pakistan is not well-developed in modeling the mining sector, which involves designing, planning, exploration, mine growth, and technical equipment. To meet the huge energy demand, Pakistan should use its indigenous energy resources. With huge coal reserves, the coal import reached 10.32 Mtoe, which is 24% higher than its production (HDIP, 2019). The maximum import is because of the huge demand for different industries in different sectors. Therefore, Pakistan should concentrate on developing clean coal technologies and clean energy sources (i.e., solar, wind, bagasse, and biogas), which will not only enhance the efficiency of firms and energy security but also control pollution and, thus, enhance the economy.
b) Because EG leads to huge coal consumption, if the Pakistani economy keeps increasing at a maximum ratio over the future, GHG emissions will follow, and the country’s management will continue to encounter the EG–emission dilemma. As coal is the key contributor to GHG emissions, controlling the utilization of coal looks like an effective way to control GHG emissions. To evade the possible interface with EG, GHG emissions reduction might be attained by further promoting the effectual use of coal and implementing advanced carbon capture technologies. The estimations add the renewal of current machinery and foreign technologies, which drive an upsurge in the coal consumption price and, finally, a decrease in pollution. Furthermore, e.g., Pakistan’s decision to diminish its dependence on imported fuel and interchange it with lower-emitting equipment might lead to technical and energy security problems, so this decision might not be feasible in the short term. However, the slow diversification of energy resources might actually improve the energy supply in the long run. In major energy projects based on CPEC, GHG emissions could be controlled by accelerating the expansion of new energy technologies and industries. Furthermore, for energy efficiency, industrialists should be guided about energy conservation.
c) Scientifically, the ultra-supercritical technology applied by developed nations (i.e., the United Kingdom, China, and Canada) can support the reduction of CO2 emissions and other greenhouse gases (Thitakamol et al., 2007; Raza and Tang, 2022). The implications of pollution control technologies, such as pressurized fluidized bed combustion, electrostatic separators, and zero CO2 emissions technologies, should become common in the future.
Data availability statement
The original contributions presented in the study are included in the article/Supplementary Material; further inquiries can be directed to the corresponding authors.
Author contributions
MR: conceptualization, data curation, formal analysis, methodology, software, validation, writing–original draft, and writing–review and editing. BL: conceptualization, data curation, formal analysis, investigation, methodology, supervision, validation, writing–original draft, and writing–review and editing.
Funding
The author(s) declare that no financial support was received for the research, authorship, and/or publication of this article.
Conflict of interest
The authors declare that the research was conducted in the absence of any commercial or financial relationships that could be construed as a potential conflict of interest.
Publisher’s note
All claims expressed in this article are solely those of the authors and do not necessarily represent those of their affiliated organizations, or those of the publisher, the editors, and the reviewers. Any product that may be evaluated in this article, or claim that may be made by its manufacturer, is not guaranteed or endorsed by the publisher.
References
Abosedra, S., and Baghestani, H. (1989). New evidence on the causal relationship between United States energy consumption and gross national product. J. Energy Dev., 285–292.
Acaravci, A. (2010). Structural breaks, electricity consumption and economic growth: evidence from Turkey. J. Econ. Forecast. 2, 140–154.
Ang, B. W. (2004). Decomposition analysis for policymaking in energy:. Energy policy 32 (9), 1131–1139. doi:10.1016/s0301-4215(03)00076-4
Ang, B. W., and Liu, N. (2007). Handling zero values in the logarithmic mean Divisia index decomposition approach. Energy Policy 35 (1), 238–246. doi:10.1016/j.enpol.2005.11.001
Asghar, Z. (2008). Energy-GDP relationship: a causal analysis for the five countries of South Asia. Appl. Econ. Int. Dev. 8 (1), 167–180.
Bildirici, M. E., and Bakirtas, T. (2014). The relationship among oil, natural gas and coal consumption and economic growth in BRICTS (Brazil, Russian, India, China, Turkey and South Africa) countries. Energy 65, 134–144. doi:10.1016/j.energy.2013.12.006
Bloch, H., Rafiq, S., and Salim, R. (2012). Coal consumption, CO2 emission and economic growth in China: empirical evidence and policy responses. Energy Econ. 34 (2), 518–528. doi:10.1016/j.eneco.2011.07.014
Bowden, N., and Payne, J. E. (2009). The causal relationship between US energy consumption and real output: a disaggregated analysis. J. Policy Model. 31 (2), 180–188. doi:10.1016/j.jpolmod.2008.09.001
Chiou-Wei, S. Z., Chen, C. F., and Zhu, Z. (2008). Economic growth and energy consumption revisited—evidence from linear and nonlinear Granger causality. Energy Econ. 30 (6), 3063–3076. doi:10.1016/j.eneco.2008.02.002
De Freitas, L. C., and Kaneko, S. (2011). Decomposing the decoupling of CO2 emissions and economic growth in Brazil. Ecol. Econ. 70 (8), 1459–1469. doi:10.1016/j.ecolecon.2011.02.011
Diakoulaki, D., and Mandaraka, M. (2007). Decomposition analysis for assessing the progress in decoupling industrial growth from CO2 emissions in the EU manufacturing sector. Energy Econ. 29 (4), 636–664. doi:10.1016/j.eneco.2007.01.005
Fan, H., Zhang, Z., Dong, J., and Xu, W. (2018). China’s R&D of advanced ultra-supercritical coal-fired power generation for addressing climate change. Therm. Sci. Eng. Prog. 5, 364–371. doi:10.1016/j.tsep.2018.01.007
Goh, T., and Ang, B. W. (2019). Comprehensive economy-wide energy efficiency and emissions accounting systems for tracking national progress. Energy Effic. 12 (8), 1951–1971. doi:10.1007/s12053-019-09796-w
Govindaraju, V. C., and Tang, C. F. (2013). The dynamic links between CO2 emissions, economic growth and coal consumption in China and India. Appl. Energy 104, 310–318. doi:10.1016/j.apenergy.2012.10.042
Grand, M. C. (2016). Carbon emission targets and decoupling indicators. Ecol. Indic. 67, 649–656. doi:10.1016/j.ecolind.2016.03.042
Hammond, G. P., and Spargo, J. (2014). The prospects for coal-fired power plants with carbon capture and storage: a UK perspective. Energy Convers. Manag. 86, 476–489. doi:10.1016/j.enconman.2014.05.030
HDIP (2019). Hydrocarbon development institute of Pakistan. Available at: https://www.hdip.com.pk/energy-yearbook.php.
Ho, C. Y., and Siu, K. W. (2007). A dynamic equilibrium of electricity consumption and GDP in Hong Kong: an empirical investigation. Energy Policy 35 (4), 2507–2513. doi:10.1016/j.enpol.2006.09.018
Hu, J. L., and Lin, C. H. (2008). Disaggregated energy consumption and GDP in Taiwan: a threshold co-integration analysis. Energy Econ. 30 (5), 2342–2358. doi:10.1016/j.eneco.2007.11.007
IEA (2017). Available at: https://www.iea.org/.
Jinke, L., Hualing, S., and Dianming, G. (2008). Causality relationship between coal consumption and GDP: difference of major OECD and non-OECD countries. Appl. energy 85 (6), 421–429. doi:10.1016/j.apenergy.2007.10.007
Kaya, Y. (1989). Intergovernmental panel on climate change/response strategies working group. May.Impact of carbon dioxide emission control on GNP growth: interpretation of proposed scenarios Response Strategies Working Group: Paris, France.
Khan, A. N., En, X., Raza, M. Y., Khan, N. A., and Ali, A. (2020). Sectorial study of technological progress and CO2 emission: insights from a developing economy. Technol. Forecast. Soc. Change 151, 119862. doi:10.1016/j.techfore.2019.119862
Kraft, J., and Kraft, A. (1978). On the relationship between energy and GNP. J. Energy Dev., 401–403.
Lei, Y., Li, L., and Pan, D. (2014). Study on the relationships between coal consumption and economic growth of the six biggest coal consumption countries: with coal price as a third variable. Energy Procedia 61, 624–634. doi:10.1016/j.egypro.2014.11.1185
Li, R., and Leung, G. K. (2012). Coal consumption and economic growth in China. Energy Policy 40, 438–443. doi:10.1016/j.enpol.2011.10.034
Lin, B., and Raza, M. Y. (2019). Analysis of energy related CO2 emissions in Pakistan. J. Clean. Prod. 219, 981–993. doi:10.1016/j.jclepro.2019.02.112
Lin, B., and Raza, M. Y. (2020a). Analysis of energy security indicators and CO2 emissions. A case from a developing economy. Energy 200, 117575. doi:10.1016/j.energy.2020.117575
Lin, B., and Raza, M. Y. (2020b). Coal and economic development in Pakistan: a necessity of energy source. Energy 207, 118244. doi:10.1016/j.energy.2020.118244
Lin, B., and Raza, M. Y. (2021). Analysis of electricity consumption in Pakistan using index decomposition and decoupling approach. Energy 214, 118888. doi:10.1016/j.energy.2020.118888
Mishra, M. K., Khare, N., and Agrawal, A. B. (2015). Scenario analysis of the CO2 emissions reduction potential through clean coal technology in India's power sector: 2014–2050. Energy Strategy Rev. 7, 29–38. doi:10.1016/j.esr.2015.03.001
Narayan, P. K., and Smyth, R. (2005). Electricity consumption, employment and real income in Australia evidence from multivariate Granger causality tests. Energy policy 33 (9), 1109–1116. doi:10.1016/j.enpol.2003.11.010
Oboirien, B. O., North, B. C., Obayopo, S. O., Odusote, J. K., and Sadiku, E. R. (2018). Analysis of clean coal technology in Nigeria for energy generation. Energy strategy Rev. 20, 64–70. doi:10.1016/j.esr.2018.01.002
Odeh, N. A., and Cockerill, T. T. (2008). Life cycle analysis of UK coal fired power plants. Energy Convers. Manag. 49 (2), 212–220. doi:10.1016/j.enconman.2007.06.014
OECD-2010 Indicators to measure decoupling of environmental pressure from economic growth. Sustainable development. SG/SD (2002) 1/final. Organization for Economic Co-operation and Development. OECD Library. Website: http://www.olis.oecd.org/olis/2002doc.nsf/LinkTo/sg-sd(2002)1-final).
Ozcan, B., and Ari, A. (2015). Nuclear energy consumption-economic growth nexus in OECD: a bootstrap causality test. Procedia Econ. Finance 30, 586–597. doi:10.1016/s2212-5671(15)01271-x
Pakistan Bureau of Statistics (2019). Available at: https://www.pbs.gov.pk/publication/pakistan-statistical-year-book-2019.
Pakistan Economic Survey (PES) (2019-2020). Ministry of finance, government of Pakistan. Islamabad: Ministry of Finance, Government of Pakistan. Available at: http://www.finance.gov.pk/survey/Pakistan_ES_2019_20_pdf.
Pakistan energy vision (2016). Available at: https://www.sdpi.org/publications/files/Pakistan%20Energy%202035.FINAL%2020th%20October%202014.pdf.
Payne, J. E., and Taylor, J. P. (2010). Nuclear energy consumption and economic growth in the US: an empirical note. Energy Sources, Part B Econ. Plan. Policy 5 (3), 301–307. doi:10.1080/15567240802533955
Qian, Y., Cao, H., and Huang, S. (2020). Decoupling and decomposition analysis of industrial sulfur dioxide emissions from the industrial economy in 30 Chinese provinces. J. Environ. Manag. 260, 110142. doi:10.1016/j.jenvman.2020.110142
Raza, M. Y., and Dongsheng, L. I. (2023). Analysis of energy-related CO2 emissions in Pakistan: carbon source and carbon damage decomposition analysis. Environ. Sci. Pollut. Res. 30, 107598–107610. doi:10.1007/s11356-023-29824-8
Raza, M. Y., and Lin, B. (2020). Decoupling and mitigation potential analysis of CO2 emissions from Pakistan's transport sector. Sci. Total Environ. 730, 139000. doi:10.1016/j.scitotenv.2020.139000
Raza, M. Y., and Lin, B. (2023). Future outlook and influencing factors analysis of natural gas consumption in Bangladesh: an economic and policy perspectives. Energy Policy 173, 113379. doi:10.1016/j.enpol.2022.113379
Raza, M. Y., and Shah, M. T. S. (2019). Analysis of coal-related energy consumption in Pakistan: an alternative energy resource to fuel economic development. Environ. Dev. Sustain. 22, 6149–6170. doi:10.1007/s10668-019-00468-4
Raza, M. Y., and Tang, S. (2022). Inter-fuel substitution, technical change, and carbon mitigation potential in Pakistan: perspectives of environmental analysis. Energies 15 (22), 8758. doi:10.3390/en15228758
Rocha, D. H., Siqueira, D. S., and Silva, R. J. (2021). Effects of coal compositions on the environment and economic feasibility of coal generation technologies. Sustain. Energy Technol. Assessments 47, 101500. doi:10.1016/j.seta.2021.101500
Ruhul, S., Rafiq, S., and Hassan, A. K. (2008). Causality and dynamics of energy consumption and output: evidence from non-OECD Asian countries. J. Econ. Dev. 33 (2), 1–26. doi:10.35866/caujed.2008.33.2.001
Soytas, U., and Sari, R. (2003). Energy consumption and GDP: causality relationship in G-7 countries and emerging markets. Energy Econ. 25 (1), 33–37. doi:10.1016/s0140-9883(02)00009-9
Tapio, P. (2005). Towards a theory of decoupling: degrees of decoupling in the EU and the case of road traffic in Finland between 1970 and 2001. Transp. policy 12 (2), 137–151. doi:10.1016/j.tranpol.2005.01.001
Thitakamol, B., Veawab, A., and Aroonwilas, A. (2007). Environmental impacts of absorption-based CO2 capture unit for post-combustion treatment of flue gas from coal-fired power plant. Int. J. Greenh. Gas Control 1 (3), 318–342. doi:10.1016/s1750-5836(07)00042-4
Vision-2025 and Pakistan 2025 (2014). One nation-one vision. Planning commission. Ministry of planning. Islamabad: Development and Reforms. Government of Pakistan. Available at: http://fcs.seecs.edu.pk/Vision/Vision-2025/Pakistan-Vision-2025.pdf.
Vision 2035 (2014). Pakistan 2035, one nation-one vision. Planning commission. Ministry of planning. Islamabad: Development and Reforms. Government of Pakistan. Available at: https://www.sdpi.org/publications/files/Pakistan%20Energy%202035FINAL%2020th%2December%202014.pdf.
Wang, P., Wang, C., Hu, Y., and Liu, Z. (2017). Analysis of energy consumption in Hunan Province (China) using a LMDI method based LEAP model. Energy Procedia 142, 3160–3169. doi:10.1016/j.egypro.2017.12.384
WDI (2020). Available at: https://data.worldbank.org/indicator/NY.GDP.MKTP.KD (Accessed on May 5, 2021).
Wei, W., Cai, W., Guo, Y., Bai, C., and Yang, L. (2020). Decoupling relationship between energy consumption and economic growth in China's provinces from the perspective of resource security. Resour. Policy 68, 101693. doi:10.1016/j.resourpol.2020.101693
Wolde-Rufael, Y. (2010). Coal consumption and economic growth revisited. Appl. Energy 87 (1), 160–167. doi:10.1016/j.apenergy.2009.05.001
Yang, L., Li, L., Zhu, K., Xie, R., and Wang, Z. (2020). Structural path analysis of China’s coal consumption using input–output frameworks. Environ. Sci. Pollut. Res. 27 (7), 6796–6812. doi:10.1007/s11356-019-07176-6
Yin, S., and Zhao, Z. (2023). Energy development in rural China toward a clean energy system: utilization status, co-benefit mechanism, and countermeasures. Front. Energy Res. 11, 1283407. doi:10.3389/fenrg.2023.1283407
Yoo, S. H., and Ku, S. J. (2009). Causal relationship between nuclear energy consumption and economic growth: a multi-country analysis. Energy policy 37 (5), 1905–1913. doi:10.1016/j.enpol.2009.01.012
Yu, Y., and Yin, S. (2023). Incentive mechanism for the development of rural new energy industry: new energy enterprise–village collective linkages considering the quantum entanglement and benefit relationship. Int. J. Energy Res. 2023, 1–19. doi:10.1155/2023/1675858
Yuan, J., Zhao, C., Yu, S., and Hu, Z. (2007). Electricity consumption and economic growth in China: cointegration and co-feature analysis. Energy Econ. 29 (6), 1179–1191. doi:10.1016/j.eneco.2006.09.005
Yue, H., Worrell, E., and Crijns-Graus, W. (2021). Impacts of regional industrial electricity savings on the development of future coal capacity per electricity grid and related air pollution emissions–A case study for China. Appl. Energy 282, 116241. doi:10.1016/j.apenergy.2020.116241
Zhang, M., Bai, C., and Zhou, M. (2018). Decomposition analysis for assessing the progress in decoupling relationship between coal consumption and economic growth in China. Resour. Conservation Recycl. 129, 454–462. doi:10.1016/j.resconrec.2016.06.021
Zhang, M., and Guo, F. (2013). Analysis of rural residential commercial energy consumption in China. Energy 52, 222–229. doi:10.1016/j.energy.2013.01.039
Zhang, M., Liu, X., Wang, W., and Zhou, M. (2013). Decomposition analysis of CO2 emissions from electricity generation in China. Energy policy 52, 159–165. doi:10.1016/j.enpol.2012.10.013
Zhang, M., Song, Y., Su, B., and Sun, X. (2015). Decomposing the decoupling indicator between the economic growth and energy consumption in China. Energy Effic. 8 (6), 1231–1239. doi:10.1007/s12053-015-9348-0
Zhang, X. P., and Cheng, X. M. (2009). Energy consumption, carbon emissions, and economic growth in China. Ecol. Econ. 68 (10), 2706–2712. doi:10.1016/j.ecolecon.2009.05.011
Zhang, Z. (2000). Decoupling China’s carbon emissions increase from economic growth: an economic analysis and policy implications. World Dev. 28 (4), 739–752. doi:10.1016/s0305-750x(99)00154-0
Zhao, Y., Zhang, Y., Song, Y., Yin, S., and Hu, C. (2023). Enhancing building energy efficiency: formation of a cooperative digital green innovation atmosphere of photovoltaic building materials based on reciprocal incentives. AIMS Energy 11 (4), 694–722. doi:10.3934/energy.2023035
Keywords: coal consumption, LMDI, decoupling index, fuel efficiency, CO2 emission, Pakistan
Citation: Raza MY and Lin B (2023) Coal efficiency, carbon reduction, and future policy perspective in Pakistan’s economic growth: a decomposition and decoupling approach. Front. Energy Res. 11:1275221. doi: 10.3389/fenrg.2023.1275221
Received: 09 August 2023; Accepted: 15 November 2023;
Published: 30 November 2023.
Edited by:
Jun Wu, Beijing University of Chemical Technology, ChinaReviewed by:
Xiaoling Ouyang, East China Normal University, ChinaKe Li, Hunan Normal University, China
Shi Yin, Hebei Agricultural University, China
Copyright © 2023 Raza and Lin. This is an open-access article distributed under the terms of the Creative Commons Attribution License (CC BY). The use, distribution or reproduction in other forums is permitted, provided the original author(s) and the copyright owner(s) are credited and that the original publication in this journal is cited, in accordance with accepted academic practice. No use, distribution or reproduction is permitted which does not comply with these terms.
*Correspondence: Boqiang Lin, YnFsaW5AeG11LmVkdS5jbg==, YnFsaW4yMDA0QHZpcC5zaW5hLmNvbQ==