 Sławomir Wyciślak
 Pourya Pourhejazy
94% of researchers rate our articles as excellent or good
Learn more about the work of our research integrity team to safeguard the quality of each article we publish.
Find out more
ORIGINAL RESEARCH article
Front. Energy Res. , 13 October 2023
Sec. Sustainable Energy Systems
Volume 11 - 2023 | https://doi.org/10.3389/fenrg.2023.1275070
This article is part of the Research Topic Supply Chain Transformation for Pursuing Carbon-neutrality View all 10 articles
Poor coordination at distribution centers is a prime source of supply chain delays and energy waste that can be avoided through real-time planning and enhanced visibility. As a modern logistics topic with implications for supply chain transformation, Intelligent Dock Booking (IDB) coordinates the incoming and outgoing shipments at distribution centers. The research on IDB is at the early development stage. This study contributes to the Supply Chain Control Tower (SCCT) by developing a conceptual model of IDB, identifying its implementation requirements, and exploring its impacts on the supply chain performance. The causal loops and stock/flow diagrams are used to investigate how several efficiency indicators like the number of cancellations, planning time, utilization of space for loading and unloading, and the duration of processing trucks at distribution centers can be improved. Further, real-time data integration, operational preconditions, automated scheduling, dynamic responsiveness, and interdepartmental integration are identified as the key implementation requirements. The findings provide a foundation for implementing IDB systems in SCCTs.
The competition among major corporations is mostly about their supply chain capabilities. System-wide coordination is essential for companies to operate at their best capacity and stay competitive (Simchi-Levi et al., 2008). The Supply Chain Control Tower (SCCT) works as a coordination and consolidation platform to provide enhanced visibility for the efficient material flow between retailers, warehouses, factories, part manufacturers, and downstream suppliers. The control tower does not own trucks and/or physical assets and acts merely as an intermediary between customers and Transport Service Providers (TSPs). SCCT is capable of integrating technologies, processes, and human expertise that serve as supply chain orchestrators or partners; it improves the cost, quality, reliability, and responsiveness of the companies and is believed to strengthen the competitive strategy (Midkiff, 2021; Sharabati et al., 2022). The control tower has implications for Supply Chain (SC) leadership, transparency, workforce development, and collaboration (Dalporto and Venn, 2020). Such a platform is likely to facilitate the development of intermodal transport (Giusti et al., 2019), which is supported by the European Commission’s transport policy (Ramos de Oliveira et al., 2022). SCCT is also expected to improve resilience, which may be achieved directly (Syahchari et al., 2022), or indirectly through improving various supply chain competencies (Islam et al., 2023).
The literature on SCCT is at the early development stages; the existing body of knowledge is mostly about the adoption of the new technology (Smith, 2022). There is a need to analyze the already implemented SCCT systems to explore rooms for possible improvement. Besides, decision support systems that facilitate higher degrees of intelligence in SCCT are very limited (Ye et al., 2022). As a prime example, automating repetitive transport management decisions, like dock booking, should be investigated for a truly autonomous SCCT; a direction that has inspired the present study.
Industry 4.0 emphasizes higher degrees of automation in the SC to accommodate the surging global demand more efficiently. Autonomous technologies and intelligence contribute a lot to the successful development and implementation of autonomous SCs (Liotine, 2019). In this situation, human capital is expected to play a different role in the future of logistics management (Kucukaltan et al., 2022) with their involvement evolving into strategic decision-making (Hofmann and Rüsch, 2017). Repetitive decisions at the operational and tactical levels, which are often time and cost-intensive to be managed by a human, should be automated. Autonomous decision-making in the supply chain has received recent recognition (see Li et al., 2022). Automating transport management decisions in the SCCT context is very limited (Vlachos, 2021).
Dock booking is a prime example of decisions that can be automated; automating dock booking has implications for the effective implementation of SCCT, particularly to diminish human errors and reduce administrative workload by slashing the need for manual information entry (Rodrigue, 2022). Dock booking/reservation studies are limited to a handful of optimization methods. (Miao et al., 2014) developed a metaheuristic algorithm for dock assignment in a cross-dock management system. (Sharma, 2017) developed a mathematical problem for truck dock allocation. (Fallahtafti et al., 2021) proposed a mathematical model for time slot management of loading docks in warehouses. Most recently, (Song et al., 2022), proposed an integrated optimization approach for the simultaneous planning of vehicle routes for the TSP and schedules the dock time slots at the SC facility. (Falsafi et al., 2022) introduced a decision-support model based on truck-dock assignment and transport mode selection to minimize the ripple effect of possible disruptions on the production plans. We also found a case study by Marzialia et al. (2022) that developed new performance indicators for evaluating order picking and loading-dock arrival timeliness.
As we delve into a transformation to Industry 4.0 SCs, it becomes crucial to understand the nuances of adopting intelligent decision systems in SCCT by answering the following questions.
RQ1. What are the requirements for implementing the IDB system?
RQ2. How does the IDB system impact the performance of SCCT?
Leveraging a system dynamics perspective, we employed the Causal Loop Diagrams (CLDs) and Stock and Flow Diagrams (SFDs) to develop a conceptual model that answers these questions. CLDs are used to identify the variables of interest and map their interrelationships within the system. SFDs enabled us to analyze the temporal evolution of these variables, offering insights into their dynamic behavior. This framework provides a grasp of the dock booking complexities and system architecture. The conceptual model is investigated in the supply chain of a major Fast-Moving Consumer Goods (FMCG) company. The proposed criteria and alternatives emanate from comprehensive industry consultations, expert interviews, and preliminary field investigations to study the most important challenges in the adoption of IDB. The blend of academic rigor and real-world insight supported by the author’s experience of working in an SCCT environment ensures theoretical robustness and practical relevance.
The remainder of this article is organized into four sections. Section 2 establishes the necessary background. Section 3 elaborates on the transport management system in the case company. Section 4 presents the IDB model, elaborating on the underlying principles. Sections 5 and 6 analyze the potential benefits of the proposed model and highlight its implications for energy efficiency in the supply chain. Finally, Section 7 synthesizes the findings and provides insights on potential directions for future research.
Transportation information capabilities—like real-time access to reliable data on cargo status and freight data exchange—improve logistics service level (Lee and Shin, 2008), and operational efficiency, and reduce externalities (Mehmood et al., 2017). Depending on the asymmetry of costs and benefits among logistics partners (Wyciślak, 2022), real-time transport visibility was shown to reduce the average and maximum number of trucks in the distribution centers as well as site sojourn times (Dunke and Nickel, 2020).
Unstructured data sources (Wu and Yang, 2018) and online information technology solutions have been used for the real-time collection of logistics data, like truck arrivals and loading in logistics sites (Dunke and Nickel, 2020). Companies are also adopting new technologies to improve transportation information capabilities beyond the current norms (Callefi et al., 2022). The Internet of Things (IoT), which obtains data through sensors and communication devices, is a prime example of new technology with disruptive implications for transport management and decision-making. Transport visibility and real-time information sharing are some of the major drivers of IoT adoption (Farquharson et al., 2021). IoT-enabled transport systems are being employed to improve last-mile transport of time-sensitive and perishable goods (Wanganoo et al., 2021). Intelligent transport systems are recently equipped with cloud computing performing data analytics for decision support (Tyagi and Sreenath, 2023). For instance, travel time predictions are improved with machine learning applications based on big traffic data (Chen et al., 2023). For a comprehensive review of IoT applications in Supply Chain Management (SCM), we refer interested readers to (Ben-Daya et al., 2019).
SCCT consists of the technology that enables a centralized planning and control platform and integrates data from various sources to manage the flow of information, like orders, shipments, and inventory levels. The control tower links man, machines, and methods through IoT, and uses Artificial Intelligence and cloud platforms for decision aid and/or automated decision-making. End-to-end visibility, decision analytics, and process execution are some of the capabilities of SCCTs1.
From the transport management system perspective, an SCCT supports the control, planning, execution, and billing of transport activities (Rölli, 2021). This includes monitoring and managing 1) Transport operations; 2) Transport finances including invoice verification and transport budget controlling; 3) Logistics systems development including support, maintenance, and development of transport management system; 4) Logistics scale-up (i.e., implementation of new transport volumes, logistics efficiency projects), and 5) Logistics procurement including tendering, contract administration, market intelligence services, and pallet supply management.
Urban distribution centers and consolidation strategies have been investigated to examine their implications for improving supply chain efficiency (Morganti and Gonzalez-Feliu, 2015). SCCT as a consolidation service requires further investigation. The present study focuses on the logistics network orchestrated by SCCT.
The FMCG industry is characterized by high demand for service quality (Mbhele, 2016), a wide variety of products and large assortment size (Joseph et al., 2010), frequent deliveries of product batches (Colicchia et al., 2017), and product with a short life (Pan and Choi, 2016). These characteristics together with the low profit margins in FMCG (Birhanu et al., 2017) make logistics efficiency more imperative than in other sectors. In this situation, the products’ long average time in the supply chain is not desired, making this an important factor in different managerial decision-making in FMCG (Pourhejazy et al., 2019).
Taking fresh meat, fruit, and vegetables as an example, the quality of products decreases rapidly and continues to decay until purchased and used by the end consumers. Considering the time-sensitive nature of products with deterioration of quality (Aljohani and Thompson, 2018), the revenue of the entire supply chain depends on the timeliness of logistics operations. In this situation, speed is a key performance indicator in FMCG supply chains (Dewa et al., 2017).
Transport visibility and timeliness are arguably the most important capabilities in the supply chain of FMCG companies. This has made FMCG an industry with the largest demand for third-party logistics (Dev et al., 2016). The intense competition results in low brand loyalty in FMCG (Wu et al., 2019); companies are constantly searching for improvement opportunities to stay competitive. Considering FMCG characteristics, and the implications of supply chain control towers for transport visibility and timeliness, a case from FMCG is presented in the next section to explore the nuances of SCCTs.
The studied FMCG company has recently established an SCCT unit to handle orders from SC partners (factories, marketing and sales groups, and multi-country organizations) and other business partners (distribution centers and part manufacturers). Managing the transport operations in the European cluster and the Ocean and Air transport are among the major responsibilities of the SCCT unit; this includes the end-to-end transport operations and logistics between suppliers and factories (raw and pack transport), factories and primary warehouses (primary transport), and secondary warehouses (secondary transport). While the primary transports using the company fleet achieved the economy of scale by bundling shipments on international routes, shorter routes in the secondary transport are outsourced to third-party logistics (3PL) providers.
The operations in the SCCT unit are divided into three main product categories: Foods, Refreshments, and Home and Personal Care. The material and product characteristics, like the short shelf life of food products, the temperature-sensitive nature of refreshments, and chemical substances in home and personal care, differentiate these categories. These characteristics enforce certain transportation constraints; for example, home and personal care products cannot be transported with products from other categories due to the contamination risk. Factories, distribution centers, and part manufacturers accommodating the products are assigned to one of the three product categories considering their annual portfolio, transport requests, and key contacts. This approach enables transport planners to combine orders of less-than-full-truck loads from one category to maximize capacity utilization while considering the risk of tainted materials and products.
The SCCT unit is managed by the logistics director. As shown in Figure 1, logistics operation managers are responsible for different product categories. Supervisors manage sub-categories and a separate managerial role is defined for ocean operations. Customer management specialists (CMS), and regional project and process specialists (RPPS) support logistics operation managers and supervisors. Finally, transport planners handle the orders from one of three main product categories; the transport planners are allocated to specific geographical regions to support the combination of orders through maximizing full-truck-load shipments.
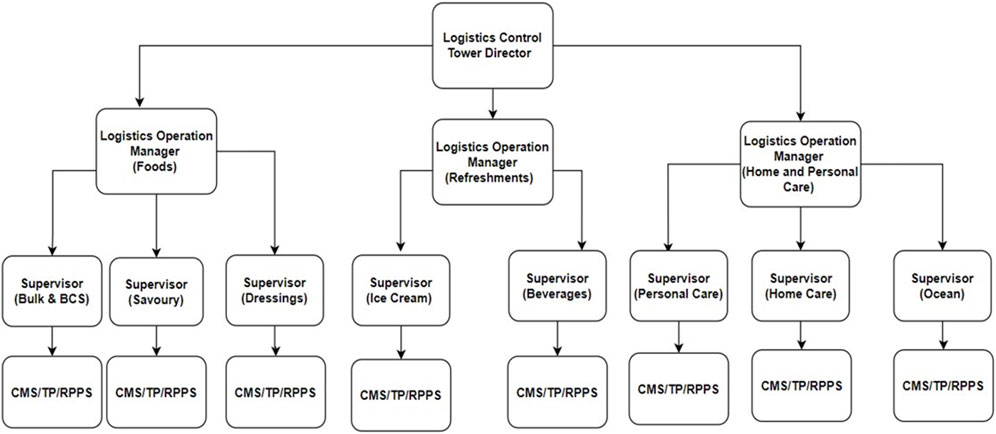
FIGURE 1. The hierarchies in the control tower of the case company.
The planning department divides the assignments into (a) Raw and packed goods, and (b) Finished goods. The former responsibility consists of (I) ensuring that raw material is available for production and that packed products are available for delivery to customers (II) maintaining the lowest possible material and product levels in factories and distribution centers; (III) purchasing the required material and products. As the second responsibility, finished goods planning must ensure that products are available for delivery to customers, and plan the manufacturing and purchasing activities as well as delivery schedules. The logistics procurement team is responsible for tendering services and contract management, pallet management, pallet supply management, and SCCT market intelligence. In cooperation with the procurement team, the quality department is in charge of investigating claims and reviewing/reporting quality-related performance indicators regularly.
Once a shipment request is initiated, the transport planner should arrange the associated pick-up and delivery. Every factory is handled by one transport planner so that the customer will have only one contact point at the company’s end. The customer management specialists get involved only in special circumstances and for driving performance improvements. The transport planner considers shipment priorities (i.e., normal and urgent) as well as resource management factors, like dock ownership, the number of available docks, and the working hours to plan the order fulfillment operations. The transport process is visualized in Figure 2 followed by a detailed description of the major operations.
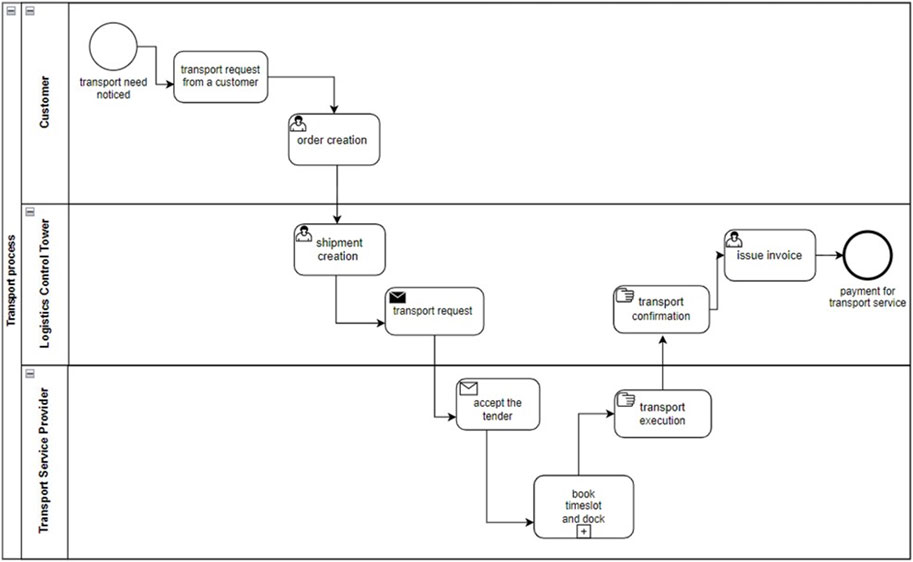
FIGURE 2. Interactions within the transport process.
The order fulfillment process begins when the SCCT unit receives a transport request; the order can be in the form of manual, interfaced, Electronic Data Interchange (EDI), or Flatto. The main difference between these order types is their integration with the Transport Management System and the amendment option after integration. A registered order includes the following information: loading and unloading locations and times, number of pallets, gross weight, transport condition, Incoterms, and special requirements, like dangerous goods, and express delivery. Given this information, the SCCT unit assigns immediate requests to the categories and the rest to the bulk/ocean transport. Within the selected category, the orders will be forwarded to specific transport planners considering their geographical responsibility. The transport planner combines orders based on the vendor codes within his/her category. The transport planner should also handle the capacity- and time-management decisions to select the best shipping alternative considering costs, carbon emissions, and customer service time when there is intermodal transportation.
New orders are added to the Transport Management System (TMS) as soon as all required information is entered. The SCCT then takes over the planning of the shipment, aiming to maximize the number of Full Truck Loads. If the transport service is outsourced, the SCCT forwards the request to a contracted TSP. In cases of having no suitable TSP or route available, or if the TSP rejects the load, the SCCT offers the load in the spot market.
After a TSP confirms they can handle the load, a dock must be reserved for the carrier. This process, which is known as “dock booking”, involves selecting an available dock and scheduling a specific time for pickup or delivery at the factories or distribution centers. The term “load execution” refers to the actual process of transporting the goods, which spans from on-time collection to on-time delivery. Throughout this phase, real-time updates on shipment status are shared among all parties involved.
After fulfilling a transport demand, the financial department completes the transport process. For this purpose, SCCT executes a monthly invoicing process for the TSP. SCCT should work with partners from planning, IT, logistics procurement, quality, finance, and development units to complete these processes. The performance of SCCT, therefore, depends on the quality of the master data provided by the European center.
This section uses CLDs to identify and map the interactions between various variables pertinent to dock booking (e.g., working hours, dock availability, shipment priorities). In the CLD diagrams, variables are connected by arrows to specify the direction of their interactions, with positive (+) or negative (−) signs indicating the nature of the relationships. SFDs are used to represent the dynamic behavior of the system over time to understand how changes in one part of the system (e.g., changes in shipment priorities or dock availability) impact the overall situation. In the SFD diagrams, a “stock” represents a quantity that accumulates over time, while a “flow” represents the rate at which the stock changes.
Once a transport task is confirmed, the TSP must book a dock and time slot at the pickup and delivery sites using the transport management system of the focal company. Frequently executed shipments on short routes between factories and warehouses (known as shuttles) are exempted from dock booking. Besides, factories that work in close-to just-in-time situations do not require a booking.
In the case company, dock booking compliance at distribution centers is about 65 percent, whereas it amounts to 19 percent at the factories. In addition to the pickup arrangement, the planned arrival time also requires a booking while the dispatcher at the site is responsible for informing the driver about the dock number. This process is inefficient considering that the possible shipment delays and simultaneous arrivals may create truck queues and increase the drivers waiting times. Besides, 3PL often uses different platforms for communication; the focal company has to use fragmented solutions to manage dock bookings, which may result in conflicting schedules. This is particularly challenging, considering that the subcontracted shipments account for more than 60% of shipments.
From an operational perspective, the factories frequently change the production schedule because of amendments to customer orders; this drives changes in the planned pick-up and delivery times and amendments to dock bookings and timeslots. The data from the transport management system of the company suggests that 5 percent of requests are rescheduled or canceled while the actual scale of rescheduled appointments is around 45 percent. This is because most of the amendments are not updated on the central transport management system. Such modifications to booked docks and timeslots result in longer waiting times at sites and more communications between the SCCT unit, the TSP, and the site. The causal loop in Figure 3 shows the time accumulation during the communication process where two reinforcing loops accumulate time and one balancing loop compensates for it.
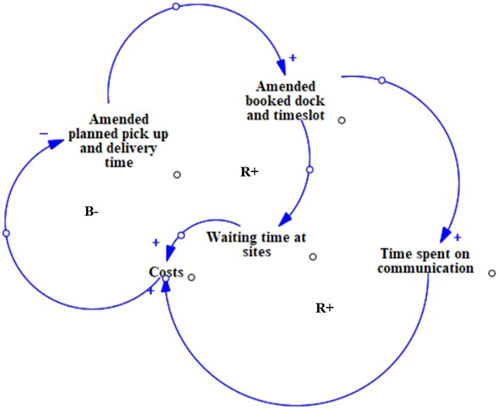
FIGURE 3. Interactions within the transport process.
In addition to the time deficiencies, the dock booking process in the transport management system of the SCCT unit does not offer sufficient user experience. The users need approximately 25 clicks to complete a dock booking, which amounts to 200 s for highly experienced users and up to 10 min for moderately experienced users. The surveys conducted by the company revealed that 60 percent of TSPs wanted to reduce the hassle of completing the dock booking process shown in Figure 4.
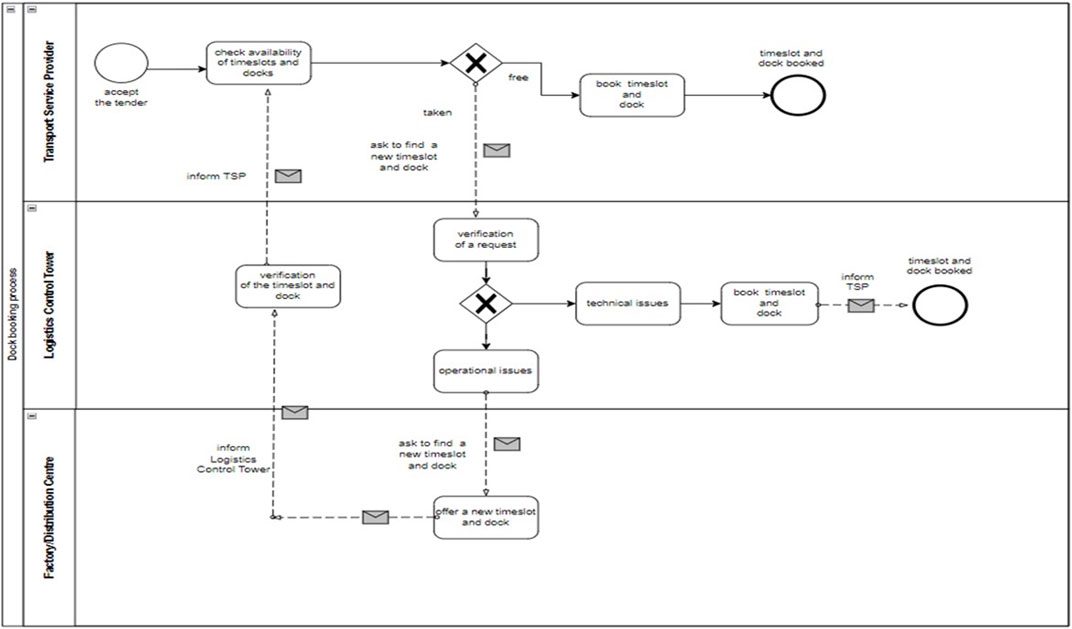
FIGURE 4. The as-is dock booking process.
In the current system, the dock booking process begins with checking the availability of time slots and docks. If there are no availabilities, the TSP contacts a customer management specialist or transport planner from the SCCT unit. The outcome should be then communicated with a dispatcher on the site (i.e., factory and distribution center) to check for the new timeslot and dock, and inform the TSP about the possible openings. That is, the customer management specialist (or transport planner) has to communicate with the driver, subcontractor, TSP, and the site. The partners exchange information within this communication loop to update the timeslots and docks. In this situation, communications consume the prevailing part, approximately 73% of planners’ time; implementing a central system addresses this issue.
A new scheme suitable for the implementation of the IDB system is investigated. For the sake of simplicity, the operational scope is narrowed to the lanes connecting the factories and distribution centers, the loading of finished goods at the factories, and the unloading of finished goods at distribution centers. The proposed model consists of a procedure for autonomous dock booking based on real-time data on the working hours of the SC facilities, dock availabilities, and shipment priorities (i.e., regular or urgent) to complete the inquiry; the process should fulfill the following assumptions.
Condition 1. If automatically calculated timeslots are within the working hours of the SC facility (e.g., distribution centers and factories), then:
1.1. When there are free timeslots and docks, they must be booked on the same day;
1.2. When there are no free timeslots and docks on the same day, the agent must book the earliest timeslot the next work day.
Condition 2. If automatically calculated timeslots are outside the working hours of the SC facility, then:
2.1. A new time slot at the earliest possible on the same day must be booked;
2.2. When there are no free time slots earlier on the same day, the agent must seek a time slot at the earliest possible on the following working day.
Condition 3. Distribution centers should be given the alternative to accept or decline a new time slot; this is because the new Expected Time of Arrival (ETA) may deviate from the planned arrival time and conflict with other schedules considering that the distribution center is often used by different users (the case company’s SCCT unit is not the only customer) and there are no explicitly dedicated docks for certain companies. Besides, it should be possible for the prioritized shipments to replace a normal shipment that is booked already, if necessary.
An exemplary dock booking process considering these conditions is shown in Figure 5. In this process, the site manager can select the time intervals wherein he/she wants to receive a notification on the ETA; the latest update of the ETA triggers amendments to the booked timeslots and docks.
The inquiry for autonomous dock booking begins when the TSP accepts the tender. Once the truck is loaded at the factory, the employee enters the transport status (good issue) into the system. Considering the distance, the agent adds the transit time into the loading time in the ERP platform and checks for the dock availability in the distribution center at the ETA; if available, the agent checks whether the shipment is prioritized or normal and informs the TSP.
The agent checks ETA in several rounds to complete the booking process. If the ETA is not outside the business hours of the site, the earliest free timeslot available on the same day should be booked in the range of
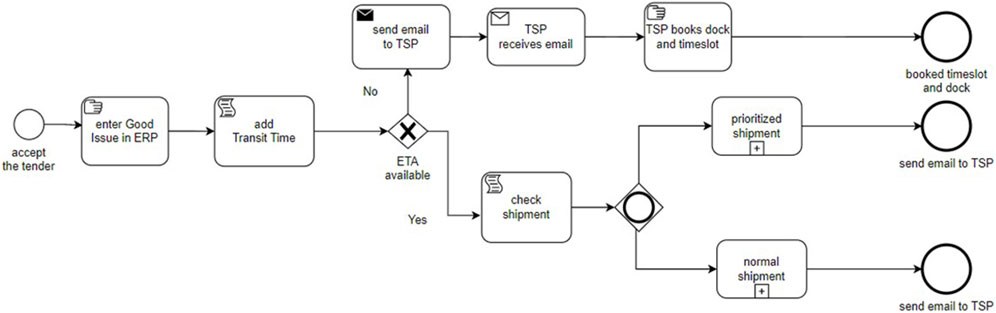
FIGURE 5. The exemplary process of dock booking under the stated conditions.
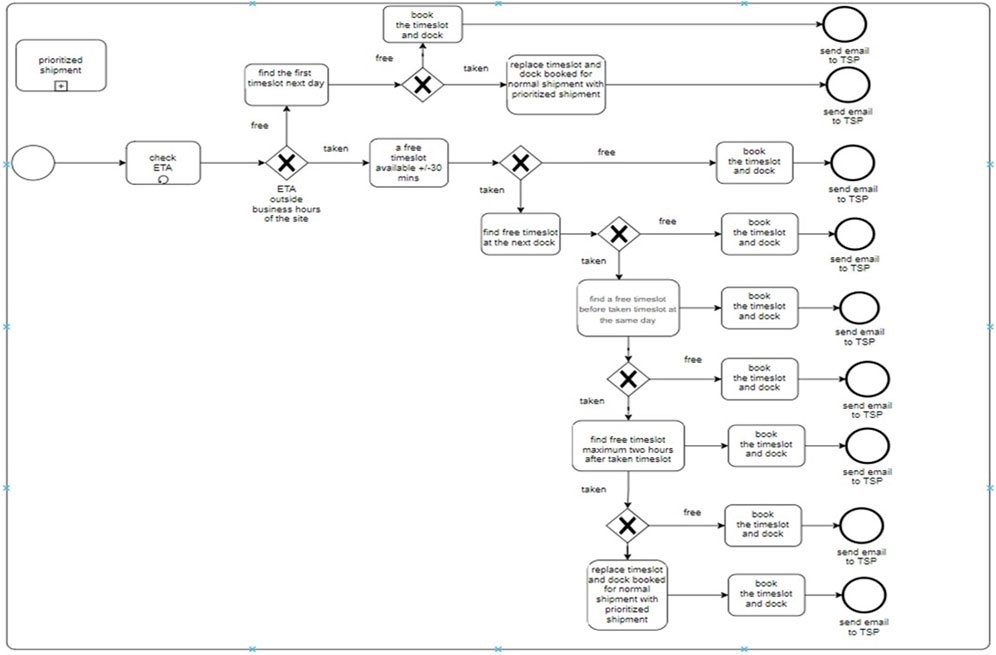
FIGURE 6. The proposed dock booking process.
The case company has yet to fully benefit from adopting the SCCT platform; the process improvement opportunities are stalled due to manual decision-making and the lack of a central dock booking system. Cost savings and customer service improvements are the most anticipated benefits of implementing a centralized system for real-time data ETA information and IDB. Figure 7 shows the cost-benefit cycle perceived for analyzing the performance of the proposed conceptual model followed by performance analysis of the IDB system in Figure 8 and investigating the operational benefits.
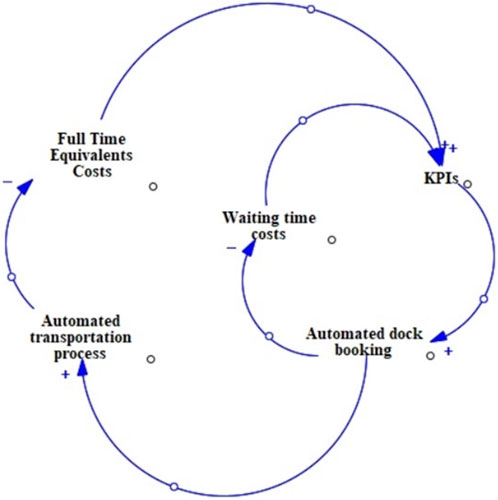
FIGURE 7. The cost-benefit cycles for implementation of the dock booking system.
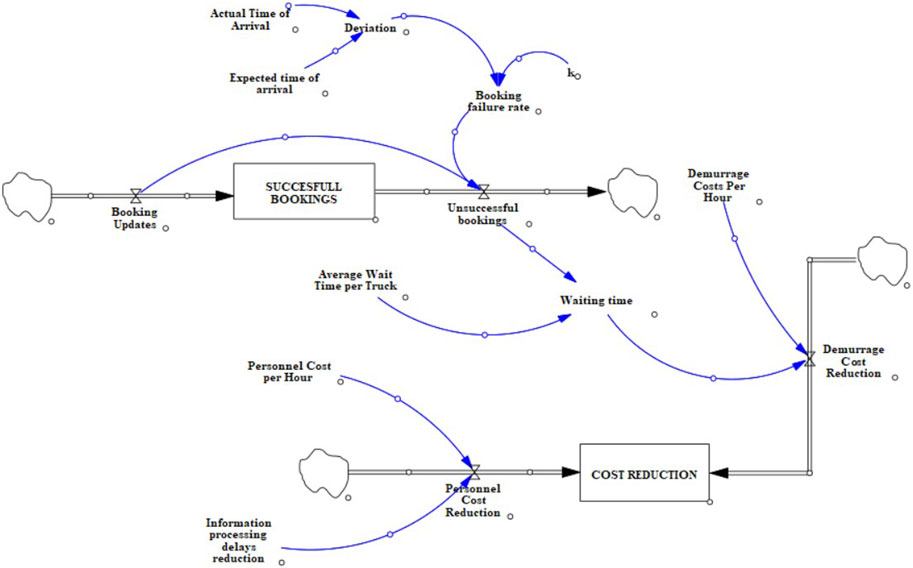
FIGURE 8. Performance model of the dock booking system.
In this model, stocks are defined as successful bookings and cost reduction. The former refers to the accumulated number of successful bookings over time. The latter represents the accumulated savings in costs over time. Flows include the following.
• Booking updates represent the rate at which new bookings are added (Unit of measure: number of bookings per unit of time).
• Unsuccessful bookings refer to the rate at which bookings are unsuccessful (Unit of measure: number of bookings per unit of time).
• Demurrage cost reduction is the savings in demurrage costs (Unit of measure: monetary value per unit of time).
• Personnel cost reduction represents the savings in personnel costs (Unit of measure: monetary value per unit of time).
The model’s variables are listed below.
• Booking failure rate represents the percentage of failed bookings.
• Deviation between the actual time of arrival and ETA.
• Information processing delays are the time it takes to process information.
• Personnel per hour costs.
Average waiting time per truck. On this basis, the following equations represent the state dynamics in the system.
Equation 7 shows that a larger deviation from ETA increases the booking failure rate. The exponential term in the equation represents an increasing rate of change and the 1/(1 + exp(-k * (Deviation between Actual Time of Arrival(t) and Expected Time of Arrival(t)))) term ensures that the booking failure rate is bounded between 0 and 1.
From a practical perspective, improvement in information flow is the first tangible outcome of implementing the IDB system in the SCCT unit of the company. This results in both immediate and sequential performance improvements. First, the real-time updates of ETA remove the information processing time on updating the delays, cancellations, and aligning timeslots. The process skips unnecessary communications between the transport planners and the factory/distribution center, resulting in approximately
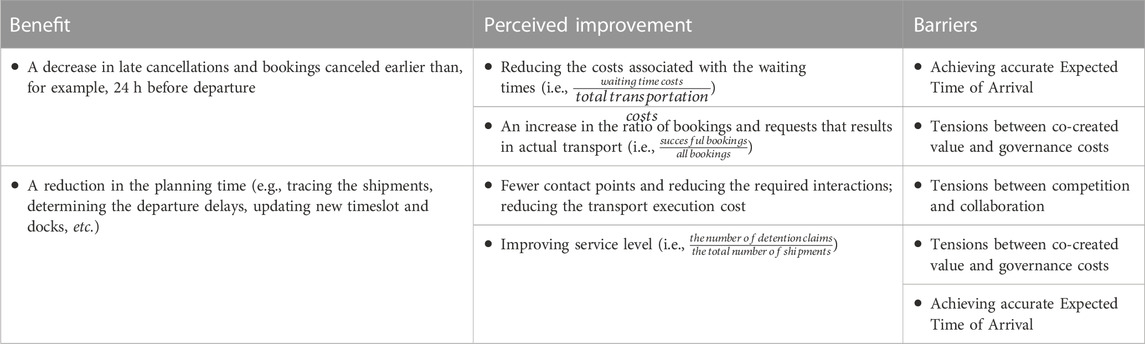
TABLE 1. Information flow improvement after deploying the intelligent dock booking system.
The conceptual model in Figure 9 shows the impact of information processing delays on the communication loop between the providers (e.g., subcontractors, freight forwarders, drivers), the SCCT unit, and the SC facility (e.g., factory, distribution center). Increasing the ratio of successful bookings over the resulting delay time (i.e.,
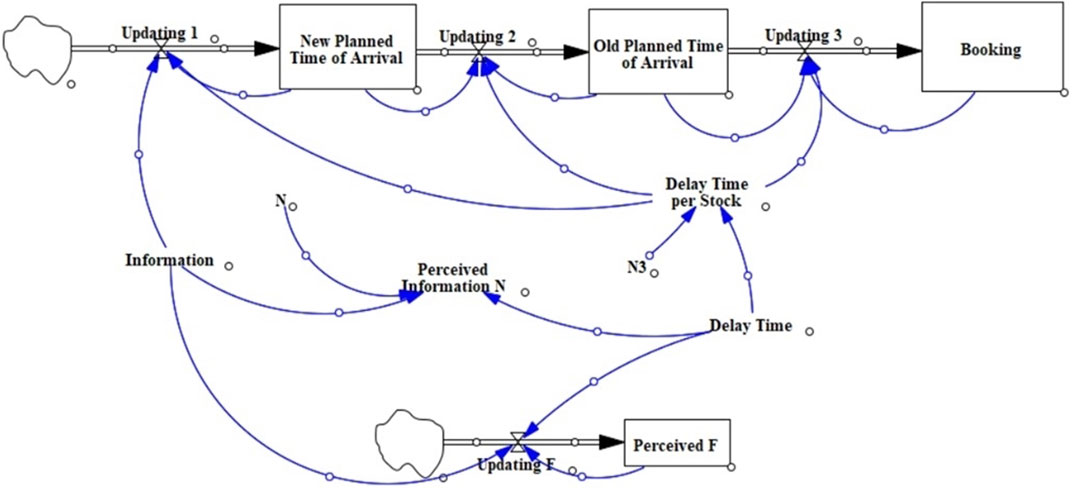
FIGURE 9. Impact analysis of delays.
Delay in informing the involved parties (i.e., driver, subcontractor, freight forwarder, and the SCCT unit) about the booking changes has a negative impact on the perceived information. Considering that most of the booking updates take place around average delay time, the third-order delay seems more appropriate than a first-order delay. This is because information on ETA can greatly deviate from the actual arrival time in the case of the first order delay.
Improvement in SC’s physical flow is the next tangible outcome of implementing the IDB system. In particular, well-informed dock booking is expected to reduce the time trucks spend in an SC facility waiting in loading and unloading queues. This, in turn, results in shorter product time in the SC and reduces operational costs.
To estimate the perceived improvement, the detention claim by the TSPs is compared with the truck check-in/check-out timestamps. IDB reduces the number of trucks in transit considering the difference between trucks’ incoming and outcoming rates. This is because the trucks’ incoming rate, delay time, and the number of trucks in transit impact the trucks’ outcoming rate. Comparing the waiting time with the time between check-in and check-out timestamps, the company confirmed that a 20 percent cost reduction associated with waiting time could be expected. Cost savings can also be achieved with better utilization of dock spaces. From the operations management perspective, more efficient transportation reduces the space needed for material/goods storage in the SC. Table 2 lists the major physical flow improvements.
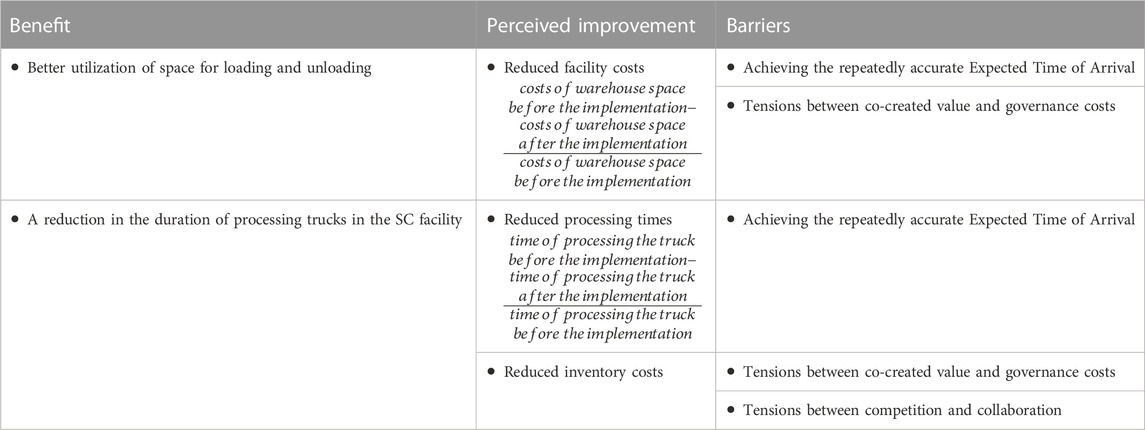
TABLE 2. Physical flow improvement after deploying the intelligent dock booking system.
Overall, the most immediate effects are reduced waiting time at sites (SC time) and decreased demurrage (SC cost). The sequential (delayed) effects consist of the ability to integrate shipment planning, TSP allocations, and internal logistics of factory and distribution centers with the IDB system, which improves SC flexibility. Besides, this integration has implications for SC’s quality of fast-moving products.
Asymmetry of benefits may cause tensions between the involved parties; what is considered a value for one party may be perceived as a cost for the others. This causes practical limitations to the implementation of the IDB system. Compliance is a prime example, which impacts the percentage of tracked shipments. From the shipments that could not be tracked, the accuracy of ETA is the major barrier with 40 percent within the range of
Discussions confirmed the transformative nature of IDB in improving efficiency. The shift towards automation, real-time updates, and centralized data management fosters energy efficiency in the following ways.
• Decreased Truck Waiting Times. Energy is wasted when trucks are idle, waiting for their turn to load or unload. The IDB system reduces waiting times, thereby avoiding unnecessary fuel consumption. Besides, improved ETA accuracy improves traffic flow within the facility, resulting in reduced congestion and, consequently, less idling, and fuel wastage.
• Optimal Dock Usage. With a real-time booking system, docks can be used at their maximum capacity, ensuring that resources like electricity and manpower are used efficiently. This is in contrast to scenarios where docks remain empty due to manual scheduling errors or no-shows.
• Optimized Storage. Efficient transportation reduces the need for prolonged material/goods storage, saving energy in facilities that need to maintain specific product conditions, like refrigeration and air conditioning.
• Integration Capabilities. The IDB system allows for cohesive integration across supply chain processes. This results in more predictable and streamlined operations, making it easier to shift some of the activities to the off-peak periods to reduce the load on the electrical grids.
• Reduced Information Processing. The timely and accurate exchange of information enables efficient decision-making, leading to reduced energy consumption in the planning process.
Furthermore, reducing demurrage and personnel costs implies more efficient operations, which typically correlates with higher energy efficiency. Future research may quantify, monitor, and optimize the energy performance improvement by the IDB system in terms of the following performance indicators.
• Idle Time Energy Wastage (kWh or Liters/Gallons): the energy wastage during truck idle times;
• Cooling/Heating Efficiency (kWh per m³): energy consumed to uphold specific storage conditions;
• Peak Load Energy Consumption (kWh): energy usage during peak hours;
• Carbon Footprint (Metric Tons CO2 Equivalent): the greenhouse gases emitted due to energy consumption;
• Energy Cost Saving (Monetary Value, e.g., $): financial savings through energy efficiency.
This article investigated an IDB system with a focus on a supply chain network that is orchestrated by the control tower. A new operational scheme was put forward to analyze and improve the performance of the control tower recently established in a well-known international FMCG company. The desired upgrades in the system were conceptually analyzed where both physical and information flow-related performance indicators are expected to improve and bring about energy efficiency. Besides, reducing unnecessary truck movements, waiting times, and the need for storage can contribute greatly to decreasing energy consumption and help in the company’s net-zero goals. The major findings are summarized below.
RQ1. The successful implementation of the IDB system requires a blend of real-time data availability, operational clarity, system autonomy, agility, and a high level of integration. The requirements for implementing the IDB system are:
1. Real-time Data: The IDB system thrives on real-time data availability. SCCT must be able to obtain data and disseminate real-time insights with a focus on operational hours, dock statuses, and shipment priorities.
2. Standard Frameworks: A well-defined operational framework, especially those tied to working hours and distribution center discretion, should be established for decision-making.
3. Automated Scheduling: The IDB system should be able to autonomously map out dock schedules based on real-time data sources.
4. Dynamic Responsiveness: The system must be agile, especially when system variables, such as ETAs are highly unstable. Adjusting dock and timeslot allocations in response to these dynamics is essential.
5. Inter-departmental Collaboration: Smooth and timely interactions between departments, like IT, finance, and quality assurance are essential to ensure the seamless flow of real-time data.
RQ2. A reduction in demurrage costs, space requirements, energy costs, and inventory costs, as well as improved customer service, are the tangible outcomes of automating the dock booking process; the improved aspects of SCCT’s performance are:
1. Communication Efficiency: The IDB system reduces communication overhead, allowing key personnel like planners and logisticians to prioritize critical activities.
2. Supply Chain Efficiency: The IDB system decreases truck waiting times, which facilitates a smoother material flow. This results in a potential cost saving of up to 20%.
3. Space Efficiency: Intelligent planning maximizes dock space usage which, in turn, diminishes the demand for additional storage areas; this translates to tangible cost reductions.
4. Operational Efficiency: The agility provided by the IDB system reduces common operational bugs, like scheduling failures, which are the root cause of various wastes/delays.
5. Energy Efficiency: Streamlined operations, diminished superfluous storage, and curbed idle times facilitate a more energy-aware system, reducing energy costs.
This case study acts as a stepping stone for future developments in automating logistics decision-making and administrative operations that can be integrated into an SCCT. There are challenges to implementing the IDB system, such as the need for integrating it with other systems and departments, and the need to train employees on how to use the system. Future studies may address such operational and tactical issues, investigating it from an optimization perspective. To be more specific, system dynamics can be used for strategy development and decision analysis in the dock booking system. Revenue management models can be useful to maximize profitability by regulating acceptance/rejection decisions in a network with both formal and informal truckers and the TSP. Game theory models are needed to help analyze the tensions between different SC partners considering the co-created value and governance costs. Finally, the scope of SCCT can be extended inspired by well-established transportation concepts, like train formation planning (Li et al., 2023) and shunting.
The original contributions presented in the study are included in the article/Supplementary Material, further inquiries can be directed to the corresponding author.
SW: Conceptualization, Data curation, Formal Analysis, Methodology, Writing–review and editing. PP: Investigation, Project administration, Software, Writing–original draft, Writing–review and editing.
The author(s) declare that no financial support was received for the research, authorship, and/or publication of this article.
The authors declare that the research was conducted in the absence of any commercial or financial relationships that could be construed as a potential conflict of interest.
The author(s) declared that they were an editorial board member of Frontiers, at the time of submission. This had no impact on the peer review process and the final decision.
All claims expressed in this article are solely those of the authors and do not necessarily represent those of their affiliated organizations, or those of the publisher, the editors and the reviewers. Any product that may be evaluated in this article, or claim that may be made by its manufacturer, is not guaranteed or endorsed by the publisher.
1https://itsupplychain.com/self-reliant-supply-chains-in-the-business-4-0-environment-an-intelligent-control-tower/
Aljohani, K., and Thompson, R. G. (2018). The impacts of relocating a logistics facility on last food miles – the case of Melbourne’s fruit & vegetable wholesale market. Case Stud. Transp. Policy 6, 279–288. doi:10.1016/J.CSTP.2018.03.007
Ben-Daya, M., Hassini, E., and Bahroun, Z. (2019). Internet of things and supply chain management: a literature review. Int. J. Prod. Res. 57, 4719–4742. doi:10.1080/00207543.2017.1402140
Birhanu, D., Krishnanand, L., and Rao, A. N. (2017). Comparison of select financial parameters of Ethiopian consumer goods supply chains. Benchmarking Int. J. 24, 102–117. doi:10.1108/BIJ-04-2015-0032
Callefi, M. H. B. M., Ganga, G. M. D., Godinho Filho, M., Queiroz, M. M., Reis, V., and dos Reis, J. G. M. (2022). Technology-enabled capabilities in road freight transportation systems: a multi-method study. Expert Syst. Appl. 203, 117497. doi:10.1016/J.ESWA.2022.117497
Chen, C. Y. T., Sun, E. W., Chang, M.-F., and Lin, Y.-B. (2023). Enhancing travel time prediction with deep learning on chronological and retrospective time order information of big traffic data. Ann. Oper. Res., 1–34. doi:10.1007/s10479-023-05223-7
Colicchia, C., Creazza, A., and Dallari, F. (2017). Lean and green supply chain management through intermodal transport: insights from the fast moving consumer goods industry. Prod. Plan. Control 28, 321–334. doi:10.1080/09537287.2017.1282642
Dalporto, A., and Venn, R. (2020). Supply chain leadership, transparency, workforce development and collaboration through control tower implementation. J. Supply Chain Manag. Logist. Procure. 3, 66–76.
Dev, N. K., Shankar, R., Gunasekaran, A., and Thakur, L. S. (2016). A hybrid adaptive decision system for supply chain reconfiguration. Int. J. Prod. Res. 54, 7100–7114. doi:10.1080/00207543.2015.1134842
Dewa, P. K., Pujawan, I. N., and Vanany, I. (2017). Human errors in warehouse operations: an improvement model. Int. J. Logist. Syst. Manag. 27, 298. doi:10.1504/IJLSM.2017.084468
Dunke, F., and Nickel, S. (2020). Improving company-wide logistics through collaborative track and trace IT services. Int. J. Logist. Syst. Manag. 35, 329. doi:10.1504/IJLSM.2020.105916
Fallahtafti, A., Karimi, H., Ardjmand, E., and Ghalehkhondabi, I. (2021). Time slot management in selective pickup and delivery problem with mixed time windows. Comput. Ind. Eng. 159, 107512. doi:10.1016/j.cie.2021.107512
Falsafi, M., Masera, D., Mascolo, J., and Fornasiero, R. (2022). A decision-support model for dock and transport management after inbound logistics disruptions in the automotive sector. Eur. J. Industrial Eng. 16, 268. doi:10.1504/EJIE.2022.121895
Farquharson, N., Mageto, J., and Makan, H. (2021). Effect of internet of things on road freight industry. J. Transp. Supply Chain Manag. 15. doi:10.4102/jtscm.v15i0.581
Giusti, R., Manerba, D., Bruno, G., and Tadei, R. (2019). Synchromodal logistics: an overview of critical success factors, enabling technologies, and open research issues. Transp. Res. E Logist. Transp. Rev. 129, 92–110. doi:10.1016/J.TRE.2019.07.009
Hofmann, E., and Rüsch, M. (2017). Industry 4.0 and the current status as well as future prospects on logistics. Comput. Ind. 89, 23–34. doi:10.1016/j.compind.2017.04.002
Islam, M. S., Hoque, I., Rahman, S. M., and Salam, M. A. (2023). Evaluating supply chain resilience using supply chain management competencies in the garment industry: a post COVID analysis. J. Industrial Prod. Eng. 40, 323–342. doi:10.1080/21681015.2023.2197907
Joseph, J. F., Sundarakani, B., Hosie, P., and Nagarajan, S. (2010). Analysis of vendor managed inventory practices for greater supply chain performance. Int. J. Logist. Econ. Glob. 2, 297. doi:10.1504/IJLEG.2010.037518
Kucukaltan, B., Saatcioglu, O. Y., Irani, Z., and Tuna, O. (2022). Gaining strategic insights into Logistics 4.0: expectations and impacts*. Prod. Plan. Control 33, 211–227. doi:10.1080/09537287.2020.1810760
Lee, H.-C., and Shin, H.-C. (2008). “On-line and real time logistics management system for enhancing customer services,” in 2008 International Conference on Convergence and Hybrid Information Technology, Daejeon, Korea (South), 28-30 August 2008 (IEEE), 785–789. doi:10.1109/ICHIT.2008.299
Li, B., Jiang, S., Zhou, Y., and Xuan, H. (2023). Optimization of train formation plan based on technical station under railcar demand fluctuation. J. Industrial Prod. Eng. 40, 448–463. doi:10.1080/21681015.2023.2221699
Li, C., Chen, Y., and Shang, Y. (2022). A review of industrial big data for decision making in intelligent manufacturing. Eng. Sci. Technol. Int. J. 29, 101021. doi:10.1016/j.jestch.2021.06.001
Liotine, M. (2019). Shaping the next generation pharmaceutical supply chain control tower with autonomous intelligence. J. Aut. Intell. 2, 56. doi:10.32629/jai.v2i1.34
Marzialia, M., Rossit, D. A., and Toncovicha, A. (2022). Order picking and loading-dock arrival punctuality performance indicators for supply chain management: a case study. Eng. Manag. Prod. Serv. 14, 26–37. doi:10.2478/emj-2022-0003
Mbhele, T. P. (2016). Decoupling paradigm of push-pull theory of oscillation in the FMCG industry. South Afr. J. Bus. Manag. 47, 53–66. doi:10.4102/sajbm.v47i2.60
Mehmood, R., Meriton, R., Graham, G., Hennelly, P., and Kumar, M. (2017). Exploring the influence of big data on city transport operations: a Markovian approach. Int. J. Operations Prod. Manag. 37, 75–104. doi:10.1108/IJOPM-03-2015-0179
Miao, Z., Cai, S., and Xu, D. (2014). Applying an adaptive tabu search algorithm to optimize truck-dock assignment in the crossdock management system. Expert Syst. Appl. 41, 16–22. doi:10.1016/j.eswa.2013.07.007
Midkiff, C. (2021). Using a control tower approach to drive visibility, aid planning and improve supply chain reliability. J. Supply Chain Manag. Logist. Procure. 4, 70–78.
Morganti, E., and Gonzalez-Feliu, J. (2015). City logistics for perishable products. The case of the Parma’s Food Hub. Case Stud. Transp. Policy 3, 120–128. doi:10.1016/J.CSTP.2014.08.003
Pan, A., and Choi, T.-M. (2016). An agent-based negotiation model on price and delivery date in a fashion supply chain. Ann. Oper. Res. 242, 529–557. doi:10.1007/s10479-013-1327-2
Pourhejazy, P., Sarkis, J., and Zhu, Q. (2019). A fuzzy-based decision aid method for product deletion of fast moving consumer goods. Expert Syst. Appl. 119, 272–288. doi:10.1016/j.eswa.2018.11.001
Ramos de Oliveira, A. L., Braga Marsola, K., Milanez, A. P., and Liegé Renner Fatoretto, S. (2022). Performance evaluation of agricultural commodity logistics from a sustainability perspective. Case Stud. Transp. Policy 10, 674–685. doi:10.1016/J.CSTP.2022.01.029
Rodrigue, J. P. (2022). Home-based parcel deliveries: consumer and logistics patterns from retail digitalization. Case Stud. Transp. Policy 10, 2413–2419. doi:10.1016/J.CSTP.2022.11.004
Rölli, M. (2021). Der Supply Chain Control Tower zur Steuerung des Transport-Managements. Wirtschaftsinformatik Manag. 13, 20–29. doi:10.1365/s35764-020-00313-8
Sharabati, A.-A. A., Al-Atrash, S. A., and Dalbah, I. Y. (2022). The use of supply chain control tower in pharmaceutical industry to create a competitive advantage. Int. J. Pharm. Healthc. Mark. 16, 354–375. doi:10.1108/IJPHM-08-2020-0064
Sharma, S. (2017). An efficient truck dock allocation algorithm. Glob. J. Enterp. Inf. Syst. 9, 65–74. doi:10.18311/gjeis/2017/15868
Simchi-Levi, D., Kaminsky, P., Simchi-Levi, E., and Shankar, R. (2008). Designing and managing the supply chain: concepts, strategies and case studies. Tata McGraw-Hill Education.
Smith, G. A. (2022). Supply chain control towers - benefïts & framework for implementation. J. Bus. Forecast. 41.
Song, R., Lau, H. C., Luo, X., and Zhao, L. (2022). Coordinated delivery to shopping malls with limited docking capacity. Transp. Sci. 56, 501–527. doi:10.1287/trsc.2021.1109
Syahchari, D. H., Sudrajat, D., Lasmy, L., Grace Herlina, M., Kiatama, C., and K W Jordaan, H. (2022). “Achieving supply chain resilience through supply chain control tower and supply chain agility,” in 2022 5th International Conference on Computers in Management and Business (ICCMB) (New York, NY, USA: ACM), 195–198. doi:10.1145/3512676.3512709
Tyagi, A. K., and Sreenath, N. (2023). “Intelligent transportation system in internet of things-based computing environment,” in Intelligent transportation systems: theory and practice. Disruptive technologies and digital transformations for society 5.0 (Singapore: Springer), 265–281. doi:10.1007/978-981-19-7622-3_12
Vlachos, I. (2021). Implementation of an intelligent supply chain control tower: a socio-technical systems case study. Prod. Plan. Control, 1–17. doi:10.1080/09537287.2021.2015805
Wanganoo, L., Shukla, V. K., and Panda, B. P. (2021). “NB-IoT powered last-mile delivery framework for cold supply chain,” in Data driven approach towards disruptive technologies. Studies in autonomic, data-driven and industrial computing (Singapore: Springer), 257–268. doi:10.1007/978-981-15-9873-9_22
Wu, M., Liu, K., and Yang, H. (2019). RETRACTED ARTICLE: supply chain production and delivery scheduling based on data mining. Clust. Comput. 22, 8541–8552. doi:10.1007/s10586-018-1894-8
Wu, P.-J., and Yang, C.-K. (2018). “Unstructured big data analytics for air cargo logistics management,” in 2018 IEEE International Conference on Service Operations and Logistics, and Informatics (SOLI), Singapore, 31 July 2018 - 02 August (IEEE), 274–278. doi:10.1109/SOLI.2018.8476741
Wyciślak, S. (2022). Exploring real-time visibility transportation platform deployment. Logforum 18, 109–121. doi:10.17270/J.LOG.2022.660
Keywords: logistics 4.0, visibility, transport management, distribution network, automated decision-making
Citation: Wyciślak S and Pourhejazy P (2023) Supply chain control tower and the adoption of intelligent dock booking for improving efficiency. Front. Energy Res. 11:1275070. doi: 10.3389/fenrg.2023.1275070
Received: 09 August 2023; Accepted: 03 October 2023;
Published: 13 October 2023.
Edited by:
Siamak Hoseinzadeh, Sapienza University of Rome, ItalyReviewed by:
Ming Lang Tseng, Asia University, TaiwanCopyright © 2023 Wyciślak and Pourhejazy. This is an open-access article distributed under the terms of the Creative Commons Attribution License (CC BY). The use, distribution or reproduction in other forums is permitted, provided the original author(s) and the copyright owner(s) are credited and that the original publication in this journal is cited, in accordance with accepted academic practice. No use, distribution or reproduction is permitted which does not comply with these terms.
*Correspondence: Pourya Pourhejazy, cG91cnlhLnBvdXJoZWphenlAdWl0Lm5v
Disclaimer: All claims expressed in this article are solely those of the authors and do not necessarily represent those of their affiliated organizations, or those of the publisher, the editors and the reviewers. Any product that may be evaluated in this article or claim that may be made by its manufacturer is not guaranteed or endorsed by the publisher.
Research integrity at Frontiers
Learn more about the work of our research integrity team to safeguard the quality of each article we publish.