
95% of researchers rate our articles as excellent or good
Learn more about the work of our research integrity team to safeguard the quality of each article we publish.
Find out more
ORIGINAL RESEARCH article
Front. Energy Res. , 28 November 2023
Sec. Carbon Capture, Utilization and Storage
Volume 11 - 2023 | https://doi.org/10.3389/fenrg.2023.1274425
 Zhi Long1,2*
 Xiangzhou Chen1,2
To enhance the precision of predicting enterprise credit risk related to carbon emission reduction, this study focuses on publicly traded companies. It introduces a risk early warning model grounded in MLP deep learning. Primarily, this research employs the FA-TOPSIS fusion model to comprehensively assess the credit risk associated with carbon emission reduction in enterprises. Subsequently, it employs K-means clustering to compute enterprise similarities, which forms the basis for supervised learning in the MLP model to assign credit risk grade labels. Furthermore, the study tackles the challenge of imbalanced enterprise grade distribution using the ADASYN over-sampling algorithm. Ultimately, the effectiveness of the model proposed herein is confirmed through a series of multi-model comparison experiments. The results show that: First, carbon emission reduction indicators exhibit differing degrees of influence on enterprises at various credit risk levels. Notably, the most influential indicator is carbon emission intensity, while the development capacity indicator exerts the least influence. Second, the adoption of the XGBoost algorithm for screening carbon emission reduction indicators significantly enhances the prediction accuracy of the early warning model by 4.27%. Third, compared to other models, the MLP model achieves an impressive prediction accuracy of 99.48%, representing an average improvement of 15.24%. These results underscore the model’s feasibility and its potential to provide technical support for financial institutions and government entities in conducting credit ratings for enterprise carbon emission reduction.
Addressing climate change represents a pivotal strategy for China in advancing high-quality economic development and ecological progress. As one of the world’s foremost carbon emitters, China has been actively responsive to the international community’s call. On 22 September 2020, during the 75th United Nations General Assembly, General Secretary Xi Jinping announced China’s commitment to strive for a peak in carbon dioxide emissions by 2030 and to diligently pursue carbon neutrality by 2060. The Fifth Plenary Session of the 19th CPC Central Committee underscored the importance of green development and the harmonious coexistence of humanity and nature. Furthermore, the 20th Party Congress report advocated for the active and steady promotion of carbon peaking and carbon neutrality. Carbon emissions primarily arise from human activities and natural sources, contributing to global temperature rises and closely intertwining with economic growth. China’s rapid economic expansion has led to increasing carbon emissions, pushing environmental capacity to its limits. Consequently, reconciling the tension between carbon reduction and economic growth has become a significant challenge. Enterprises with high carbon emissions confront difficulties in securing capital and loans from stakeholders like investors, banks, and government bodies (Yin and Li, 2018; Jiang et al., 2023). Thus, the effective early warning of carbon emission reduction credit risks by these enterprises becomes pivotal, influencing investment decisions, loan approvals, and the sustainable development of the nation’s economy (Yu et al., 2022). Given this context, there’s an imperative need to conduct in-depth research into shifts in carbon emission reduction credit risks among enterprises. This research aims to facilitate the formulation of pertinent policies and measures that will drive the realization of carbon emission reduction objectives.
The early warning of enterprise carbon emission reduction credit risk represents a pivotal area of study within credit risk research. The key to an effective early warning system lies in the construction of a scientifically sound credit risk indicator framework (Jiang et al., 2022). Currently, both domestic and international scholars have established various credit risk indicator systems. For instance, within the context of the supply chain finance model, scholars have developed distinct credit risk assessment systems from diverse angles. These frameworks shed light on the role of supply chains in mitigating enterprises’ financing challenges and offer policy recommendations that enhance evaluation systems (Carling et al., 2007; Zhu et al., 2019; Zhang et al., 2022; Ni et al., 2023; Xie et al., 2023). Moreover, Abbasi et al. (2019) introduced an IoT-based supply chain finance model tailored to the model’s characteristics, yielding a highly accurate model that improves existing credit evaluation systems (Abbasi et al., 2019). Scholars like Xuan and Chen have developed extensive indicator systems from varying perspectives, encompassing economic development, technological advancement, and green credit. They’ve delved into the intricate relationship between China’s economy and carbon emission reduction (Xuan et al., 2020; Chen and Chen, 2021). In another work, Yadi elucidated the fusion of financial and non-financial data, proposing a big data-driven credit assessment framework for SMEs, significantly aiding enterprise credit risk assessment (Yadi et al., 2019). Furthermore, Xia et al. (2023) scrutinized company profiles, asset statuses, core business details, and supply chain conditions to construct a financial credit risk assessment system tailored to manufacturing SMEs (Xia et al., 2023). Therefore, a scientific and reasonable indicator system can effectively provide the prediction performance of the early warning model and thus help stakeholders make more reasonable decisions. Accordingly, how to construct an effective and perfect enterprise carbon emission reduction credit risk indicator system has become a hot issue worth studying.
In the realm of artificial intelligence, both deep learning and machine learning have achieved remarkable breakthroughs across various domains, with a particular impact seen in the arena of credit risk prediction. Yuan et al. (2018) employed the ELDA model to scrutinize public sentiment on social media, seamlessly integrating it with a random forest model. Their findings highlighted the significant enhancement of corporate credit rating prediction brought about by public sentiment analysis (Yuan et al., 2018). Luo et al. (2020) introduced the QSSVM model, coupled with feature weights derived from t-tests. This approach effectively obviated the need for manual selection of hyperparameters. Their results underscored the model’s efficacy in corporate credit risk assessment, showcasing substantial potential in practical applications (Luo et al., 2020). With the surge in data volume and dimensionality, traditional machine learning models have grappled with the ensuing challenges. For example, it is difficult to deal with large-scale and high-dimensional data, high reliance on feature engineering and concept drift. Consequently, As the credit risk field undergoes continuous evolution, deep learning models are emerging as the preferred solution to address the intricate demands of credit assessment. This paradigm shift finds validation across multiple research studies. For instance, studies have showcased the effectiveness of deep learning models such as BP neural networks (Cai et al., 2020; Wu et al., 2021; Liu, 2022; Wan and Yu, 2023) and Multi layer perception (MLP) (Lian et al., 2021; Li et al., 2022; Wang and Zhang, 2023). The appeal of these deep learning models lies in their exceptional performance and versatility. One of the key advantages is the ability of deep learning models to adeptly tackle complex nonlinear challenges. Within the realm of credit risk assessment, data often entails intricate combinations of nonlinear relationships, transcending mere linear associations. Deep learning models, with their intrinsic self-learning capabilities, excel at automatically identifying and leveraging these intricate nonlinear relationships. Through the autonomous adjustment of model weights and biases, they demonstrate the capacity to approximate any given function, elevating the precision of credit assessments.
In conclusion, the existing body of literature predominantly applies deep learning techniques to the realm of enterprise financial credit risk assessment, often simplifying the creditworthiness of companies into binary categories of “good” or “bad.” However, this oversimplified approach does not always align with the complex realities faced by these enterprises. Surprisingly, there has been a noticeable absence of scholarly attention dedicated to leveraging deep learning methodologies for assessing corporate carbon emission reduction credit risk. Furthermore, there’s a significant gap in the literature when it comes to intelligent prediction and in-depth analysis of the dynamics of carbon creditworthiness within each enterprise, as well as the provision of strategic policy guidance for fostering a low-carbon transition. Addressing this research gap, this paper conducts an empirical study focusing on Chinese A-share listed companies spanning from 2007 to 2020. The study employs a multi-faceted approach: firstly, utilizing the FA-TOPSIS model to comprehensively evaluate carbon emission reduction credit risk. Secondly, incorporating the K-means clustering algorithm to delineate distinct risk levels, enabling precise risk management. Thirdly, it employs the ADASYN oversampling algorithm to rectify issues associated with imbalanced data categories, subsequently enhancing the prediction performance of the MLP model. Lastly, a series of multi-model comparative experiments are executed to validate the efficacy and superiority of the model introduced in this study.
The possible contributions of this paper are as follows: First, this paper proposes a deep learning model based on MLP and applies it to the field of enterprise carbon emission reduction credit risk early warning for the first time, giving full play to the advantages of MLP in dealing with nonlinear classification problems. Second, based on financial indicators, this paper selects governance structure, innovation ability, and carbon emission intensity indicators. It comprehensively considers the influencing factors of enterprise carbon emission reduction credit risk. Meanwhile, the XGBoost algorithm is used to eliminate indicators with low feature contributions, which in turn improves the model prediction accuracy. Third, the K-Means clustering algorithm is introduced to solve the previous difficulties in obtaining the labels of carbon emission reduction credit risk levels for enterprises. Meanwhile, considering the small number of enterprises with low and high credit risk, this paper adopts ADASYN oversampling to solve the category imbalance problem. In summary, we hope that the findings of this paper can provide practical and policy guidance for carbon emission reduction and the sustainable development of enterprises.
The other chapters of this paper are arranged as follows: The second part is the research design, which mainly introduces the data sources and the principles of the methods used in the experiments. The third part is the empirical analysis, which mainly derives the experimental results through empirical analysis, analyzes which indexes should be focused on in the credit risk of carbon emission reduction of the enterprises according to the results, and compares and verifies the feasibility and superiority of the model in this paper. The fourth part is the conclusion and suggestions, summarizing the research conclusions of this paper and the directions for further research in the future and giving the corresponding suggestions.
Financial institutions typically contend with heightened financial risks, stemming from distinctive business models that markedly differ from other industries. These distinctions can potentially exert a significant influence on the predictive efficacy of the model. Consequently, in line with the practice of previous studies (Abdulsaleh and Worthington, 2013; Wu and Huang, 2022), we have deliberately excluded financial enterprises from our sample selection. Our empirical research centers on a comprehensive dataset comprising 2,555 publicly listed Chinese A-share companies spanning the years 2007–2020. This dataset encompasses various industries, such as textiles, manufacturing, and coal mining, among others. Following meticulous data processing, including the removal of outliers and the application of group mean filling, we are left with a dataset of 11,261 samples, representing a total of 1,379 listed enterprises.
To maintain alignment with prevailing research practices, this study adopts a straightforward random sampling approach. It divides the dataset into a training set and a test set, with a sample ratio of 7:3, respectively. The training set is employed for model training and parameter fine-tuning, while the test set serves as a benchmark for evaluating the model’s classification predictive performance. All experiments detailed in this paper are executed using the PyCharm programming software, harnessed with the PyTorch deep learning framework, a configuration widely recognized in the field for its versatility and efficiency.
The formulation of the enterprise’s credit risk assessment index system for carbon emission reduction should adhere to principles encompassing systematicity, scientific rigor, and data accessibility. Drawing from prior research (Zhang et al., 2022; Ding et al., 2023; Sun and Zeng, 2023), this study incorporates a total of 30 indicators, sourced from seven facets, which encompass solvency, operational prowess, profitability, developmental capacity, governance structure, innovation capabilities, and carbon emission intensity. This composite system aims to provide a holistic evaluation of the enterprise’s operational performance, financial health, and credit risk. For a detailed breakdown of these specific indicators, please refer to Table 1.
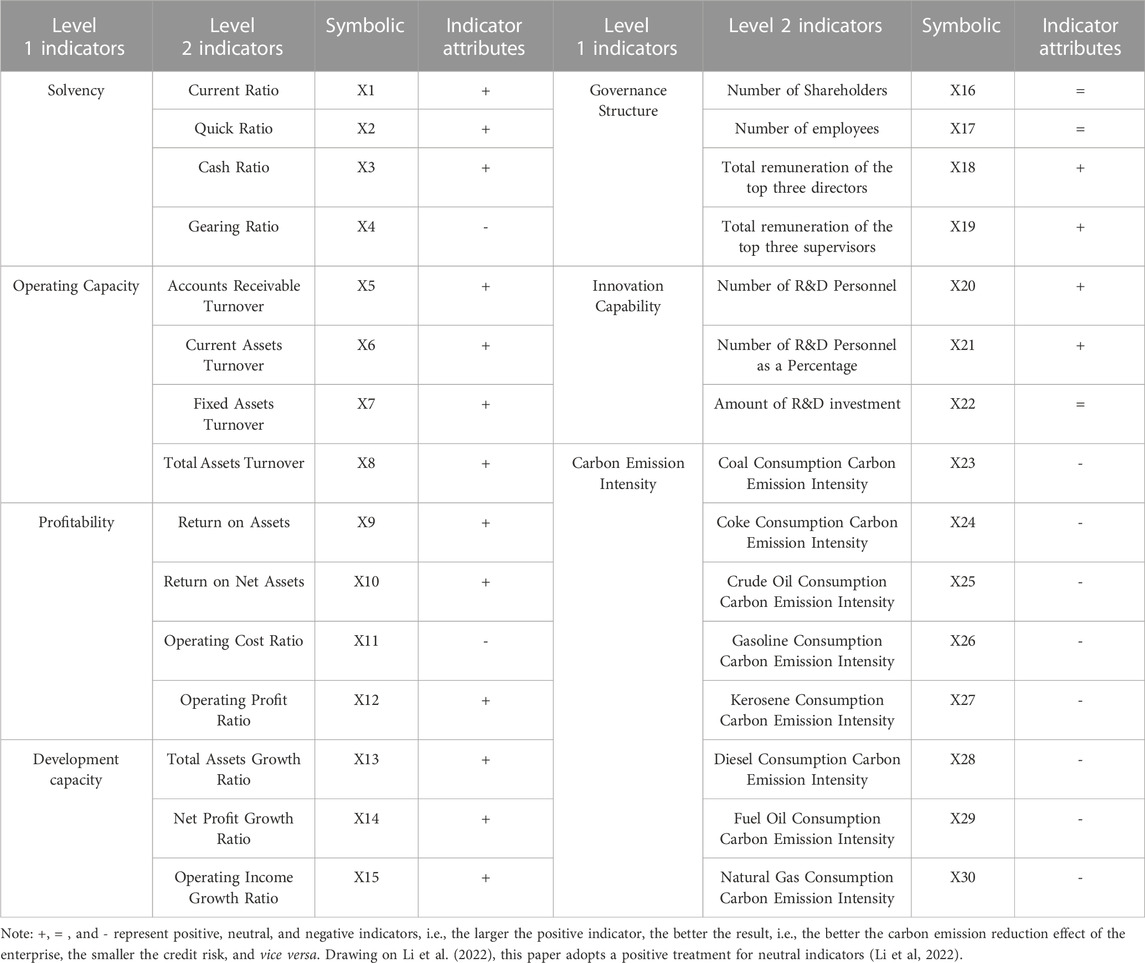
TABLE 1. Enterprise carbon emission reduction credit risk indicator system.
Specifically, carbon intensity serves as a pivotal metric for quantifying carbon emissions per unit of production. A reduced carbon intensity signifies a company’s proactive efforts in curtailing carbon emissions, subsequently mitigating credit risk. This aligns with the global thrust towards carbon footprint reduction and the pursuit of sustainable development objectives. Hence, this research adopts the baseline approach, a method in which China’s carbon market assigns quota allocations based on the industry benchmark value of carbon emission intensity. Additionally, eight ancillary indicators related to carbon emission intensity are incorporated into the assessment framework. It is noteworthy that these auxiliary indicators all carry a negative connotation, implying that a lower carbon emission intensity value corresponds to a reduced credit risk concerning carbon emission reduction, reflecting real-world scenarios.
Enterprises’ financial data were obtained from the CSMAR database, and carbon emission reduction data were obtained from the Wind database.
In this paper, we will Max-Min standardize the data of enterprise indexes to eliminate the influence of different indexes’ quantities and improve the performance of the model, as shown in Eq. 1.
Where:
In this study, Factor Analysis (FA) is employed to ascertain the objective weights of the indicators. FA is a widely adopted statistical technique designed to simplify the intricate web of indicators into a smaller set of composite factors. It achieves this by delving into the inherent interdependencies within correlation matrices and employing the concept of indicator downgrading. The steps for the calculation of FA include: First, the enterprise index data are standardized; subsequently, the correlation matrix between the indicators is calculated; then, the eigenroots and eigenvectors of the correlation matrix are calculated; on this basis, the optimal number of composite factors is determined by combining the eigenvalue and cumulative contribution rate considerations; subsequently, the rotated factor loading matrix is calculated; finally, the factor model is determined, and an in-depth analysis is performed on the overall sample data (Gorsuch, 2014). Currently, the method is mainly used in the fields of business economics, finance, education management, and tourism (Yin et al., 2022).
Utilizing Factor Analysis (FA) to ascertain indicator weights presents several advantages: Firstly, it addresses the subjectivity inherent in existing methods such as hierarchical analysis and fuzzy comprehensive evaluation when determining weights. Consequently, this enhancement increases the precision of the model’s overall scores. Secondly, FA fully embraces the dynamic and objective nature of the actual enterprise indicator data collected. This ensures that the calculation results are more scientifically grounded and rational. The process for calculating FA is as follows:
Assuming that there are m corporate carbon emission reduction credit risk indicators and q composite factors, Eq. 2 is calculated as:
Where:
In this paper, the Technique for Order Preference by Similarity to Ideal Solution (TOPSIS) is employed to calculate the comprehensive score for each enterprise. This method assigns a higher comprehensive score to enterprises with lower carbon emission reduction credit risk. TOPSIS, classified as a multi-attribute decision analysis method, derives the optimal order and selection scheme by comparing the similarity of alternatives to the ideal solution while considering the distance and proximity between them (Olson, 2004). The fundamental concept involves representing multiple alternatives (each enterprise in this study) as a matrix, where each row corresponds to an alternative (enterprise) and each column corresponds to an attribute (indicator). This method offers the advantages of rapid computational efficiency, adaptability, and ease of comprehension. It finds extensive application in fields such as supply chain management, environmental assessment, and investment decision-making. The calculation process for TOPSIS is as follows:
In the first step, the initial comprehensive evaluation matrix containing multiple indicators is constructed. Assuming that the number of listed enterprises is n, there are m carbon emission reduction credit risk indicators, and the data of the jth indicator of the ith sample is x_ij, the matrix is expressed as Eq. 3:
In this paper, Max-Min standardization is used to dimensionless the indicators. In this case, positive and neutral indicators are treated with Eq. 4 and negative indicators are treated with Eq. 5.
In the second step, the FA method determines the weight of each indicator. For example, the weight of the jth indicator is
In the third step, the TOPSIS method determines the Euclidean distance between each enterprise and the positive and negative ideal solutions. Through the weight matrix obtained above, and then update the initial comprehensive score matrix, i.e.,
In summary, the proximity (composite score) of each listed firm in i to the ideal firm can be calculated as:
Therefore, if the enterprise’s comprehensive score value
In this study, the K-Means clustering algorithm is employed to cluster unlabelled enterprises, enabling the classification of enterprise carbon emission reduction credit risk levels. The K-Means clustering algorithm is categorized under unsupervised learning, a component of multivariate statistical analysis, primarily used to group samples based on their similarities. Widely used clustering methods encompass K-Mean clustering, second-order clustering, systematic clustering, and FCM clustering. Given its simplicity, ease of implementation, and scalability, the K-Mean clustering algorithm is well-suited for diverse datasets (Likas et al., 2003; Cheng and Han, 2023).
Since the existing literature usually categorizes a firm’s financial or credit standing as simply “good” or “bad”, this approach does not always correspond to the actual situation of the enterprise. Consequently, this paper adopts the K-Mean clustering algorithm to assign credit risk ratings, categorizing them into four grades: A, B, C, and D, corresponding to very low, low, medium, and high carbon emission reduction credit risk, respectively. The calculation process for this algorithm is as follows:
In the first step, the center position of the k clusters (k enterprise carbon emission reduction credit risk levels) is initialized, and k enterprises can be randomly selected as the initial cluster centers, and the maximum number of iterations is determined.
In the second step, for each enterprise, calculate its Euclidean distance from the center of each cluster and assign it to the cluster with the closest distance according to the size of the distance, Eq. 12 is as follows:
In the third step, the center position of each cluster is updated and set to the mean value of all enterprises in that cluster with Eq. 13 as follows:
In the fourth step, the second and third steps are repeated until the cluster center no longer changes significantly or a predetermined number of iterations is reached.
In this research, we employ the Multi layer perception (MLP) to intelligently predict the carbon emission reduction credit risk of listed enterprises. The Artificial Neural Network (ANN) serves as a model that mimics the human central nervous system, comprising a vast network of interconnected neurons. These neural connections are continually optimized by powerful algorithms to facilitate information processing. MLP, as a feed-forward neural network model, consists of multiple layers of neurons, with each layer fully connected. The fundamental architecture of an MLP encompasses an input layer, a hidden layer, and an output layer. The input layer receives external data inputs and forwards them to the hidden layer. This hidden layer nonlinearly transforms the inputs using an activation function and subsequently passes them to the output layer. The choice of activation function in the output layer depends on the specific task, which can include functions like the Sigmoid function, Softmax function, and others (Rossi and Conan-Guez, 2005). As a foundational artificial neural network model, MLP finds widespread application in industrial economics, credit risk assessment, and finance. The structure of the model is shown in Figure 1.
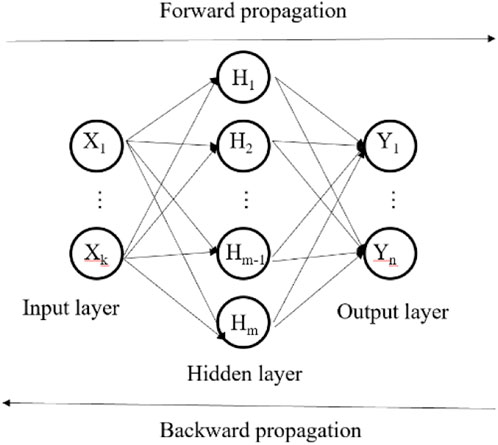
FIGURE 1. Basic structure of MLP.
The use of MLP for risk prediction has the following two advantages: First, during the back propagation of the model, MLP can utilize the gradient descent algorithm to better solve the problem of the distribution of the contribution of each indicator (Baesens et al., 2003); Second, through the introduction of the activation function (such as the Relu function), the MLP has a strong fitting ability and is able to approximate the reality of any complex nonlinear functional relationship. The Formula (14) for MLP is as follows:
Where:
The steps of the MLP model applied to the early warning of corporate carbon emission reduction credit risk are roughly as follows:
Step 1: The data of listed companies are randomly divided into training set and test set, and randomly divided 50 times to eliminate the effect of sample randomness on the prediction results of the model. Step 2: The enterprise index data of the training set enters the neural network model through the input layer of the MLP, and then passes to the hidden layer, and the inputs of each hidden layer are the weighted summation of the outputs of the previous layer, i.e.,
Enterprise carbon emission reduction credit risk prediction is a multi-classification problem. Therefore, this paper is based on multi-model comparison experiments, respectively, with the MLP model with LightGBM model, Random Forest RF, support vector machine SVM (Linear) with linear kernel function, support vector machine SVM (Rbf) with radial basis function, and extreme gradient augmentation algorithm XGBoost, to test the validity of the MLP model according to the “sample recognition rate.”
Assuming that
Where: a higher value of
A very good model prediction effect not only has a high value of
Where:
This paper carries out carbon emission reduction credit risk early warning of listed enterprises through MLP model and verifies the effectiveness of MLP model based on multi-model comparison experiment, as shown in Figure 2.
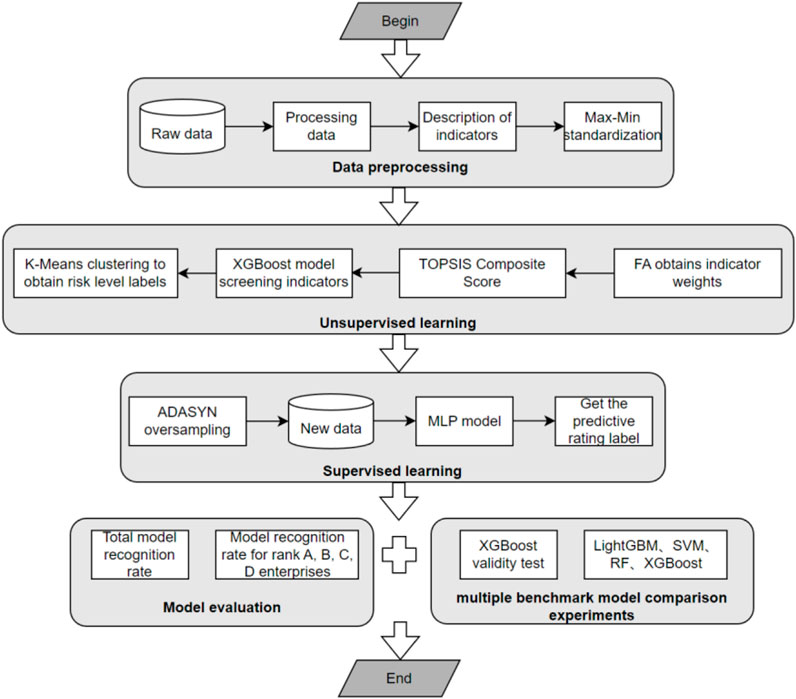
FIGURE 2. Early warning process of the model in this paper.
The early warning process comprises five key components: data preprocessing, unsupervised learning, supervised learning, model comparison experiments, and model performance evaluation. Initially, the data preprocessing module primarily handles missing values, null entries, and outliers. It standardizes the data for each indicator to neutralize the influence of magnitude variations. Subsequently, the unsupervised learning module centers on the comprehensive scoring of corporate credit risk. It employs K-Means clustering, based on these comprehensive scores, to derive the corresponding credit risk level labels. Following that, the supervised learning module predominantly utilizes the MLP model to classify and predict credit risk grades. This is done by applying ADSYN oversampling to the processed enterprise samples and incorporating clustering to generate hierarchical labels. Lastly, the multi-model comparison experiment and model performance evaluation module focus on assessing the overall recognition rate of each model and the recognition rate of each enterprise grade. This serves to validate the progress and effectiveness of the model introduced in this paper.
In this paper, the weights of each credit risk indicator are obtained through the formula in the FA method. First of all, the data of each credit indicator needs to be Z-score standardized to eliminate the influence of different indicators’ scales. Then, it will be subjected to KMO and Bartlett’s sphericity test to determine whether the dataset is worthy of factor analysis. For the KMO value, above 0.9 indicates that it is very suitable for factor analysis; (0.7, 0.9) indicates that it is suitable; (0.5, 0.7) indicates that it is acceptable; and below 0.5 indicates that it is not acceptable and needs to be re-adjusted. The Bartlett’s spherical test is used to test whether the correlation between the indicators in the correlation matrix is a unit matrix (i.e., the original hypothesis is that the indicators are independent of each other). Only if the original hypothesis is rejected can it be shown that there is a correlation between the indicators, it indicates FA be performed. The specific results, as shown in Table 2.
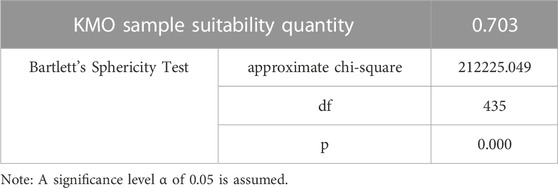
TABLE 2. KMO and Bartlett’s sphericity test.
As can be seen from Table 2, the KMO test value is 0.703 and greater than 0.7, and the Bartlett’s spherical test results show that the p-value is less than 0.05, rejecting the original hypothesis. The above indicates that the overlap between the credit indicators first selected in this paper is high, and there is a certain correlation from which fewer composite factors can be extracted. Therefore, the research data in this paper is suitable for factor analysis, and then the weights of the indicators can be obtained.
Drawing on the existing literature on how to use factor analysis to obtain the weights of indicators (Gan et al., 2017; Greco et al., 2019), the weights of the indicators were finally obtained, as shown in Table 3.

TABLE 3. Distribution of weights for each indicator.
From Table 3, it is found that: First, among the secondary indicators, the top five (in descending order) with larger weights are diesel consumption carbon intensity X28, natural gas consumption carbon intensity X30, coke consumption carbon intensity X24, number of research and development personnel X20, and fuel oil consumption carbon intensity X29, with weights greater than 4%, which indicates that the contribution of these indicators is higher and that they are an important factor influencing the credit risk of carbon emission reduction of enterprises. Second, the top three level 1 indicators (in descending order) with relatively large average weights are carbon emission intensity, governance structure, and solvency, with a cumulative weight of 61.72%, indicating that these indicators play a larger role in determining the credit risk of carbon emission reduction in enterprises. The last two indicators with smaller average weights are innovation capacity and development capacity, with a cumulative weight of 15.47%.
It is essential to emphasize that, when considering both primary and secondary indicators, carbon emission intensity emerges as the most influential factor affecting the credit risk associated with carbon emission reduction in enterprises. This prominence can be attributed to the fact that carbon intensity provides an objective measure of an enterprise’s carbon emissions per unit of output, directly reflecting the environmental impact of its production activities. A high carbon intensity typically signifies elevated carbon emissions per unit of output, leading to increased environmental pressure and ecological risks. Furthermore, high-carbon intensity enterprises often encounter elevated financing costs, hurdles in obtaining loan approvals, and a heightened risk of debt default. Consequently, for a comprehensive and precise evaluation of the credit risk associated with carbon emission reduction in enterprises, it becomes imperative for these enterprises to proactively disclose data related to their carbon emissions. Such disclosure holds significant strategic importance for governments, financial institutions, investors, and the enterprises themselves (Xue et al., 2023).
This paper derives the Euclidean distance
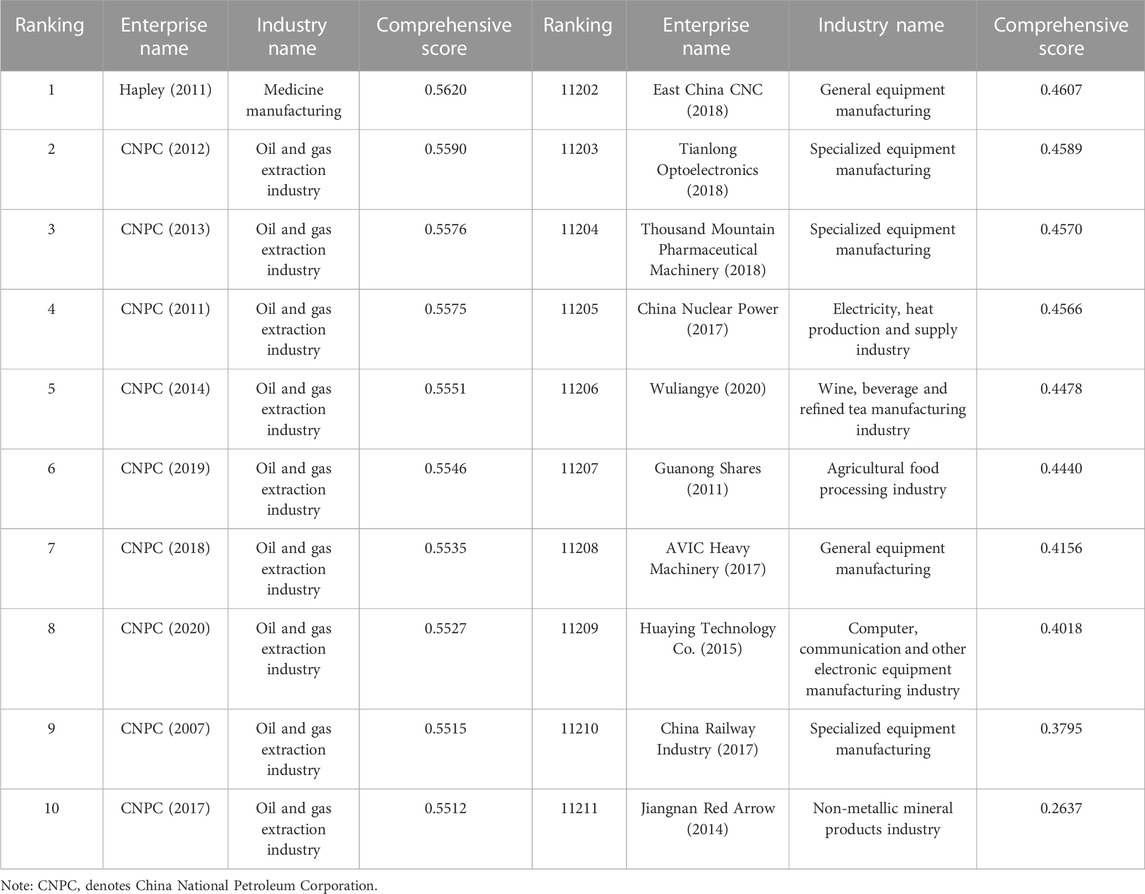
TABLE 4. Composite score of carbon emission reduction credit risk for each enterprise.
It is found in Table 4 that: First, the mean value of the comprehensive score of enterprises’ carbon emission reduction credit risk is 0.4823, the standard deviation is 0.0059, the coefficient of variation is 0.0122, the 25% quartile is 0.4795, the 50% quartile is 0.4814, and the 75% quartile is 0.4838, and the comprehensive scores of nearly three-quarters of the enterprises are close to the average, which indicates that the carbon emission reduction credit risk of the majority of enterprises is at a relatively low level, which is suitable for banks and other financial institutions to provide them with green credit. Second, in the ranking of comprehensive scores, the second to 10th places are all CNPC, indicating that its carbon emission reduction credit risk is very low. Upon reviewing pertinent information, it becomes evident that PetroChina has consistently demonstrated a strong commitment to green and low-carbon development. This commitment is underscored by its inclusion of “green and low-carbon” as one of its five core strategies. Furthermore, PetroChina has made a solemn pledge to achieve carbon peaking by 2025 and to work towards “near-zero” emissions by 2050. Additionally, CNPC has been diligent in refining its low-carbon management department and enhancing its ESG (Environmental, Social, and Governance) disclosure practices. Notably, it is important to highlight that a majority of the enterprises ranking in the bottom ten positions are situated within industries known for their high energy consumption and emissions. Consequently, CNPC has managed to maintain a low carbon credit risk profile. This serves as a valuable reminder to other enterprises operating in similar sectors of the imperative need to implement effective carbon emission reduction measures and bolster clean production practices to advance the cause of sustainable development.
To observe the comprehensive score of carbon emission reduction credit risk of enterprises in high-energy consumption and high-emission industries, this paper selects enterprises in key polluting industries such as thermal power, cement, iron and steel, chemical industry and paper making to demonstrate, as shown in Table 5.
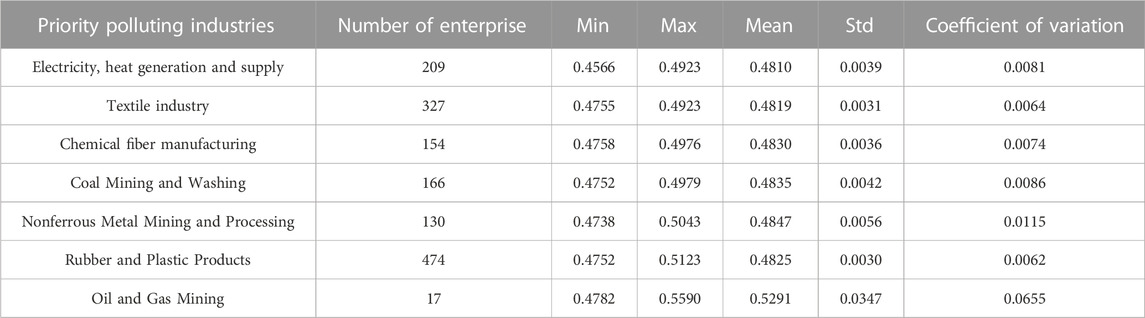
TABLE 5. Composite score of each enterprise under the priority polluting industries.
From Table 5, it is found that: First, from the average level of the composite score, the difference between these key polluting industries is very small, indicating that the average level of the overall carbon emission reduction credit risk is roughly at a low level, and at the same time, this also reflects that all of these industries are actively adopting corresponding carbon emission reduction measures; Second, from the point of view of the coefficient of variation, the oil and natural gas mining industry and the non-ferrous metal mining and extraction industry are located in the first and the second, respectively, and the corresponding values are 0.0655 and 0.0115 respectively, i.e., the relative dispersion of the data is large, indicating that the carbon emission reduction credit risk of each enterprise under these two industries varies greatly. Therefore, financial institutions should focus on enterprises in these industries when providing green credit to avoid capital losses due to misjudging the size of enterprise credit risk.
Multicollinearity among indicators has presented a significant challenge in the domain of early warning systems for corporate credit risk (Alin, 2010). To address this issue, this paper employs the Extreme Gradient Boosting (XGBoost) algorithm to assess all 30 indicators and determine their feature contributions. The magnitude of the feature contribution signifies the indicator’s importance. During the classification phase, XGBoost quantifies an indicator’s importance by computing the reduction in information entropy prior to the division of each indicator. This approach effectively screens and selects relevant indicators. The average of 50 experiments is taken as the final result to eliminate the influence of sample randomness on the prediction effect of the model, as shown in Table 6.
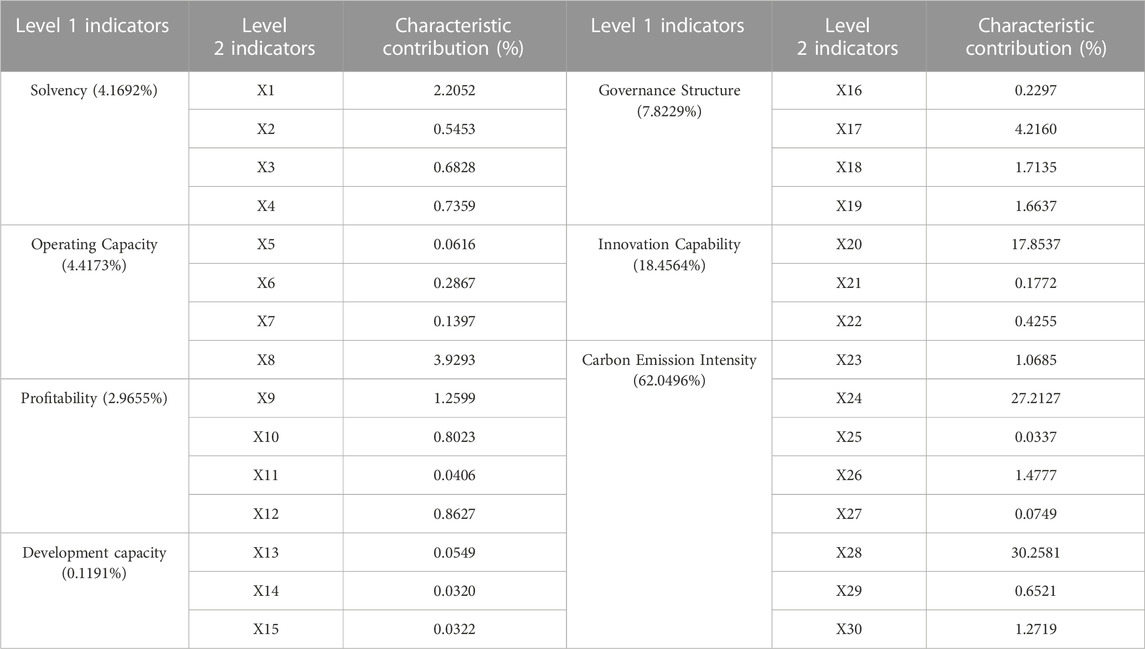
TABLE 6. Degree of importance of indicators based on XGBoost screening.
Table 6 reveals the following key findings: Firstly, when examining the secondary indicators, it becomes evident that the carbon intensity of diesel consumption (X28), the carbon intensity of coke consumption (X24), and the number of R&D personnel (X20) stand out as pivotal factors in discerning the credit risk associated with carbon emission reduction in enterprises, collectively contributing to 75.31% of the variance. Remarkably, this empirical outcome is largely consistent with the results presented in Table 3. Additional notable contributions include the number of employees (X17) at 4.21%, the total asset turnover ratio (X8) at 3.92%, and the current ratio (X1) at 2.20%, all of which hold substantial significance in influencing the credit risk associated with carbon emission reduction in enterprises. In contrast, the remaining indicators exhibit relatively lower contributions, exerting a comparatively lesser impact on the predictive efficacy of the model. Secondly, concerning the cumulative contribution of the primary indicators, carbon emission intensity and innovation capacity emerge as the dominant factors, contributing 62.04% and 18.45%, respectively. The combined contribution of these two significantly surpasses the cumulative contributions of the other primary indicators. Governance structure follows closely behind, underscoring its substantial role in determining the credit risk associated with corporate carbon emission reduction. Development capability, with a mere 0.11% contribution, indicates that in the assessment of carbon emission reduction credit risk for each enterprise, stakeholders, such as investors, banks, and governmental bodies, should place a heightened emphasis on carbon emission intensity and innovation capability. These factors not only form the cornerstone for enhancing green credit assessment systems but are also pivotal for advancing the realization of green and low-carbon development within enterprises.
In alignment with Lin B et al.’s methodology for indicator screening (Lin and Bai, 2022), we ranked the indicators based on their characteristic contributions, starting with the most substantial and descending to the least significant. Subsequently, the top seven indicators were chosen as the definitive outcome of the indicator screening process. These selected indicators, namely, X28, X24, X20, X17, X8, X1, and X18, were employed to validate the efficacy of XGBoost’s indicator screening approach. This rigorous selection process serves the dual purpose of ensuring the model’s robustness and preventing the occurrence of overfitting.
To assign grade labels to each enterprise based on their carbon emission reduction credit risk, this paper categorizes such risk into four grades: A, B, C, and D, denoting very low, low, medium, and high risk levels, respectively. These grades are determined through clustering using the K-means algorithm. To begin, an ANOVA test is applied to assess the significance of the comprehensive score
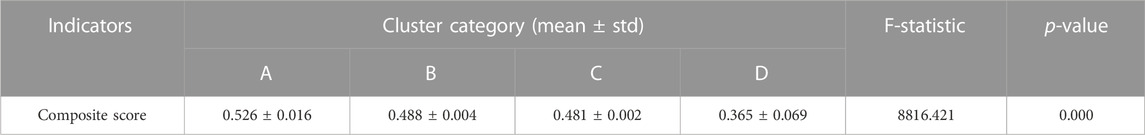
TABLE 7. Cluster variability analysis.
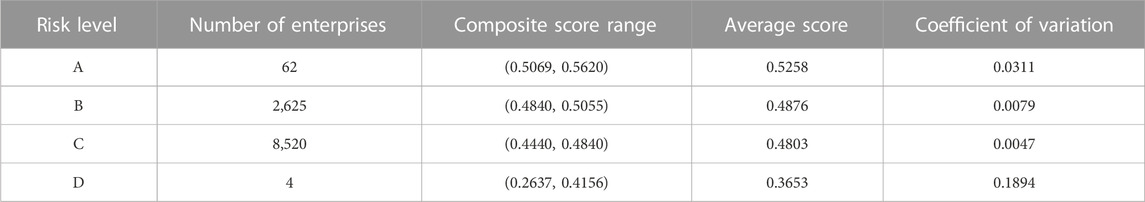
TABLE 8. K-Means cluster results.
As can be seen in Table 7, for the composite score indicator, the significance p-value of 0.000 is less than α, which presents significance at the level and rejects the original hypothesis, indicating that the composite score indicator has a significant difference between the categories (risk levels) delineated by the K-mean cluster analysis, and that this cluster analysis is feasible.
From Table 8, it is found that: First, in terms of the number of enterprises, the distribution of the number of each category is extremely unbalanced. Among them, there are only 4 enterprises with risk class D, while there are 8520 enterprises with risk class C. This clearly manifests itself as a typical category imbalance problem, which is highly likely to cause the machine learning model to overfit the C-rated enterprise data while underfitting the D-rated enterprise data in the categorization prediction task, thus degrading the predictive performance of the model. Therefore, in the subsequent experiments, this paper will adopt the ADASYN oversampling method to solve the problem of category imbalance; Second, the average score difference of each risk class after K-mean clustering is 0.0382, 0.0073, and 0.1150, respectively, and the average scores of the enterprises with high carbon emission reduction credit risk and the first three risk classes have a significant difference. At the same time, the relative discretization of the enterprises with the risk classes of A and D is larger, indicating that the carbon emission reduction measures adopted between these two types of enterprises are very different, and the carbon emission reduction effects realized are also very different.
To provide targeted advice to enterprises at each risk level and to gain insight into the first-level indicators that play an important role at different levels, banks and governments can go further to assess the overall carbon emission reduction credit risk of enterprises. Therefore, this paper utilizes the entropy weight method to further analyze the weights of the first-level indicators of carbon emission reduction credit risk for enterprises in each grade, as shown in Figure 3.
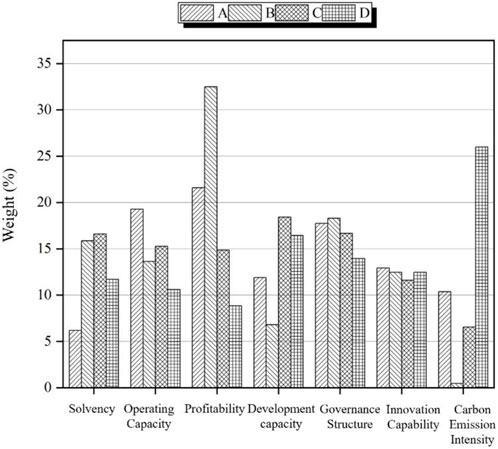
FIGURE 3. Comparison of weights of level 1 indicators.
From Figure 3, it is found that after K-Means clustering: First, when considering the average weight of the first-level indicators, they follow a descending order as follows: profitability, governance structure, operational capability, development capability, solvency, innovation capability, and carbon emission intensity. Therefore, when evaluating the credit risk of enterprises with varying levels of carbon emission reduction risk, financial institutions should give initial attention to the profitability of these enterprises. This is because enterprises often need to allocate capital and resources for environmental projects when implementing carbon emission reduction measures, potentially increasing their operational costs. Hence, financial institutions must assess enterprise profitability to ensure they have the financial capacity to manage the additional costs associated with carbon reduction measures. Concurrently, government policies, such as subsidies or tax reductions, can aid enterprises in mitigating carbon-related expenses and enhancing their profitability. Second, in comparison to the results presented in Tables 3, 6, both before and after clustering, governance structure consistently emerges as the pivotal factor in evaluating credit risk concerning carbon emission reduction by enterprises. This underscores the importance for enterprises to prioritize the establishment of robust governance structures, including effective environmental management systems, to mitigate their carbon emission reduction credit risk. However, noteworthy variations are observed in carbon emission intensity before and after clustering, particularly in enterprises categorized under risk grade D, where carbon emission intensity becomes the most influential factor. This phenomenon may arise from these enterprises’ historical lack of adequate carbon emission reduction measures, resulting in elevated carbon emission intensity.
In summary, it is imperative for stakeholders, including investors, banks, and governments, to collaborate in the formulation of suitable policies and strategies aimed at mitigating credit risks associated with carbon emission reduction in enterprises. These efforts should encompass the promotion of low-carbon development and the achievement of sustainable development goals. It is crucial to take into comprehensive consideration factors such as profitability, governance structure, and carbon emission intensity (Razzaq et al., 2023). This collective approach holds the potential to enhance the stability of national or regional financial markets and foster sustainable economic growth.
This experiment addresses the challenge of multi-classification in credit risk assessment with the objective of intelligently predicting risk grades. The model employs the seven indicators selected through XGBoost as input variables (independent variables), while the four credit risk grades resulting from K-Means clustering are utilized as output variables (dependent variables). In the context of solving classification problems, a commonly employed loss function is the Cross Entropy Loss (CEL) function. This function quantifies the disparity between two distinct probability distributions within the same random variable, effectively capturing the proximity between the actual and predicted probability distributions in machine learning. In essence, a lower cross-entropy value indicates improved predictive performance of the model.
Following the K-means clustering, the distribution of enterprises among different credit risk classes is as follows: A:B:C:D = 62:2625:8520:4. Notably, classes A and D comprise a very limited number of enterprises, resulting in a significant class imbalance issue. This data imbalance challenge can lead to overfitting of machine learning models, where the model overfits the data from class B and C enterprises while underfitting the data from class A and D enterprises, ultimately diminishing the model’s predictive performance.
To address this class imbalance problem, this paper employs the ADASYN oversampling algorithm before feeding the dataset into the MLP model for training. The ADASYN algorithm represents an improvement over He et al.'s (2008) work on the SMOTE algorithm, distinguishing itself from Borderline SMOTE. A notable advantage of ADASYN is its ability to dynamically determine the number of synthetic samples to generate for each minority class sample. This is in contrast to SMOTE, which generates the same number of synthetic samples for each minority class sample (He et al., 2008). ADASYN’s automatic determination of the number of samples to synthesize for each minority class sample can be likened to applying a weight to each minority class sample, with higher weights assigned when more majority class samples are in proximity. Consequently, the ADASYN algorithm results in a total of 34,240 samples after oversampling.
Following the TOPSIS composite score, the XGBoost screened indicators, and the K-Means clustering analysis, multi-model comparison experiments will be conducted to further validate the classification performance of the model proposed in this paper. The models included for comparison are as follows: the XGBoost-MLP model (referred to as M1, the model presented in this paper), the MLP model (M2, a model without the screened metrics), the LightGBM model (M3), the RF model (M4), the SVM model with a Linear kernel function (M5), the SVM model with an RBF kernel function (M6), and the XGBoost model (M7). Specifically, this paper will compare the M1 and M2 models to assess the effectiveness of the XGBoost screening indicators.
The average value of 50 experiments is taken as the final result to eliminate the influence of sample randomness on model performance. The comparison of the evaluation indexes of each model in the test set is shown in Figure 4, and the specific values of each evaluation index are shown in Table 9.
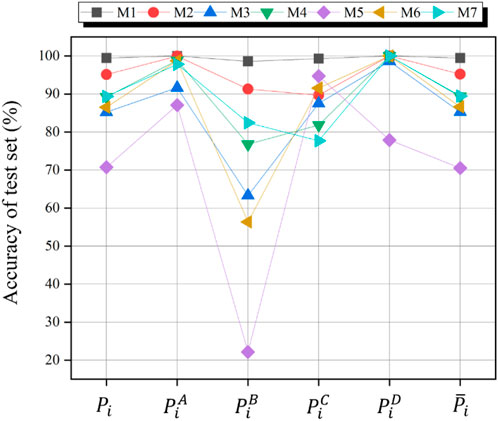
FIGURE 4. Comparison of the effectiveness of the indicators assessed by the models.
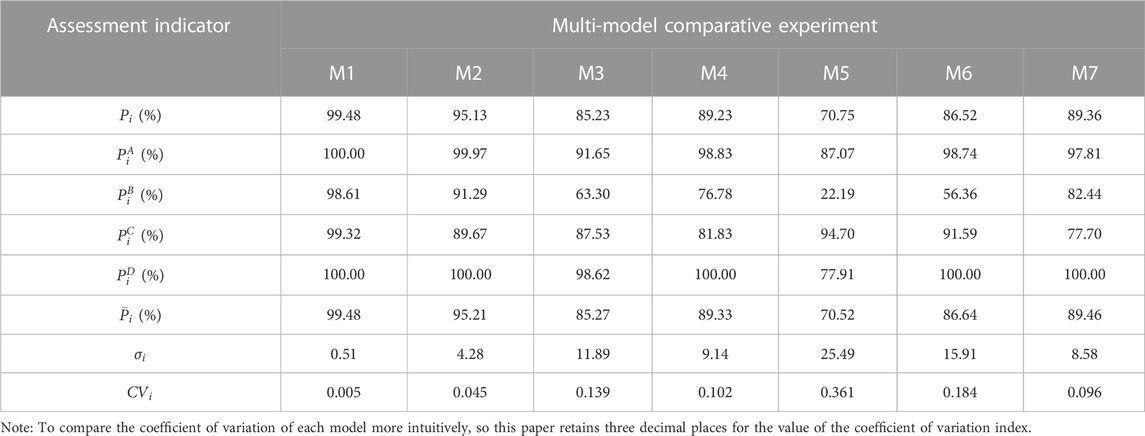
TABLE 9. Specific values for each model assessment indicator.
From Figure 4 and Table 9, we can conclude that: First, the accuracy of the model. In descending order of the average level of enterprise recognition rate
Furthermore, Table 9 reveals that the average sample identification rate (
In summary, this paper conducts a comprehensive analysis of enterprise carbon emission reduction credit risk, encompassing comprehensive scoring, cluster analysis, indicator screening, class classification, classification prediction, and multi-model comparison. The high accuracy of the MLP model presented in this paper can be attributed to three key factors: firstly, the utilization of the FA-TOPSIS model for comprehensive scoring and the fine-grained risk class division achieved through clustering, which aids the model in better recognizing the training data; secondly, the indicator screening process assisted by the XGBoost algorithm, which excludes less impactful credit indicators, effectively preventing model overfitting; thirdly, treating enterprise carbon emission reduction credit risk data as imbalanced samples and introducing the ADASYN oversampling algorithm to address category imbalance, ultimately enhancing the model’s prediction accuracy.
Research on enterprise carbon emission reduction credit risk has predominantly focused on risk level measurement and rating. However, there is a notable gap in terms of intelligent risk level prediction and addressing the issue of imbalanced data samples in this context. To address this gap, this paper takes a dataset comprising carbon emission reduction data from 2,555 listed enterprises spanning the years 2007–2020 as its research foundation. It constructs an early warning model for enterprise carbon emission reduction credit risk based on Multi layer perception (MLP). This research approach is multifaceted. Firstly, the paper employs the FA-TOPSIS model to conduct a comprehensive evaluation of carbon emission reduction credit risk in enterprises. Subsequently, it combines the K-means clustering algorithm with the MLP model to facilitate unsupervised and supervised learning. This, in turn, enables intelligent prediction of the enterprise’s credit risk level. Following this, the XGBoost algorithm is applied to screen and eliminate carbon emission reduction indicators that have minimal influence on prediction outcomes. Additionally, the ADASYN oversampling algorithm is employed to address the issue of class imbalance within enterprise categories, thereby enhancing the predictive accuracy of the model. This study not only contributes practical insights and novel research directions to the field of enterprise carbon emission reduction credit risk early warning but also provides fresh perspectives for stakeholders seeking to maximize the protection of their investment capital returns.
The main research conclusions are as follows:
First, this paper employs the FA-TOPSIS model to evaluate the carbon emission reduction credit risk of enterprises. It utilizes the K-means clustering method with the Euclidean distance as a criterion to calculate the composite score Gi for each enterprise. When examining different industries, it is evident that the pharmaceutical manufacturing industry (Hapley, 2011) and the oil and gas extraction sector (CNPC, 2012; CNPC, 2013) have lower carbon emission reduction credit risks. Conversely, the specialized equipment manufacturing industry of China Railway Industry (2017) and the non-metallic mineral products industry of Jiangnan Red Arrow (2014) exhibit higher carbon emission reduction credit risks. From an industry perspective, the oil and gas extraction sector demonstrates lower carbon emission reduction credit risks, while the electricity and heat generation and supply industry exhibit higher risks. Consequently, supporting low-carbon industries and implementing stricter regulations on high-carbon enterprises are essential not only for transitioning towards a low-carbon economy but also for preventing potential investment losses for stakeholders, including investors, banks, and government entities. Incorrectly assessing enterprise credit risk could lead to financial repercussions for these stakeholders.
Second, it is crucial to recognize that the indicators exhibit varying degrees of influence on the carbon emission reduction credit risk of enterprises. To elaborate, before K-Means clustering, carbon emission reduction intensity, governance structure, and innovation capability emerge as the pivotal factors impacting enterprise carbon emission reduction credit risk. Post K-Means clustering, profitability, governance structure, and operational capacity take precedence as the primary determinants of enterprise carbon emission reduction credit risk. Therefore, whether before or after clustering, the governance structure indicator consistently retains its significance in influencing corporate carbon emission reduction credit risk. Consequently, it underscores the necessity of reinforcing governance structure regulations. This entails that enterprises should develop more transparent and effective strategies for carbon reduction. Additionally, there should be a clear assignment of responsibility at the senior management level for achieving carbon reduction targets. Encouraging enterprises to establish independent environmental, social, and governance (ESG) committees to oversee sustainability-related matters becomes imperative.
Third, this paper incorporates the XGBoost algorithm to assess credit risk indicators, a step that significantly enhances the predictive accuracy of the model presented herein. Specifically, concerning the average enterprise identification rate, the model subjected to screening with the XGBoost algorithm attains an impressive 99.48%. In stark contrast, the model without indicator screening achieves a notably lower rate of 95.21%. This screening process thereby bolsters the accuracy rate by an appreciable 4.27%. Consequently, in scenarios where the constructed indicator system becomes overly extensive, it becomes judicious to employ the XGBoost algorithm to eliminate indicators with higher feature contributions. This measure serves the dual purpose of averting model overfitting and associated issues.
Fourth, the MLP model developed in this paper excels in the classification prediction task and holds substantial practical applicability. Notably, the MLP model attains a remarkable prediction accuracy of 99.48%, marking an average improvement of 15.24% in comparison to other benchmark models. Consequently, investors and banks can confidently utilize this model for grading and forecasting an enterprise’s carbon emission reduction credit risk, aiding them in assessing the enterprise’s suitability for investment.
Fifthly, the model presented in this paper holds promising applications in the realm of early corporate carbon emission reduction credit risk assessment, offering enterprises enhanced insights into and management strategies for such risks while delivering valuable reference data. Furthermore, we suggest the incorporation of qualitative and unstructured indicators, including industry attributes, board member characteristics, and management discussion and analysis text in the annual report, into the assessment framework for a more comprehensive evaluation of enterprise carbon emission reduction performance and an improved model accuracy. At the same time, in today’s big data era, we should pay more attention to the application of digital technology in enterprise innovation, performance evaluation and other aspects, and provide more possibilities for future in-depth research to promote the development of enterprises in a more sustainable direction (Yin and Yu, 2022).
Based on the findings of this paper, the following recommendations are made:
First, financial institutions should prioritize industries with high energy consumption and emissions, while simultaneously enhancing the enterprise carbon emission reduction credit rating system. With the acceleration of global economic integration, these industries confront substantial challenges in balancing economic and ecological considerations. Take, for instance, the oil and gas extraction sector, a classic high-energy-consuming industry heavily reliant on traditional carbon-based energy sources. Faced with mounting pressure to curtail carbon emissions, this sector must proactively transition towards carbon reduction to align with the evolving economic landscape. Hence, it becomes imperative for financial institutions and governmental bodies to establish comprehensive and standardized criteria for enterprise credit evaluation. This ensures the seamless integration of credit data and effectively addresses financing hurdles, thereby fostering sustainable development within these industries.
Second, in the process of evaluating the credit risk associated with carbon emission reduction in enterprises, financial institutions should conduct a comprehensive examination of the enterprise’s governance structure. Beyond the traditional financial analysis, it is essential for financial institutions to delve deeply into the management aspects of the enterprise. This entails a meticulous evaluation of critical factors such as the company’s workforce size, compensation framework, executive qualifications, and shareholding distribution. Such an approach is pivotal in constructing a comprehensive and scientifically grounded credit assessment framework for enterprise carbon emission reduction. For instance, the educational background and experience of the executive team can offer insights into the enterprise’s readiness for a low-carbon transition. Similarly, the size of the workforce and the compensation structure can significantly impact the implementation of carbon emission reduction policies among employees. Additionally, the percentage of shareholding may reflect the commitment of senior management to the enterprise’s long-term sustainability. Hence, gaining an in-depth understanding of an enterprise’s governance structure represents a crucial step in ensuring a holistic and precise evaluation of carbon emission reduction credit, thereby aiding financial institutions in more effectively managing carbon emission reduction risks.
Third, enterprises themselves should intensify their attention to carbon intensity and innovation capacity while closely managing the interplay between corporate innovation and carbon emission reduction credit risk. This imperative is particularly pronounced within high-energy consumption and high-emission industries, where companies must commit to product and technological innovation to facilitate a successful transition towards a low-carbon paradigm. However, these innovation endeavors typically necessitate substantial financial resources, often drawn from a company’s working capital. If not exercised judiciously, this can potentially impact the firm’s financial stability. Therefore, while actively promoting innovation and invigorating operational vitality, enterprises should prudently regulate their resource allocations to ensure the uninterrupted continuity of their production and operational activities. This strategic approach aids in striking a harmonious equilibrium between economic and ecological gains.
Fourth, there is a strong recommendation for banks and governments to diligently incorporate Environmental, Social, and Corporate Governance (ESG) criteria into their risk management protocols, investment strategies, and strategic planning. Furthermore, they should harness the potential of artificial intelligence technology for early credit risk detection. While China’s ESG evaluation system has been relatively nascent and its full impact remains to be seen, ESG adheres to the principles of environmental responsibility, social consciousness, and effective corporate governance, making it a potent deterrent against environmental and social risks. By introducing ESG factors and quantifying their influence on corporate credit risk, financial institutions can significantly bolster the development of sustainable financing. Concurrently, financial institutions should actively delve into deep learning models, such as the Multi layer perception (MLP) model utilized in this study, to elevate the precision of credit risk assessment models. This endeavor will pave the way for intelligent classification of corporate carbon emission reduction credit risk levels and further fortify the reliability of investment decisions.
Publicly available datasets were analyzed in this study. This data can be found here: https://www.gtarsc.com/.
ZL: Conceptualization, Data curation, Formal Analysis, Methodology, Project administration, Software, Writing–original draft. XC: Funding acquisition, Investigation, Resources, Supervision, Writing–review and editing.
The author(s) declare financial support was received for the research, authorship, and/or publication of this article. This research was funded by the National Social Science Fund of China (Grant No. 13BJY057).
The authors declare that the research was conducted in the absence of any commercial or financial relationships that could be construed as a potential conflict of interest.
All claims expressed in this article are solely those of the authors and do not necessarily represent those of their affiliated organizations, or those of the publisher, the editors and the reviewers. Any product that may be evaluated in this article, or claim that may be made by its manufacturer, is not guaranteed or endorsed by the publisher.
Abbasi, W. A., Wang, Z., Zhou, Y., and Hassan, S. (2019). Research on measurement of supply chain finance credit risk based on Internet of Things. Int. J. Distributed Sens. Netw. 15 (9), 155014771987400. doi:10.1177/1550147719874002
Abdulsaleh, A. M., and Worthington, A. C. (2013). Small and medium-sized enterprises financing: a review of literature. Int. J. Bus. Manag. 8 (14), 36. doi:10.5539/ijbm.v8n14p36
Alin, A. (2010). Multicollinearity. Wiley Interdiscip. Rev. Comput. Stat. 2 (3), 370–374. doi:10.1002/wics.84
Baesens, B., Setiono, R., Mues, C., and Vanthienen, J. (2003). Using neural network rule extraction and decision tables for credit-risk evaluation. Manag. Sci. 49 (3), 312–329. doi:10.1287/mnsc.49.3.312.12739
Cai, X., Qian, Y., Bai, Q., and Liu, W. (2020). Exploration on the financing risks of enterprise supply chain using Back Propagation neural network. J. Comput. Appl. Math. 367, 112457. doi:10.1016/j.cam.2019.112457
Carling, K., Jacobson, T., Lindé, J., and Roszbach, K. (2007). Corporate credit risk modeling and the macroeconomy. J. Bank. finance 31 (3), 845–868. doi:10.1016/j.jbankfin.2006.06.012
Chen, X., and Chen, Z. (2021). Can green finance development reduce carbon emissions? Empirical evidence from 30 Chinese provinces. Sustainability 13 (21), 12137. doi:10.3390/su132112137
Cheng, M., and Han, D. (2023). “A K-means algorithm for construction of enterprise innovation system based on data mining technology,” in 2023 International Conference on Networking, Informatics and Computing (ICNETIC), Palermo, Italy, May 29 2023 to May 31 2023 (IEEE), 783–787.
Ding, X., Ren, Y., Tan, W., and Wu, H. (2023). Does carbon emission of firms matter for Bank loans decision? Evidence from China. Int. Rev. Financial Analysis 86, 102556. doi:10.1016/j.irfa.2023.102556
Gan, X., Fernandez, I. C., Guo, J., Wilson, M., Zhao, Y., Zhou, B., et al. (2017). When to use what: methods for weighting and aggregating sustainability indicators. Ecol. Indic. 81, 491–502. doi:10.1016/j.ecolind.2017.05.068
Greco, S., Ishizaka, A., Tasiou, M., and Torrisi, G. (2019). On the methodological framework of composite indices: a review of the issues of weighting, aggregation, and robustness. Soc. Indic. Res. 141, 61–94. doi:10.1007/s11205-017-1832-9
He, H., Bai, Y., and Garcia, E. A. (2008). “ADASYN: adaptive synthetic sampling approach for imbalanced learning[C],” in 2008 IEEE international joint conference on neural networks (IEEE world congress on computational intelligence), Hong Kong, 01-08 June 2008 (IEEE), 1322–1328.
Jiang, H. D., Purohit, P., Liang, Q. M., Dong, K., and Liu, L. J. (2022). The cost-benefit comparisons of China's and India's NDCs based on carbon marginal abatement cost curves. Energy Econ. 109, 105946. doi:10.1016/j.eneco.2022.105946
Jiang, H. D., Purohit, P., Liang, Q. M., Liu, L. J., and Zhang, Y. F. (2023). Improving the regional deployment of carbon mitigation efforts by incorporating air-quality co-benefits: a multi-provincial analysis of China. Ecol. Econ. 204, 107675. doi:10.1016/j.ecolecon.2022.107675
Li, H., Liu, H., and Hu, Y. (2022a). Prediction of unbalanced financial risk based on GRA-TOPSIS and SMOTE-CNN. Sci. Program. 2022, 1–13. doi:10.1155/2022/8074516
Li, Y., Stasinakis, C., and Yeo, W. M. (2022b). A hybrid XGBoost-MLP model for credit risk assessment on digital supply chain finance. Forecasting 4 (1), 184–207. doi:10.3390/forecast4010011
Lian, Z., Su, Z., and Zheng, T. (2021). “Analysis and research on credit risk factors of listed companies in China based on CVM-MLP,” in 2021 3rd International Conference on Machine Learning, Big Data and Business Intelligence (MLBDBI), Taiyuan, China, 03-05 December 2021 (IEEE), 542–547.
Likas, A., Vlassis, N., and Verbeek, J. J. (2003). The global k-means clustering algorithm. Pattern Recognit. 36 (2), 451–461. doi:10.1016/s0031-3203(02)00060-2
Lin, B., and Bai, R. (2022). Machine learning approaches for explaining determinants of the debt financing in heavy-polluting enterprises. Finance Res. Lett. 44, 102094. doi:10.1016/j.frl.2021.102094
Liu, L. (2022). A self-learning bp neural network assessment algorithm for credit risk of commercial bank. Wirel. Commun. Mob. Comput. 2022, 1–10. doi:10.1155/2022/9650934
Luo, J., Yan, X., and Tian, Y. (2020). Unsupervised quadratic surface support vector machine with application to credit risk assessment. Eur. J. Operational Res. 280 (3), 1008–1017. doi:10.1016/j.ejor.2019.08.010
Ni, D., Lim, M. K., Li, X., Qu, Y., and Yang, M. (2023). Monitoring corporate credit risk with multiple data sources. Industrial Manag. Data Syst. 123 (2), 434–450. doi:10.1108/imds-02-2022-0091
Olson, D. L. (2004). Comparison of weights in TOPSIS models. Math. Comput. Model. 40 (7-8), 721–727. doi:10.1016/j.mcm.2004.10.003
Razzaq, A., Sharif, A., Ozturk, I., and Yang, X. (2023). Central inspections of environmental protection and transition for low-carbon Chinese cities: policy intervention and mechanism analysis. Energy Econ. 124, 106859. doi:10.1016/j.eneco.2023.106859
Rossi, F., and Conan-Guez, B. (2005). Functional multi-layer perceptron: a non-linear tool for functional data analysis. Neural Netw. 18 (1), 45–60. doi:10.1016/j.neunet.2004.07.001
Sun, C., and Zeng, Y. (2023). Does the green credit policy affect the carbon emissions of heavily polluting enterprises? Energy Policy 180, 113679. doi:10.1016/j.enpol.2023.113679
Wan, J., and Yu, B. (2023). Early warning of enterprise financial risk based on improved BP neural network model in low-carbon economy. Front. Energy Res. 10, 1087526. doi:10.3389/fenrg.2022.1087526
Wang, L., and Zhang, W. (2023). A qualitatively analyzable two-stage ensemble model based on machine learning for credit risk early warning: evidence from Chinese manufacturing companies. Inf. Process. Manag. 60 (3), 103267. doi:10.1016/j.ipm.2023.103267
Wu, Y., and Huang, S. (2022). The effects of digital finance and financial constraint on financial performance: firm-level evidence from China's new energy enterprises. Energy Econ. 112, 106158. doi:10.1016/j.eneco.2022.106158
Wu, Y., Li, X., Liu, Q., and Tong, G. (2021). The analysis of credit risks in agricultural supply chain finance assessment model based on genetic algorithm and backpropagation neural network. Comput. Econ. 60, 1269–1292. doi:10.1007/s10614-021-10137-2
Xia, Y., Xu, T., Wei, M. X., Wei, Z. K., and Tang, L. J. (2023). Predicting chain’s manufacturing SME credit risk in supply chain finance based on machine learning methods. Sustainability 15 (2), 1087. doi:10.3390/su15021087
Xie, X., Shi, X., Gu, J., and Xu, X. (2023). Examining the contagion effect of credit risk in a supply chain under trade credit and bank loan offering. Omega 115, 102751. doi:10.1016/j.omega.2022.102751
Xuan, D., Ma, X., and Shang, Y. (2020). Can China’s policy of carbon emission trading promote carbon emission reduction? J. Clean. Prod. 270, 122383. doi:10.1016/j.jclepro.2020.122383
Xue, M., Razzaq, A., Afshan, S., and Yang, X. (2023). Fiscal pressure and carbon intensity: a quasi-natural experiment based on education authority reform. Energy Econ. 126, 106919. doi:10.1016/j.eneco.2023.106919
Yadi, L. I. U., Yuning, S., Jiayue, Y. U., Yingfa, X., Yiyuan, W., and Xiaoping, Z. (2019). Big-data-driven model construction and empirical analysis of SMEs credit assessment in China. Procedia Comput. Sci. 147, 613–619. doi:10.1016/j.procs.2019.01.205
Yin, S., and Li, B. (2018). A stochastic differential game of low carbon technology sharing in collaborative innovation system of superior enterprises and inferior enterprises under uncertain environment. Open Math. 16 (1), 607–622. doi:10.1515/math-2018-0056
Yin, S., Wang, Y., and Xu, J. (2022). Developing a conceptual partner matching framework for digital green innovation of agricultural high-end equipment manufacturing system toward agriculture 5.0: a Novel Niche Field Model Combined with Fuzzy VIKOR. Front. Psychol. 13, 924109. doi:10.3389/fpsyg.2022.924109
Yin, S., and Yu, Y. (2022). An adoption-implementation framework of digital green knowledge to improve the performance of digital green innovation practices for industry 5.0. J. Clean. Prod. 363, 132608. doi:10.1016/j.jclepro.2022.132608
Yu, Y., Yin, S., and Zhang, A. (2022). Clean energy-based rural low carbon transformation considering the supply and demand of new energy under government participation: a three-participators game model. Energy Rep. 8, 12011–12025. doi:10.1016/j.egyr.2022.09.037
Yuan, H., Lau, R. Y. K., and Wong, M. C. S. (2018). “Mining emotions of the public from social media for enhancing corporate credit rating,” in 2018 IEEE 15th International Conference on e-Business Engineering (ICEBE), Xi'an, China, 12-14 October 2018 (IEEE), 25–30.
Zhang, A., Deng, R., and Wu, Y. (2022a). Does the green credit policy reduce the carbon emission intensity of heavily polluting industries? Evidence from China's industrial sectors. J. Environ. Manag. 311, 114815. doi:10.1016/j.jenvman.2022.114815
Zhang, W., Yan, S., Li, J., Tian, X., and Yoshida, T. (2022b). Credit risk prediction of SMEs in supply chain finance by fusing demographic and behavioral data. Transp. Res. Part E Logist. Transp. Rev. 158, 102611. doi:10.1016/j.tre.2022.102611
Keywords: carbon emission reduction credit risk, fa, TOPSIS, K-means, MLP
Citation: Long Z and Chen X (2023) Early warning research on enterprise carbon emission reduction credit risk based on deep learning model under unbalanced data. Front. Energy Res. 11:1274425. doi: 10.3389/fenrg.2023.1274425
Received: 08 August 2023; Accepted: 16 November 2023;
Published: 28 November 2023.
Edited by:
Hailong Li, Central South University, ChinaReviewed by:
Najabat Ali, Soochow University, ChinaCopyright © 2023 Long and Chen. This is an open-access article distributed under the terms of the Creative Commons Attribution License (CC BY). The use, distribution or reproduction in other forums is permitted, provided the original author(s) and the copyright owner(s) are credited and that the original publication in this journal is cited, in accordance with accepted academic practice. No use, distribution or reproduction is permitted which does not comply with these terms.
*Correspondence: Zhi Long, MjIwMTE1MDIwMDNAbWFpbC5obnVzdC5lZHUuY24=
Disclaimer: All claims expressed in this article are solely those of the authors and do not necessarily represent those of their affiliated organizations, or those of the publisher, the editors and the reviewers. Any product that may be evaluated in this article or claim that may be made by its manufacturer is not guaranteed or endorsed by the publisher.
Research integrity at Frontiers
Learn more about the work of our research integrity team to safeguard the quality of each article we publish.