 Chenxuan Xu1,2
 Tianhan Zhang
 Hongfei Yu
- 1Power China Huadong Engineering Corporation Limited, Hangzhou, China
- 2College of Electrical Engineering, Zhejiang University, Hangzhou, China
Inspired from sharing economy and advanced energy storage technologies, hybrid shared energy storage (HSES), as an innovative business model, can provide flexible storage leasing services to new energy stations (NESs) and bring additional profits to the energy storage owner. Under this business model, pricing and planning issues are the main focus of the HSES operator to increase revenues but are rarely considered in current studies. Therefore, a Stackelberg game-based three-stage optimal pricing and planning strategy of HSES is formulated for the operator. First, an HSES model considering two leasing options is developed to provide two kinds of short-term use rights of energy storage resources for NESs. Then, the interactions between selfish NESs and the HSES operator are characterized as a Stackelberg game, and a bi-level pricing and planning strategy optimization model is developed to help the HSES operator make optimal decisions. Finally, considering different characteristics in each stage of the Stackelberg game, a three-stage solution method based on the genetic algorithm (GA) and mixed-integer linear programming (MILP) models is proposed to solve the optimization problem. Case studies on six NESs in a certain region are taken to verify the effectiveness of the proposed strategy. Simulation results show that the HSES operator can obtain maximum profit under the proposed pricing and planning strategy. In addition, the proposed HSES leasing model can provide additional benefits to both the operator and NESs.
1 Introduction
Driven by energy transition and the decarbonization goal, new energy sources such as photovoltaic and wind power have developed rapidly in the last decade, and the high penetration of new energy sources will be the typical characteristics of future power systems (Liu et al., 2021a; Zhang et al., 2022a). Therefore, new energy generators will gradually replace conventional units, and new energy stations (NESs) will become the major players in the electricity market (Yang et al., 2021; Ma et al., 2022). However, due to the intermittency, volatility, and uncertainty of wind power and photovoltaic power, the deviation assessment mechanism of the energy market introduces deviation penalties for NESs, and there exists the problem of wind and photovoltaic curtailment (Ahmed et al., 2020; Zhang and Qi, 2020).
Energy storage, as one of the crucial flexible regulation resources, shows great advantages in mitigating the fluctuations of new energy output and supporting the grid connection of new energy sources (Kebede et al., 2022; Yang et al., 2022). For NESs, the utilization of energy storage resources can help cope with output fluctuations, mitigate energy deviation penalty, improve the consumption rate of new energy, realize price arbitrage, and obtain additional market revenue (Liu et al., 2020). Nevertheless, the high construction and maintenance costs of energy storage devices usually bring high financial risks to NESs (Rahman et al., 2020). In addition, the traditional single-user single-storage investment and operation mode results in low equipment utilization rate and poor economic efficiency (Sun et al., 2019), which restrict the large-scale commercial application of energy storage in power systems.
To address the aforementioned issues, the concept of shared energy storage (SES) is proposed with the development of sharing economy and Internet of Things technology. The superiority of the SES business model is mainly reflected in the following aspects. For energy storage owners, the sharing of idle energy storage resources can help improve the equipment utilization rate and shorten the cost recovery cycle (Wang et al., 2018; Kong et al., 2023). For energy storage demanders, SES can provide a lower barrier for obtaining the use rights of energy storage resources without great financial pressure to participate in energy-sharing and obtain additional benefits (Zhang et al., 2022b).
From the perspective of the sharing mode, current research about SES can be classified into three categories, i.e., the co-construction sharing mode, the interconnected sharing mode, and the energy storage operator leasing mode. Under the first sharing mode, multiple subjects cooperate as an alliance to invest and utilize a large energy storage system jointly (Chen et al., 2022). Du et al. (2022) and Li et al. (2021) proposed joint planning strategies for SES systems among multiple micro-grids to obtain maximum profits during the planning period. Li et al. (2022) proposed an energy storage sharing scheme among prosumers and established an optimal SES planning model for higher energy market revenue. Liu et al. (2021b) analyzed the benefit of the SES for several electricity retailers in the forward electricity market and formulated an optimal joint planning strategy to minimize the electricity purchase costs of retailers. The economic benefits of SES in the residential community were thoroughly analyzed by Walker and Kwon. (2021), and co-construction SES strategies for residential communities and industrial parks were studied by Xie et al. (2022) and Long et al. (2022). Even though the co-construction sharing mode of energy storage can help each cooperator reduce the investment risks and bring complementarity benefits, the ownership of SES belongs to all cooperators, thus leading to problems in the allocation of cooperation cost/profit and the coordination of energy storage use rights. In practice, complex relationships among cooperators make this type of sharing mode difficult to be implemented. Under the second sharing mode, the distributed energy storage resources existing within different subjects are interconnected to enable mutual access. Zheng et al. (2022) and Zhang et al. (2022c) utilized the distributed energy storage systems of each residential user and wind power generator as the medium for energy sharing. Cao et al. (2021) investigated energy interaction strategies between multiple micro-grids to achieve energy complementarity with the help of energy storage resources inside the micro-grids. However, the premise of interconnected sharing requires each participant to have independently configured energy storage equipment, i.e., the ability of bidirectional energy transfer, and is more suitable for those subjects who have already installed distributed energy storage systems. In other words, this type of sharing mode shows great limitations in practice.
Different from the first two modes, the operator leasing mode of SES is more flexible in practice. Under this mode, demanders can flexibly obtain the use rights of energy storage resources according to their short-term demands from an independent SES aggregator under clear leasing rules, without considering the negotiation and coordination challenges that need to be encountered in the cooperation. Liu et al. (2017) first proposed the concept of cloud energy storage to provide virtual use rights of energy storage resources for demand-side users, which is one of the forms of this leasing mode. However, the pricing problem was not discussed. Zhang et al. (2023) set SES leasing prices based on real-time electricity prices, but the profit of the SES operator was ignored. Gong et al. (2022) divided the use rights of SES into energy use rights and power use rights for leasing, but the rationality needs to be further explored. Brijs et al. (2016) proposed a novel pricing strategy of SES through competitive bidding, but the model is too complex to be promoted and applied in the actual leasing market.
All the aforementioned research works have made great contributions to the application and promotion of SES, but there are still some limitations and research gaps that need to be considered. First, the leasing models of SES, in the majority of existing studies, are developed based on a single time scale and a single type of energy storage, and the superiority of hybrid energy storage and the coordination between different leasing time scales are ignored. In fact, coordination between multiple types of energy storage (i.e., hybrid energy storage) and the diversity of leasing time scales can bring additional benefits to both the operator and demanders. Second, most studies did not develop pricing strategies from the perspective of the energy storage owner and did not analyze the rationality of leasing prices in detail. For the operator, deciding the leasing price based on demand is the key to enhancing its own revenue, and thus the rationality of the pricing strategy should be well-concerned. Third, most of the existing works about the pricing strategy ignored the planning problem, which is also a main focus of investors. Therefore, developing a planning strategy based on leasing requirements along with the pricing strategy is also an urgent issue that needs to be addressed by the operator.
Given this background, a Stackelberg game-based three-stage optimal pricing and planning strategy of the hybrid shared energy storage (HSES) is proposed in this work to address the aforementioned issues for the operator, and the main contributions are summarized as follows.
1) An HSES model considering two leasing options is first developed to provide two kinds of short-term use rights of energy storage resources for NESs on different time scales. Compared with the commonly used daily leasing model, the proposed model is more flexible and can provide additional benefits to both the provider and demanders.
2) A novel Stackelberg game-based HSES pricing and planning strategy is formulated on the basis of the bi-level optimization model to help the HSES operator make optimal decisions. In this model, the preferences and selfishness of both the “leader” operator and “followers” NESs are well-considered and balanced.
3) A three-stage optimization solution approach based on genetic algorithm and mixed-integer linear programming (MILP) models is proposed to efficiently solve the bi-level optimization problem.
The rest of this paper is organized as follows. First, the sharing model of HSES and the interaction model between HSES and NESs are elaborated upon in Section 2. On this basis, a Stackelberg game-based bi-level pricing and planning optimization model is proposed for the HSES operator in Section 3. Then, a three-state optimization-based solution method is introduced to solve the bi-level problem in Section 4. Finally, case studies are carried out in Section 5, and the conclusions are summarized in Section 6.
2 Model formulation of hybrid shared energy storage
2.1 The sharing model of a hybrid energy storage system
In this work, HSES is invested and maintained by the energy storage operator, providing leasing services to energy storage demanders, i.e., NESs. The sharing model of the proposed HSES system is presented in Figure 1.
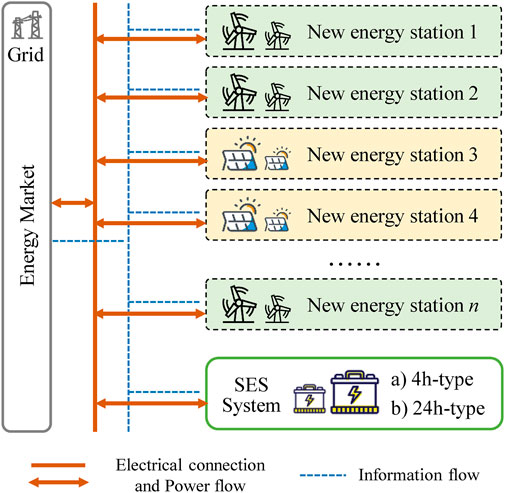
FIGURE 1. Sharing model of the proposed HSES.
As shown in Figure 1, NESs can obtain the use rights of energy storage resources from the operator through leasing. During the leasing period, NESs are allowed to freely dispatch the energy storage within the physical constraints to mitigate energy deviations and achieve price arbitrage in the energy market.
Due to the large variety of energy storage technologies with different properties, hybrid energy storage will become an essential means to meet the diversified and flexible demands of future power systems (Hajiaghasi et al., 2019). Therefore, as shown in Figure 1, based on the single-type SES system with a daily leasing period, an additional short-term energy storage leasing option with a leasing period of 4 h is introduced in this work so as to provide more diversified choices for the NESs of wind power and photovoltaic. The two types of SES models are introduced as follows:
1) 24 h-type daily SES (D-SES): D-SES is the dominant form of the current SES, i.e., the SES providing leasing services on a 24-h cycle. NESs make day-ahead decisions for their energy storage using demands in the following 24 h based on day-ahead market prices and forecasts of new energy generation. They submit their energy storage leasing requirements for the next day to the operator to obtain the use rights of energy storage and bid in the day-ahead energy market. Then, in the real-time market, NESs can freely dispatch the leased D-SES within physical constraints to address the uncertainty and fluctuations in new energy generation, thereby reducing penalties from energy market deviation assessment. Additionally, the NESs can leverage the right to use the leased D-SES to capitalize on price differentials in the energy market and achieve greater market revenues. It is worth mentioning that, considering practical usage requirements, D-SES systems typically employ energy storage units with a low power-to-capacity ratio. Therefore, the lithium-ion energy storage system with 0.5 C is employed in this work.
2) 4 h-type hourly SES (H-SES): Considering the volatility and intermittency of new energy generation, leasing D-SES may not be the most economical option for some NESs. To address this issue, the H-SES with a leasing cycle of 4 h is further utilized in this work, providing NESs with more flexible choices. Thus, NESs can evaluate the benefits of leasing D-SES and H-SES and then formulate the optimal leasing strategy. In this way, NESs can lease H-SES or D-SES independently, and they can also choose to lease D-SES and utilize H-SES to compensate for the lack of flexibility resources during certain time periods. Since the H-SES with a 4-h leasing cycle is typically taken to handle short-term output fluctuations, the requirement for energy storage duration is relatively small. Therefore, the lithium-ion energy storage system with 2 C is utilized in this work.
2.2 Interaction model between HSES and NESs
As mentioned in Section 2.1, NESs can obtain the use rights of energy storage from the HSES operator. During the leasing period, NESs can charge and discharge the leased energy storage within the leasing capacity limits. However, due to physical constraints, such as geographical location and power transmission, NESs cannot directly access the physical energy storage devices. Therefore, in this work, the use rights obtained by NESs are virtual use rights of the energy storage, while the actual dispatch control rights of the energy storage devices remain with the HSES operator.
The HSES operator determines the centralized hybrid energy storage system’s actual charging and discharging decisions based on the aggregated demand from all NESs. Additionally, under this business model, the HSES operator acts as an agent on behalf of the NESs in market settlements. In other words, the operator participates in the energy market after aggregating all the NESs that have leased energy storage as a whole and pays the agent electricity revenue to NESs based on the market rules and the day-ahead energy market bids and real-time scheduling decisions declared by the NESs. The interactions between HSES, NESs, and the grid are illustrated in Figure 2.
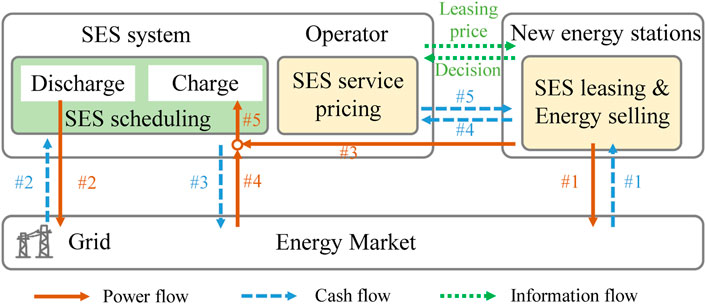
FIGURE 2. Interactions between the operator and NESs under the proposed HSES model.
2.2.1 New energy stations
Upon receiving information about energy market prices and HSES leasing prices, NESs make day-ahead decisions on the HSES capacities to be leased and the energy bids in the energy market. Subsequently, based on the actual output of new energy during intraday operations, they make decisions on the real-time energy base points and energy storage dispatch demands. As shown in Figure 2, NESs submit the information of all decisions to the HSES operator via an information flow, and the operator acts on their behalf to participate in the energy market. Energy flow #3 represents the actual power generation of NESs, which is measured directly by smart meters and is integrated by the operator to participate in the energy market. Under this model, the operator can utilize Energy flow #3 for charging (i.e., Energy flow #3 → #5) or for selling (i.e., Energy flow #3 → #1). Since NESs entrust the HSES operator to participate in the market settlement, the net profits from the energy market are paid to NESs by the HSES operator, which is represented as Cash flow #5. The HSES leasing fee of NESs is represented by Cash flow #4.
2.2.2 HSES operator
The HSES operator owns independent energy storage systems and presets the leasing price of the HSES for NESs. Cash flow #3 represents the leasing revenue, which is the primary profit source of the HSES operator. Energy flows #1 and #2 represent the energy interchange between the operator and the power grid. Correspondingly, Cash flows #1 and #2 represent the energy-selling profit and the energy-purchasing cost, respectively. As the HSES operator represents NESs in the dispatch of energy storage and participates in energy market transactions, the complementary effects of the charging and discharging needs of various types of NESs bring additional revenue. Based on the charging and discharging decisions of the NESs, the operator collects the information of all stations and acts on behalf of the stations in market bidding. Hence, Cash flow #4 represents the net profit that needs to be paid to the NESs based on their decisions. Cash flow #5 represents the energy deviation penalty of the HSES operator.
It is noteworthy that both the HSES operator and the NESs implement the same market policies. The determination of the HSES leasing prices and capacities for the operator and the management of the HSES in a manner that renders profitability for both the operator and the NESs are the primary focal points of this work.
2.3 Objectives of the HSES operator and NESs
2.3.1 New energy stations
Each NES aims to maximize its daily net profit, which is the difference between the net revenue from the energy market and the cost of leasing HSES. To this end, NESs need to establish a rational HSES leasing strategy and energy market bidding strategy in the day-ahead phase, based on the HSES operator’s leasing prices, forecasted energy market prices, and the anticipated output from new energy to maximize their expected returns.
2.3.2 HSES operator
The operator’s objective is to maximize the total lifecycle revenue of HSES, which is the difference between leasing revenue and agency benefits, minus the costs of energy storage construction, operation, and maintenance. To this end, it is urgent for the operator to establish reasonable leasing prices in response to the demand changes from the NESs and subsequently optimize the energy storage dispatch strategy to make capacity planning decisions. The operator’s profit includes revenue from leasing virtual energy storage use rights to NESs and income from acting as an agent for NESs in energy trading. The costs include payments to the grid for energy purchases, deviation penalty costs, and energy storage investment and maintenance costs.
3 Stackelberg game-based bi-level pricing and planning optimization model of HSES
The study presented in this work involves two groups pursuing different objectives: The NESs prefer lower HSES leasing prices in order to lease more energy storage use rights and store more energy during non-peak periods for use during peak periods, thereby securing more arbitrage profits. In contrast, the HSES operator prefers higher leasing prices in order to generate greater revenue from NESs. Consequently, these two groups have conflicting interests in the HSES leasing price setting, which can be resolved through a Stackelberg game. Therefore, a bi-level optimization model is utilized to capture the Stackelberg game problem between the selfish operator and NESs.
The objective of the upper-level optimization problem is to maximize the earnings of the leader in the game, specifically the annualized profit of the HSES operator. The upper-level leader determines the leasing prices for the use rights of energy storage and announces the information to the lower-level followers. Similarly, the objective of the lower-level optimization problem is to maximize the earnings of each follower, specifically the net profits from the energy market for the NESs. The lower-level followers make decisions on the leasing strategy and the operation strategy based on the price signal transmitted from the upper level and then feed the optimization results back to the upper level. In response, the upper-level leader schedules the centralized energy storage and decides on the construction capacity for the HSES based on the feedback information from the lower-level followers. The interaction of information between the upper and lower levels in this bi-level optimization model is presented in Figure 3.

FIGURE 3. Interactions between the two levels of the optimization model.
3.1 Lower-level model: maximizing the net profit of an NES
The goal of the market operation model for NESs at the lower level is to maximize the net profit for each NES over the dispatch period. The decision variables comprise two parts: the first part is related to the leasing strategy for energy storage use rights, specifically the leased capacity of the HSES. The second part involves day-ahead bidding and real-time operation decisions, i.e., day-ahead energy bids, real-time energy base points, and energy storage dispatch decisions. The objective function for the NES s is presented as follows:
where γn denotes the probability of scenario n.
The HSES leasing cost of NES s is determined by its leasing decisions and the unit leasing prices, which can be expressed as follows:
where
The day-ahead bidding profit of NES s is determined by the day-ahead bidding decisions and market prices, which can be expressed as follows:
where
The real-time market revenue of NES s is determined by the real-time energy base points and can be represented as
where
The energy deviation penalty for NES s is determined by the difference between its reported day-ahead energy bids and real-time energy base points and can be expressed as
where
Then, the constraints of the lower level are summarized as follows.
1) The energy continuity constraint of the leased HSES:
where
2) The power balance constraint of NES s:
where
3) The power constraint of the leased HSES:
where
4) The remaining energy constraint of the leased HSES:
where
5) The initial and final consistency constraints of the leased HSES:
where
6) The charging/discharging state constraint of the leased HSES:
where
7) The power-to-capacity ratio constraint of the leased HSES:
where θs and θl represent the power-to-capacity ratios of H-SES and D-SES, respectively. The power and capacity of the leased HSES must adhere to physical constraints.
8) The new energy output constraint of the NES:
where
3.2 Upper-level model: maximizing the net profit of the HSES operator
The goal of the objective function in the upper-level optimization model is to maximize the annual net profit RHSES of the HSES operator. The decision variables of the model consist of two parts: the first part includes pricing and planning decisions, i.e., the construction capacities Es,inv and El,inv of HSES and the leasing price coefficients ρs,lea and ρl,lea of HSES; the second part includes operation and scheduling decisions, i.e., day-ahead energy biding and real-time scheduling strategies. Note that the operation and scheduling decisions correspond to different scenarios, while pricing and planning decisions are fixed values.
where
The annualized investment cost Cinv of HSES is determined by the type of energy storage and invested capacities, which can be expressed as
where r denotes the discount rate. Ys and Yl represent the lifespan of H-SES and D-SES, respectively.
The operation and maintenance cost Cmt of HSES can be calculated as follows:
where Ps,inv and Pl,inv represent the rated power capacities of the constructed H-SES and D-SES, respectively. cmt represents the annual unit operation and maintenance cost of the energy storage.
The leasing revenue of the operator is determined by the leasing demands of NESs, which can be expressed as
The proxy market revenue paid by the HSES operator to all the NESs is obtained based on the optimal operation results of NESs, which can be expressed as
The aforementioned equation represents the settlement of NESs by the operator in accordance with the energy market rules. In other words, the relationship between each new energy power station and the operator is merely agency-based rather than a cooperative one.
The day-ahead bidding revenue of the HSES operator is determined by the day-ahead bidding volume, which can be expressed as
where
The real-time market revenue of the HSES operator is determined by the real-time output, which can be expressed as
where
The energy market deviation penalty for the operator is determined by the difference between the day-ahead bidding volume and the real-time energy base point. It can be expressed as follows:
In the upper-level model, the operator coordinates the centralized energy storage systems based on the real-time output of new energy and the storage requirements of each NES. The model constraints are summarized as follows.
1) The power balance constraint of the HSES:
where
2) The capacity constraint of the HSES:
The aforestated constraints ensure that the maximum capacity of the HSES leased by each NES does not exceed the capacity of the centralized HSES, preventing violations of physical limits during the leasing process.
3) The energy continuity constraint of the HSES:
where
4) The remaining energy constraint of the HSES:
5) The initial and final consistency constraints of the leased HSES:
where
6) The charging/discharging state constraint of the HSES:
where
7) The charging/discharging power constraint of the HSES:
8) The power-to-capacity ratio constraint of the HSES:
4 Three-stage optimization-based solution method for the Stackelberg game model
The bi-level optimization model given in Section 3 is an NP-hard problem, which is difficult to solve directly. Moreover, the interaction between the upper and lower levels in the bi-level optimization model greatly increases the difficulty of the solution. To this end, the effective solution to this problem is explored from the essence of the Stackelberg game problem in this work.
In practice, the planning of the HSES should be referenced by the storage demands of the game participants. Therefore, the HSES planning decisions should be made after the followers declare the storage leasing requirements and dispatching requirements. Therefore, the bi-level optimization problem in this work can be extended to a three-stage optimization problem. In this three-stage optimization problem, the operator first decides the leasing price of the HSES. After receiving the leasing price signal, NESs make HSES leasing, market bidding, and real-time scheduling decisions and then feedback the optimization results to the operator. Upon receiving the detailed information from NESs, the operator makes HSES planning decisions.
In the first and second stages of the game, the storage leasing demands of the followers are influenced by the leasing prices, and the leasing demands in turn affect the pricing strategy by affecting the operator’s profit. Then, in the second and third stages of the game, the HSES planning strategy of the operator is influenced by the leasing and dispatching demand of each follower, and the storage planning decisions will further affect the operator’s total profit, thereby affecting the operator’s initiative in the decision-making of the pricing strategy. Therefore, although the planning decision is made in the last stage, the decisions of these three stages will affect each other, so it is necessary to extend the original bi-level model into a unified three-stage Stackelberg game problem.
For the constructed multi-stage Stackelberg game, which is a large-scale mixed-integer programming problem, the number of stages and integer variables makes it difficult to be simplified into a single-layer mixed-integer linear programming (MILP) problem using traditional model transformation methods such as the Karush–Kuhn–Tucker (KKT) conditions or the dual theory. However, adopting the genetic algorithm (GA) for price decision-making can help effectively reduce the complexity of the model. Meanwhile, during the decision-making process at the middle and lower levels, each participant can utilize MILP to enhance the speed and precision of the solution. In addition, while the upper level employs the GA, the middle and lower levels utilize MILP based on information from the upper level and their own profit models. Only price signals and demand signals need to be transferred between different optimization levels, which can well-simulate the independent decision-making process by each participant in a competitive market based on public information. Note that this method can also help ensure the privacy and security of equipment parameters and other sensitive information from all parties.
To sum up, a three-stage solution method based on GA–MILP–MILP is adopted in this work, and the solution process of the method is shown in Figure 4.
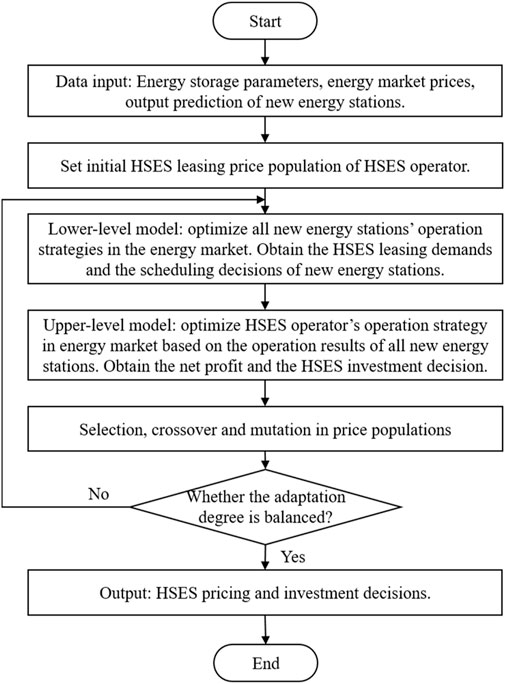
FIGURE 4. Flowchart of the proposed GA–MILP–MILP algorithm.
As shown in Figure 4, the proposed GA–MILP–MILP solution algorithm involves the following steps:
1) Initially, generate the corresponding leasing price population of HSES, i.e., the decision-making in the first stage.
2) Then, under each pricing population, solve the MILP problems of all NESs by the commercial CPLEX solver and obtain the optimal operation and leasing decisions, i.e., the decision-making in the second stage.
3) After all followers complete optimization, their leasing and dispatching demands can be aggregated. On this basis, the operator makes a decision on the optimal planning strategy of HSES, i.e., the decision-making in the third stage. Note that this MILP problem can also be solved by the CPLEX solver. Then, the operator’s profit, which serves as the fitness function in the GA, is obtained.
4) Based on the result of the fitness function, the population undergoes selection, crossover, and mutation to produce a new generation population. The procedure returns to step 1) and continues until it reaches equilibrium or exits the iteration limit.
Since the models in the middle and lower levels are MILP problems, the optimal solutions obtained in the second and third stages are subgame perfect equilibriums. When the best pricing strategy found by the GA at the upper level is identical or converges between two consecutive generations (i.e., the first stage reaches optimality), it can be concluded that all participants reach optimality at all stages, and the multi-stage Stackelberg game achieves a subgame perfect equilibrium.
5 Case studies
5.1 Experimental settings
In this work, case studies are performed in a region with six NESs, i.e., three wind power stations and three photovoltaic power stations, to verify the effectiveness and superiority of the proposed pricing and planning strategy. The rated capacities of these six NESs are set as 25 MW, 15 MW, 10 MW, 25 MW, 13 MW, and 12 MW. The typical scenario sets of wind power and photovoltaic power are generated by the historical RES data from the NREL dataset and the stochastic programming method based on the typical scenario generation technique, as shown in Figure 5. Meanwhile, the historical market data of PJM are taken to generate the price scenario of the energy market, and all subjects in this work are assumed as price-takers.
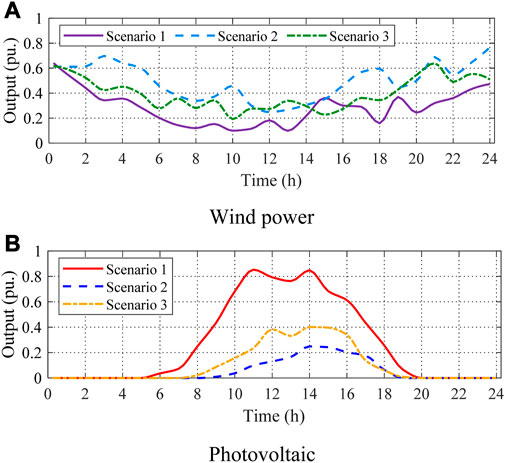
FIGURE 5. Three typical scenarios of wind and photovoltaic power. (A) Wind power. (B) Photovoltaic power.
The other parameters are set as follows: Three typical scenarios are set for summer, winter, and transition seasons. The parameters of hybrid energy storage systems are summarized in Table 1. The discount rate r is set as 0.05. The deviation penalty coefficients of the energy market, π+ and π−, are set as 0.8.
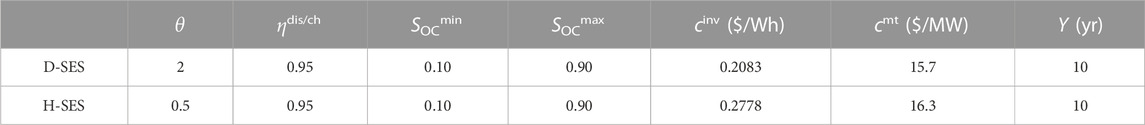
TABLE 1. Basic parameters of HSES systems.
The simulation is carried out on a 64-bit server with 2 Intel Xeon Gold 2.00-GHz CPUs and 64-GB RAM on the MATLAB platform. The proposed optimization problems are solved by the GA algorithm and the commercial solver CPLEX in the YALMIP toolbox.
5.2 Analysis of the pricing and planning results for the HSES operator
5.2.1 The simulation results under the optimal HSES pricing and planning strategy
To explore the impact of leasing price on the profits of NESs and the HSES operator, the results under optimal pricing and planning strategies of HSES based on the proposed Stackelberg game-based method are analyzed in this subsection. Through the GA–MILP–MILP solution method, the optimal price coefficients for HSES are obtained as ρl,lea = 1.02 and ρs,lea = 0.22. Then, the optimization results under the optimal pricing strategy are summarized in Table 2.
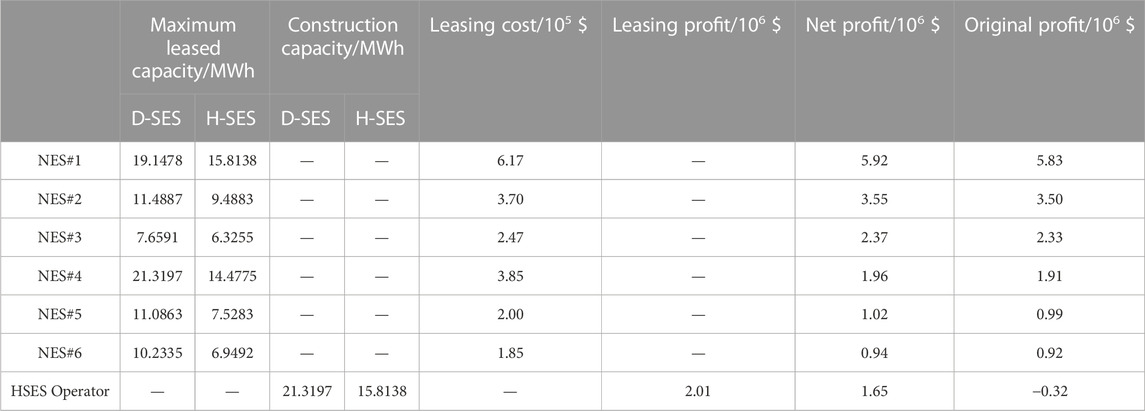
TABLE 2. Optimization results under the optimal HSES pricing and planning strategy.
5.2.1.1 For NESs
The HSES provides a new method for these entities to access flexible and adjustable energy storage resources. By leasing D-SES and H-SES, they can obtain the rights to use short-term energy storage resources, which in turn allows them to reduce penalties associated with energy market deviation assessments and enhance their market profits. Taking NES#1 as an example, as shown in Table 2, its original profit is 5.83 × 10⁶ $ when participating in the energy market without energy storage. After leasing the use rights of HSES, NES#1 is required to pay the leasing fee of 6.17 × 10⁵ $. However, its net profit increases to 5.92 × 10⁶ $, an increase of 1.5% compared to the original earnings.
5.2.1.2 For the HSES operator
First, it can be observed from Table 2 that, under the optimal pricing strategy, the optimal energy storage construction capacities can be obtained as 21.3197 MWh for D-SES and 15.8138 MWh for H-SES, with an annualized total investment cost of 1.14 × 10⁶ $. It is apparent that the total leasing profit of the HSES operator (i.e., 2.01 × 10⁶ $) notably outweighs the construction costs, and the net profit (i.e., 1.65 × 10⁶ $) equates to 145% of the annualized total investment costs. This allows for an approximate calculation of the investment cost recovery period, which is around 4.1 years. In addition, as depicted in Table 2, if the operator does not lease the energy storage use rights to NESs and participates in the market independently, it would not be able to recover the investment cost, resulting in a negative original profit (i.e., −0.32 × 10⁶ $). In contrast, under the proposed HSES model, the operator can garner substantial additional profits by leasing virtual use rights of HSES to NESs, effectively shortening the cost recovery period. It is noteworthy that as the actual control rights of energy storage belong to the operator, the construction capacity of the HSES is less than the total demand capacity of the NESs. In other words, the operator can reduce the investment cost by accommodating the complementary demands of NESs.
To sum up, for NESs, obtaining short-term use rights of D-SES and H-SES through the leasing market can help them deal with energy deviation and obtain additional market revenues. For the energy storage operator, profits from the leasing market can help increase the energy storage utilization rate and shorten the investment recovery cycle.
5.2.2 Profits of the HSES operator under different leasing price coefficients
To investigate the impact of different pricing strategies on the revenue of the HSES operator, the profits of the HSES operator under different leasing price coefficients are analyzed in this subsection. In this case, the price coefficient of D-SES ranges from 1 to 1.2, and the price coefficient of H-SES ranges from 0.1 to 0.5. The changes in the HSES operator’s profit are shown in Figure 6.
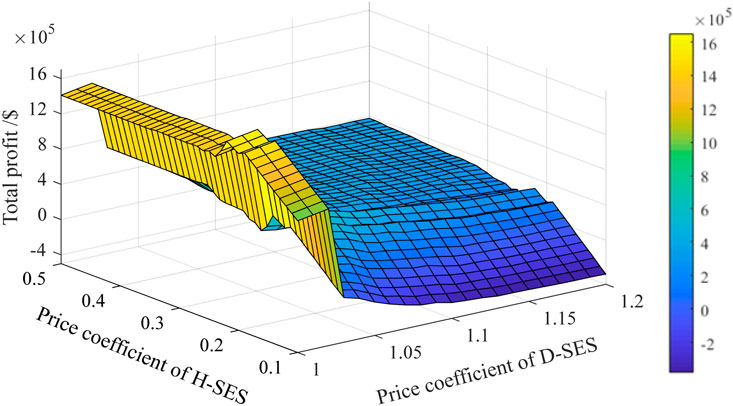
FIGURE 6. Profits of the HSES operator under different leasing price coefficients.
As observed from Figure 6, when the leasing price coefficient of D-SES remains constant, the profit of the operator generally increases first and then decreases as the leasing price coefficient of H-SES increases. The reason for this phenomenon can be explained as follows: when the leasing price of H-SES is relatively low, the NESs lease as much H-SES as possible under the established leasing rules to gain additional market revenue. Nevertheless, the low leasing price forces the operator to forfeit substantial revenue. As the leasing price increases, the reduction rate of the NESs’ leased capacity is slower than the growth rate of the leasing price; therefore, the operator’s profit exhibits an upward trend. As the leasing price further increases, the hefty leasing costs force the NESs to lower their leasing demands for H-SES, resulting in decreased revenue for the operator.
Similarly, when the leasing price coefficient of H-SES is kept constant, as the leasing price coefficient of D-SES increases, the operator’s profit presents a similar trend. The underlying reasons are congruent with the previous analysis and will not be reiterated here.
Interestingly, as can be clearly observed from Figure 6, the operator’s profit experiences a precipitous drop within the range of 1–1.05. The reason can be elucidated as follows: since D-SES is leased on a daily basis when the price coefficient is lower than a certain threshold, the marginal revenue for NESs from leasing D-SES significantly exceeds the leasing cost. This encourages NESs to lease as much D-SES as possible, thereby bringing substantial revenue for the operator. However, once this threshold is exceeded, NESs need to weigh the benefits of reducing deviation assessment penalties and the high-generation benefits associated with low storage against leasing as much D-SES as possible. This consideration leads to a sharp decline in the operator’s profit.
In summary, the leasing price coefficients show a large impact on the leasing demands of NESs and the benefit of the operator; thus, the operator should set the price coefficient reasonably according to the demand changes to maximize its own benefit.
5.2.3 Leasing results of HSES under different leasing price coefficients
To further investigate and explain the phenomena observed in Section 5.2; Section 5.2.2, the HSES leasing demands under different leasing price coefficients are analyzed in this subsection. With the price coefficient of D-SES fixed (i.e., 1.02), the leasing results under different price coefficients of H-SES (i.e., 0.16–0.30) are depicted in Figure 7. Similarly, with the price coefficient of H-SES held constant (i.e., 0.22), the leasing results under different price coefficients of D-SES (i.e., 1–1.14) are shown in Figure 8.
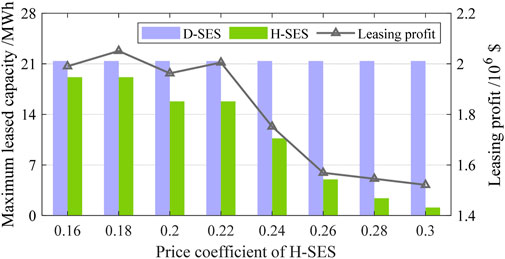
FIGURE 7. Leasing results under different leasing price coefficients of H-SES and fixed leasing price coefficient of D-SES.
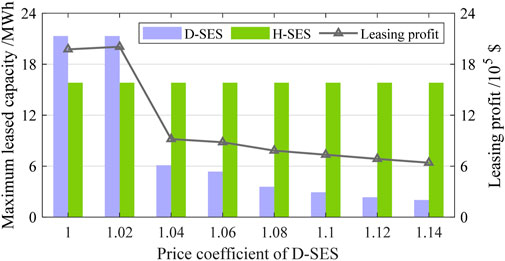
FIGURE 8. Leasing results under different leasing price coefficients of D-SES and fixed leasing price coefficient of H-SES.
As shown in Figure 7, when the leasing price coefficient of D-SES is fixed and that of H-SES is adjusted, the low leasing price coefficients of D-SES encourage NESs to lease as much D-SES as possible under the leasing rules; thus, the maximum leasing capacities of D-SES are same at 0.16 and 0.18. However, as the leasing price coefficient of H-SES increases, the total leasing capacity of H-SES generally decreases. Consequently, since the initial increase in price coefficient does not significantly impact the leasing capacity, the operator’s total leasing profit demonstrates a trend of initial growth followed by a decrease, which aligns with the phenomenon observed in the previous subsection.
Similarly, when the leasing price coefficient of H-SES is held constant and that of D-SES varies, due to the low leasing price of H-SES, NESs also lease as much H-SES as possible under the rules at 1 and 1.02, resulting in a constant maximum leasing capacity of H-SES. Furthermore, as can be observed from Figure 8, the leasing capacity of D-SES decreases abruptly at 1.02 and 1.04, a phenomenon that corresponds with the one observed in the previous subsection. This is because when the price coefficient exceeds a certain threshold, NESs have to consider the marginal benefits of energy storage instead of leasing blindly, thus causing the abrupt change. Correspondingly, the curve of the operator’s leasing revenue exhibits the same characteristic.
5.3 Comparisons between the cases under different energy storage utilizing modes
5.3.1 Results for the operator under different energy storage utilizing modes
To validate the advantages of the proposed HSES model and the optimal pricing and planning strategy, the results under different energy storage utilization modes are analyzed in this subsection. Table 3 presents the results for the operator under different energy storage utilizing modes. Note that “HSES” in the table represents the original case in this work, “only D-SES” represents the case where the operator only invests and leases the D-SES, “only H-SES” represents the case where the operator only invests and leases the H-SES, and “no leasing” represents the case where the operator utilizes the energy storage systems itself.
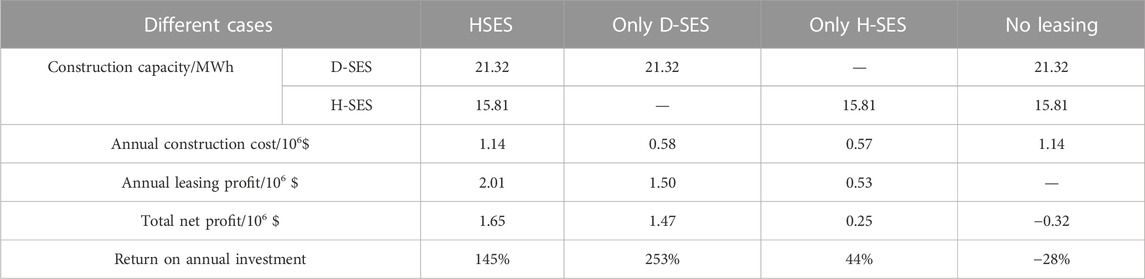
TABLE 3. Results for the operator under different energy storage utilizing modes.
As shown in Table 3, under the “no leasing” case, the operator cannot profit from participating in the energy market independently, with the total net profit less than 0, making it impossible to recover the investment costs within the planning period. In contrast, in the three cases considering shared energy storage, the operator’s net profits are all greater than 0. This indicates that the shared energy storage model can help the operator gain substantial revenue. In the “HSES” case, the total net profit of the operator is maximized, compared to the “no leasing” case, the “only D-SES” case, and the “only H-SES” case increased by 1.97 × 10⁶ $, 0.18 × 10⁶ $, and 1.40 × 10⁶ $, respectively. It is not difficult to find that although the concurrent configuration of D-SES and H-SES brings additional investment costs, the substantial increase in leasing profit can bring greater benefits. Additionally, even though the return on investment of HSES is lower than that of “only D-SES,” the operator can still recover investment costs in the short term.
To sum up, compared with other energy storage utilizing modes, the proposed HSES model shows better economics. It can make up for the shortcomings of the traditional energy storage usage model in terms of slow cost recovery speed and can further improve the operator’s revenue compared with the traditional single-type sharing model.
5.3.2 Results for new energy stations under different energy storage utilizing modes
To further explore the impact of the model proposed in this work on NESs, this subsection takes NES#1 as an example to analyze the economic benefits of NESs under different energy storage utilization modes. The results of NES#1 under different energy storage utilization modes are shown in Table 4. Note that “self-built ES” represents the case where NES#1 invests and utilizes the energy storage system itself and “no ES” represents the case where NES#1 participates in the energy market without energy storage resources.
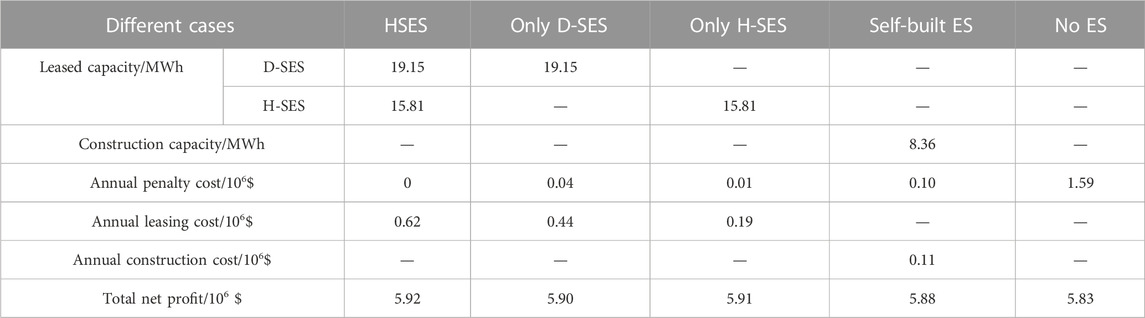
TABLE 4. Results for NES#1 under different energy storage utilizing modes.
As shown in Table 4, when no energy storage resources are utilized, the energy deviation penalty of NES#1 is as high as 1.59 × 10⁶ $, thereby affecting its net market profit. When investing and utilizing energy storage devices independently, the high investment cost of energy storage brings additional expenditure to NES#1. However, the flexible regulation capability provided by the energy storage device significantly reduces the energy market deviation penalty (i.e., 1.48 × 10⁶ $), enhancing NES#1’s market profit. Therefore, compared to the scenario without using energy storage resources, the net profit of NES#1 in the self-built energy storage case increased by 0.05 × 10⁶ $.
It can be observed in Table 4 that the mode of leasing shared energy storage can further improve the net profit of NES#1, among which the additional profit brought by leasing both D-SES and H-SES is the highest. As can be seen from Table 4, although the annual leasing costs are higher than the annual investment cost, the net profits are higher than that of self-built energy storage due to the larger amount of energy storage resources that NES#1 can utilize under the shared energy storage model. It is worth mentioning that leasing shared energy storage can also reduce the investment risk of NESs. In practice, if future market policies and its own power generation scale change, the NES can freely adjust the capacity of leased energy storage, which is more flexible and less risky compared to self-built energy storage.
Above all, the model proposed in this work shows the following advantages: for NESs, the HSES leasing market provides them with a flexible way to obtain adjustable resources. They can obtain the short-term use rights of hybrid energy storage resources without having to configure energy storage equipment themselves. In addition, compared to traditional single-type SES, NESs can lease both H-SES and D-SES according to their additional needs in certain periods to further reduce deviations. To sum up, leasing HSES can help NESs reduce energy deviations and increase market revenues. For the operator, leasing the virtual use rights of HSES to NESs can help obtain considerable leasing profit, thereby shortening the recovery period of investment costs. Moreover, compared to the traditional single-type leasing mode, the proposed leasing mode of HSES can bring more additional profit.
6 Conclusion
Pricing and planning of energy storage systems are urgent issues that need to be addressed for the energy storage owners. Therefore, a Stackelberg game-based three-stage optimal pricing and planning strategy of hybrid shared energy storage is formulated in this work for the operator to maximize the profit during the whole planning cycle. In addition, the three-stage GA–MILP–MILP algorithm is proposed to efficiently solve the Stackelberg game-based model. The effectiveness and advantages of the proposed strategy are verified through the case studies, and the following conclusions and suggestions are drawn for the HSES operator and NESs.
1) Compared to the traditional single-type leasing model, the proposed hybrid shared energy storage model considering two leasing options can bring additional profits for both the operator and NESs.
2) The proposed Stackelberg game-based pricing and planning strategy takes the preferences and selfishness of both the “leader” operator and “followers” new energy stations into consideration and can help the operator make optimal decisions with maximum profit.
3) For new energy stations, obtaining short-term use rights of D-SES and H-SES through the leasing market can help them deal with energy deviation and obtain additional market revenues.
4) For the energy storage operator, profits from the leasing market can help increase the energy storage utilization rate and shorten the investment recovery cycle.
In future works, NESs utilizing the HSES to participate in the joint energy and frequency regulation market will be studied, and the battery degradation will be considered in the pricing model. Moreover, the energy storage demander can be extended to include demand-side users, prosumers, integrated energy systems, etc. Furthermore, more flexible leasing options and more types of energy storage will be considered to perfect the business model of energy storage.
Data availability statement
The original contributions presented in the study are included in the article/Supplementary Material; further inquiries can be directed to the corresponding author.
Author contributions
CX: conceptualization, methodology, software, and writing–original draft. TZ: methodology, supervision, and writing–review and editing. LS: writing–review and editing, investigation, and visualization. JY: writing–review and editing, software, and validation. HY: methodology and writing–review and editing. BW: validation and writing–review and editing. GC: writing–review and editing. WQ: supervision and writing–review and editing.
Funding
The authors declare that no financial support was received for the research, authorship, and/or publication of this article.
Acknowledgments
The authors appreciate the support from Power China Huadong Engineering Corporation Limited for this work.
Conflict of interest
Authors CX, LS, JY, BW, and GC were employed by Power China Huadong Engineering Corporation Limited, China.
The remaining authors declare that the research was conducted in the absence of any commercial or financial relationships that could be construed as a potential conflict of interest.
Publisher’s note
All claims expressed in this article are solely those of the authors and do not necessarily represent those of their affiliated organizations, or those of the publisher, the editors, and the reviewers. Any product that may be evaluated in this article, or claim that may be made by its manufacturer, is not guaranteed or endorsed by the publisher.
References
Ahmed, S. D., Al-Ismail, F. S., Shafiullah v ybh, M., Al-Sulaiman, F. A., and El-Amin, I. M. (2020). Grid integration challenges of wind energy: A review. IEEE Access 8, 10857–10878. doi:10.1109/access.2020.2964896
Brijs, T., Huppmann, D., Siddiqui, S., and Belmans, R. (2016). Auction-based allocation of shared electricity storage resources through physical storage rights. J. Energy Storage 7, 82–92. doi:10.1016/j.est.2016.05.009
Cao, S., Zhang, H., Cao, K., Chen, M., Wu, Y., and Zhou, S. (2021). Day-ahead economic optimal dispatch of microgrid cluster considering shared energy storage system and P2P transaction. Front. Energy Res. 9, 645017. doi:10.3389/fenrg.2021.645017
Chen, C., Li, Y., Qiu, W., Liu, C., Zhang, Q., Li, Z., et al. (2022). Cooperative-game-based day-ahead scheduling of local integrated energy systems with shared energy storage. IEEE Trans. Sustain. Energy 13 (4), 1994–2011. doi:10.1109/tste.2022.3176613
Du, X., Li, X., Hao, Y., and Chen, L. (2022). Sizing of centralized shared energy storage for resilience microgrids with controllable load: A bi-level optimization approach. Front. Energy Res. 10, 954833. doi:10.3389/fenrg.2022.954833
Gong, Y., Zhang, J., and Sun, W. (2022). Auction mechanism for shared energy storage system portfolios based on decoupling power and capacity rights. Trans. China Electrotech. Soc. 37 (23), 6041–6053. doi:10.19595/j.cnki.1000-6753.tces.220945
Hajiaghasi, S., Salemnia, A., and Hamzeh, M. (2019). Hybrid energy storage system for microgrids applications: A review. J. Energy Storage 21, 543–570. doi:10.1016/j.est.2018.12.017
Kebede, A. A., Kalogiannis, T., Van Mierlo, J., and Berecibar, M. (2022). A comprehensive review of stationary energy storage devices for large scale renewable energy sources grid integration. Renew. Sustain. Energy Rev. 159, 112213. doi:10.1016/j.rser.2022.112213
Kong, S., Wang, Y., and Xie, D. (2023). Battery energy scheduling and benefit distribution models under shared energy storage: A mini review. Front. Energy Res. 11, 1100214. doi:10.3389/fenrg.2023.1100214
Li, L., Cao, X., and Zhang, S. (2022). Shared energy storage system for prosumers in a community: investment decision, economic operation, and benefits allocation under a cost-effective way. J. Energy Storage 50, 104710. doi:10.1016/j.est.2022.104710
Li, X., Xie, S., Fang, Z., Li, F., and Cheng, S. (2021). Optimal configuration of shared energy storage for multi-microgrid and its cost allocation. Electr. Power Autom. Equip. 41 (10), 44–51. doi:10.16081/j.epae.202110019
Liu, J., Chen, X., Xiang, Y., Huo, D., and Liu, J. (2021b). Optimal planning and investment benefit analysis of shared energy storage for electricity retailers. Int. J. Electr. Power & Energy Syst. 126, 106561. doi:10.1016/j.ijepes.2020.106561
Liu, J., Zhang, N., Kang, C., Kirschen, D. S., and Xia, Q. (2017). Decision-making models for the participants in cloud energy storage. IEEE Trans. Smart Grid 9 (6), 5512–5521. doi:10.1109/tsg.2017.2689239
Liu, S., You, S., Lin, Z., Zeng, C., Li, H., Wang, W., et al. (2021a). Data-driven event identification in the US power systems based on 2D-OLPP and RUSBoosted trees. IEEE Trans. Power Syst. 37 (1), 94–105. doi:10.1109/tpwrs.2021.3092037
Liu, Y., Wu, X., Du, J., Song, Z., and Wu, G. (2020). Optimal sizing of a wind-energy storage system considering battery life. Renew. Energy 147, 2470–2483. doi:10.1016/j.renene.2019.09.123
Long, Y., Xu, T., Cui, X., Chi, L., and Zhou, Q. (2022). “Research on optimal configuration method of shared energy storage for industrial users based on day-ahead scheduling,” in 2022 4th international conference on electrical engineering and control technologies (CEECT) Dec. 16 - 18, 2022, China, (IEEE), 414–418.
Ma, X., Li, Z., and Xin, H. (2022). Analysis on impact of rumors on electricity market operations with volatile renewables. J. Mod. Power Syst. Clean Energy 10 (3), 755–765. doi:10.35833/mpce.2021.000090
Rahman, M. M., Oni, A. O., Gemechu, E., and Kumar, A. (2020). Assessment of energy storage technologies: A review. Energy Convers. Manag. 223, 113295. doi:10.1016/j.enconman.2020.113295
Sun, C., Chen, L., Qiu, X., Zheng, T., and Mei, S. (2019). A generation-side shared energy storage planning model based on cooperative game. J. Glob. Energy Interconnect. 2 (4), 360–366. doi:10.19705/j.cnki.issn2096-5125.2019.04.006
Walker, A., and Kwon, S. (2021). Analysis on impact of shared energy storage in residential community: individual versus shared energy storage. Appl. Energy 282, 116172. doi:10.1016/j.apenergy.2020.116172
Wang, Z., Gu, C., and Li, F. (2018). Flexible operation of shared energy storage at households to facilitate PV penetration. Renew. energy 116, 438–446. doi:10.1016/j.renene.2017.10.005
Xie, Y., Yao, Y., Wang, Y., Cha, W., Zhou, S., Wu, Y., et al. (2022). A cooperative game-based sizing and configuration of community-shared energy storage. Energies 15 (22), 8626. doi:10.3390/en15228626
Yang, J., Dong, Z. Y., Wen, F., Chen, Q., and Liang, B. (2021). Spot electricity market design for a power system characterized by high penetration of renewable energy generation. Energy Convers. Econ. 2 (2), 67–78. doi:10.1049/enc2.12031
Yang, Y., Bremner, S., Menictas, C., and Kay, M. (2022). Modelling and optimal energy management for battery energy storage systems in renewable energy systems: A review. Renew. Sustain. Energy Rev. 167, 112671. doi:10.1016/j.rser.2022.112671
Zhang, T., Liu, S., Qiu, W., Lin, Z., Zhu, L., Zhao, D., et al. (2022a). KPI-based real-time situational awareness for power systems with a high proportion of renewable energy sources. CSEE J. Power Energy Syst. 8 (4), 1060–1067. doi:10.13702/j.1000-0607.20211241
Zhang, T., and Qi, X. (2020). Analysis of performance deviation of wind power enterprises in China. Front. Energy Res. 8, 126. doi:10.3389/fenrg.2020.00126
Zhang, T., Qiu, W., Zhang, Z., Lin, Z., Ding, Y., Wang, Y., et al. (2023). Optimal bidding strategy and profit allocation method for shared energy storage-assisted VPP in joint energy and regulation markets. Appl. Energy 329, 120158. doi:10.1016/j.apenergy.2022.120158
Zhang, T., Zhai, X., Oiu, W., Lv, T., Lin, Z., and Yang, L. (2022c). “Robust-based market bidding strategy and profit allocation method for the alliance of wind power generators considering shared energy storage,” in 2022 IEEE symposium series on computational intelligence (SSCI) December 7, 2022, China, (IEEE), 1356–1361.
Zhang, W. Y., Zheng, B., Wei, W., Chen, L., and Mei, S. (2022b). Peer-to-peer transactive mechanism for residential shared energy storage. Energy 246, 123204. doi:10.1016/j.energy.2022.123204
Zheng, B., Wei, W., Chen, Y., Wu, Q., and Mei, S. (2022). A peer-to-peer energy trading market embedded with residential shared energy storage units. Appl. Energy 308, 118400. doi:10.1016/j.apenergy.2021.118400
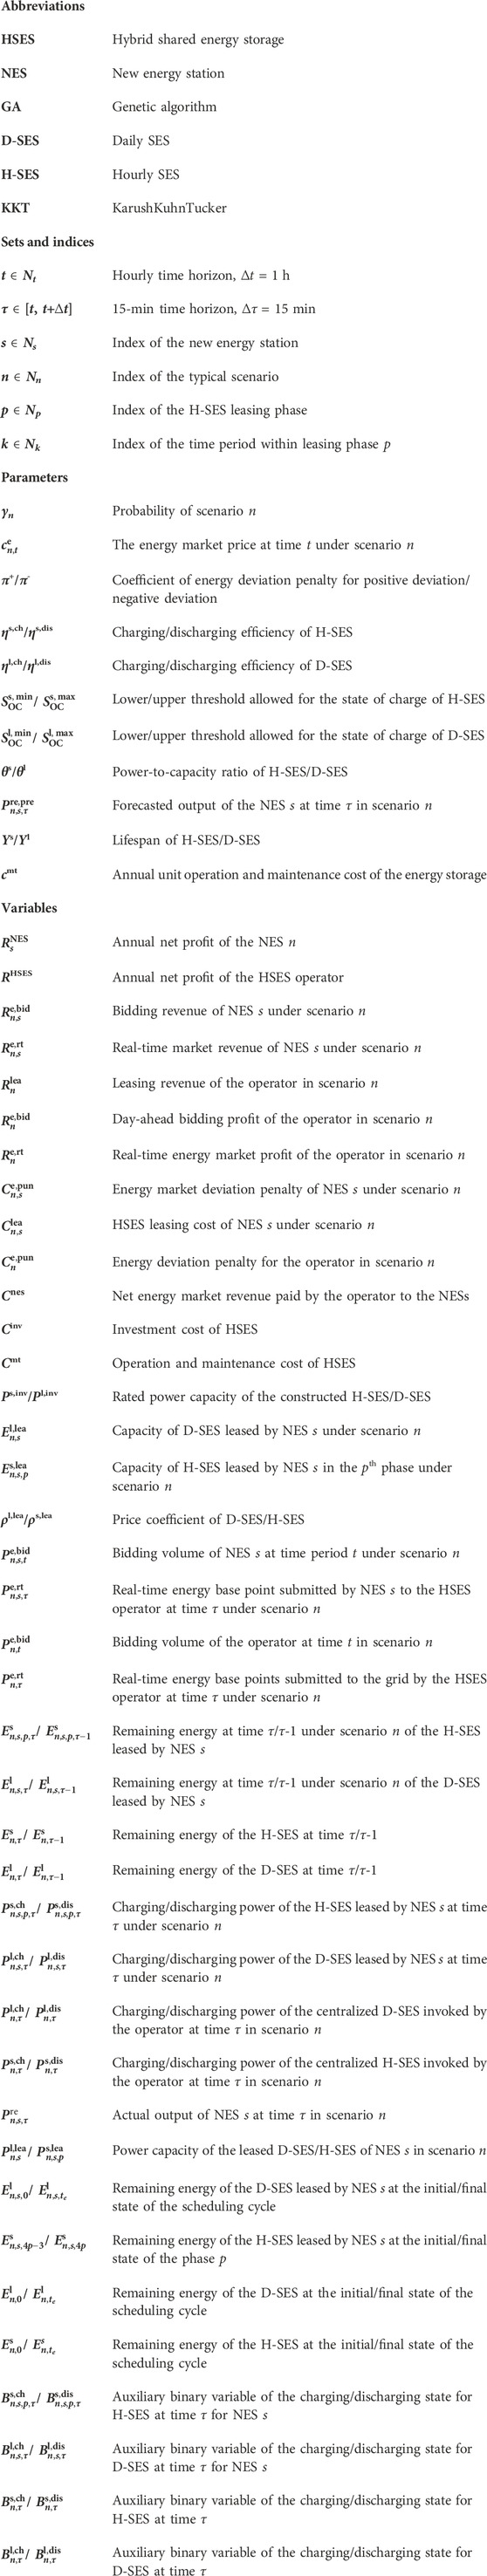
Nomenclature
Keywords: hybrid shared energy storage, planning strategy, pricing strategy, Stackelberg game, new energy station
Citation: Xu C, Zhang T, Si L, Yang J, Yu H, Wen B, Chen G and Qiu W (2023) Stackelberg game-based three-stage optimal pricing and planning strategy for hybrid shared energy storage. Front. Energy Res. 11:1273929. doi: 10.3389/fenrg.2023.1273929
Received: 07 August 2023; Accepted: 08 September 2023;
Published: 19 September 2023.
Edited by:
Shengyuan Liu, State Grid Zhejiang Electric Power Co., Ltd., ChinaReviewed by:
Jiazuo Hou, National University of Singapore, SingaporeWenjun Bi, Nanjing Institute of Technology (NJIT), China
Zhetong Ding, Southeast University, China in collaboration with reviewer (WB)
Copyright © 2023 Xu, Zhang, Si, Yang, Yu, Wen, Chen and Qiu. This is an open-access article distributed under the terms of the Creative Commons Attribution License (CC BY). The use, distribution or reproduction in other forums is permitted, provided the original author(s) and the copyright owner(s) are credited and that the original publication in this journal is cited, in accordance with accepted academic practice. No use, distribution or reproduction is permitted which does not comply with these terms.
*Correspondence: Tianhan Zhang, ZWV6aGFuZ3RoQHpqdS5lZHUuY24=