 Guoying Dang1*
 Chi Jiang
- 1School of Economics and Management, Southwest Forestry University, Kunming, China
- 2Huaneng Lancang River Hydropower Inc., Kunming, China
The evolution of China’s renewable power pricing regulation from subsidy-driven fixed feed-in tariffs (FIT) to market-oriented, quota-based renewable portfolio standards (RPS) is a crucial institutional transformation designed to advance the low-carbon energy transition. The government’s price regulation of mandatory and non-mandatory quotas has a direct impact on the optimal production decision-making behavior of renewable and coal-fired power producers, which determines the effective substitution of fossil energy by renewable energy in China, and relates to the successful realization of the low-carbon energy transition. This article presents the construction of a tripartite evolutionary game model under both non-mandatory and mandatory quotas, employing MATLAB software to simulate and assess the effectiveness of a tradable green certificate (TGC) system in the presence of mandatory quotas. Based on stable equilibrium strategies, we discuss the impact of FIT on green certificate trading under four different subsidy withdrawal strategies and three quota and penalty scenarios. The results indicate the following. First, when renewable power producers certify and engage in green certificate trading, coal-fired power producers purchase green certificates, and the government implements mandatory quotas, the participants in the game achieve an equilibrium strategy combination. Second, the findings validate the effectiveness of the RPS–TGC model (i.e., the green certificate trading system in the presence of mandatory quotas) for electricity price regulation. Third, the root cause of the failure of China’s current voluntary green certificate trading system is the government's non-mandatory quotas. Accordingly, it is proposed that the marketization of renewable electricity prices in China needs to adopt a fast-then-slow exit of FIT subsidies, with renewable energy power quotas set at 20% and penalty standards set at 1.5P.
1 Introduction
Electricity generation, as a naturally monopolistic industry, has long been subject to stringent governmental price regulations. Rapid technological advancements have significantly increased the efficiency of naturally monopolistic industries (Fan and Qi, 2011). Since 2015, China’s electricity industry has embarked on a new round of regulatory relaxations and market-oriented reforms. However, issues have arisen due to the distortion of regulations by groups with vested interests (Bai, 2015). A path for reforming natural monopolies was outlined in the Third Plenary Session of the Eighteenth Central Committee (Chen et al., 2018), which emphasized that the key to reforming the electricity industry through marketization lies in restraining the “middle” and opening the “ends.” Renewable energy, as a form of clean energy primarily used for power generation (Lin and Li, 2014), faces high fixed costs in its early stages (Shi, 2017) and is often more expensive than conventional fossil fuel energy, thus rendering it less competitive. In this context, it is imperative to establish reasonable price regulations to promote the sustainable and ongoing development of renewable energy sources (Huang, 2018; Mac Domhnaill and Ryan, 2020). Johansson and Kriström (2019) contend that the positive externalities inherent to renewable energy form the economic basis for subsidies and price regulations. Stricter regulations are conducive to technological innovation in the renewable energy industry and help to address the societal benefits arising from its positive externalities (Hille et al., 2020). Thus, targeted price regulation models are needed to rectify market failures that result from those positive externalities (Landry and Bento, 2019).
Various models exist for regulation of renewable power prices. They can be categorized based on whether they are direct, indirect, mandatory, or voluntary as well as based on their price and quantity aspects (Haas et al., 2011; Onifade, 2016). Huang (2011) suggests that policies such as feed-in tariffs (FITs) and quota systems are essentially forms of price regulation. While quota systems impose quantity requirements, renewable energy prices remain under regulatory control and the pricing in green certificate markets is determined by the actual supply of and demand for certificates. Considering the heterogeneous characteristics of renewable energy, and synthesizing the findings of existing research, renewable power price regulation models can be classified into three categories: fixed FIT policies; quota systems with tradable green certificates; and price regulation in competitive electricity markets.
The fixed feed-in tariff (FIT) policy has been acknowledged by Sandeman (2010) and by Leepa and Unfried (2013) as an expedient price regulatory policy that can be implanted to stimulate short-term investment in renewable power. Various nations have adopted diverse subsidy approaches and intensities for renewable power generation, which has resulted in FIT price regulation having a multifaceted nature. Nevertheless, at its core, FIT represents a supportive regulatory model wherein governments foster the development of new sources of renewable power generation through pricing mechanisms (Dusonchet and Telaretti, 2010; Mendonca et al., 2010). Renewable portfolio standards (RPS) encompass quota systems, while the tradable green certificate (TGC) system represents an entirely distinct approach to promoting renewable power generation. Mitchell and Connor (2006) underscore the point that quota systems and FIT are the most frequently utilized renewable energy price regulation models. TGC is in essence designed with the objective of enhancing policy efficiency (Kildegaard, 2008). Helgesen and Tomasgard (2018) construct an equilibrium model that encompasses the electricity market and TGC and posit that the introduction of a TGC market can stimulate competition in the renewable power industry while increasing societal welfare. Zhao et al. (2020) highlight the fact that the question of whether RPS, as a regulatory model, plays a pivotal role in optimizing resource allocation is a critical issue in the marketization of China’s electricity industry. Roldan Fernandez et al. (2016) contend that marketization facilitates a virtuous cycle in the relationship between renewable power and demand that is achieved through price signals and by guiding load requirements. China’s renewable power industry has witnessed over a decade of rapid growth, yet inefficient market mechanisms and noncompetitive market structures have impeded the penetration of renewable power (Xu and Wang, 2018). Therefore, it is imperative to develop an electricity market to facilitate long-term growth in the renewable power industry (Li et al., 2019). As such, the strategic use of market mechanisms to foster the evolution of electricity markets that incorporate renewables has become a focal point of scholars and practitioners worldwide (Lin, 2018).
Amidst a global wave of market-oriented energy governance reforms (Filimowicz and Tzankova, 2020), China embarked on its market-based energy reform in 2015, thereby demonstrating a resolute commitment to establishing a market mechanism with pricing at its core. This mechanism was envisioned to play a pivotal role in guiding resource allocation in the electricity market. With the initiation of a new phase of power sector reform—specifically, reform through marketization—the existing pricing mechanism for renewable power gradually became ill-suited to the broader market-oriented transformation of the electricity sector as a whole. The reform was intended to induce a pivot away from the traditional administrative approval-based model for electricity pricing and a move toward a market-determined pricing mechanism as its ultimate objective. In May 2020, the Central Committee of the Communist Party of China and the State Council jointly issued the “Opinions on Accelerating the Improvement of the Socialist Market Economy in the New Era,” which reiterated the imperative of constructing a vigorously competitive electricity market. The marketization of renewable energy has become an inevitable trend. However, renewable energy, which is characterized by its externalities and natural monopolies, has been subject to long-term pricing regulation in China, primarily through the FIT model. While FIT has indeed facilitated the expansion of renewable energy generation capacity, the government’s pricing regulation for renewable energy has historically been based on the characteristics of the traditional electricity industry and has thus been designed and implemented within a planning-oriented and highly monopolistic framework. Given the regional and seasonal characteristics of renewable energy, coupled with the constraints imposed by China’s existing power storage technology, the integration of renewable energy into the broader trend toward electricity marketization faces numerous challenges (Kirkegaard, 2018). Therefore, the results of this study constitute valuable and timely reference material for both policymakers and industry practitioners.
Price regulation of renewable power serves as a fundamental institutional safeguard by optimizing resource allocation and guiding the industry’s growth. In China, the regulation of renewable power prices is rooted in the traditional optimal regulation theory, which employs the average cost pricing model. This theory is the basis of the FIT policy, which is the primary governance mechanism of renewable power pricing. To a certain extent, this approach has fostered the large-scale development of renewables capacity in China. Despite these developments, however, coal-fired power remains the dominant source of power generation, and there are persistent challenges, such as insufficient capacity to absorb renewable power, substantial deficits in subsidy funds, and difficulties in integrating renewables into market-oriented mechanisms. This divergence opposes China’s pursuit of both low-carbon energy sources and electricity market reform. The Chinese government initiated a pilot tradable green certificate (TGC) system in 2017. However, as of June 2020, renewable power accounted for a mere 0.00233% of total non-hydro renewable power generation, thus indicating lackluster policy outcomes. In 2018, the Chinese government began to introduce renewable power quota assessments, thereby signaling the commencement of a system that couples mandatory renewable energy quotas with the RPS–TGC pricing mechanism. The degree to which this energy transformation will be successful hinges upon an interplay of interests and strategies among the government, renewable power producers, and coal-fired power producers. A comprehensive exploration of the strategic choices of renewable power producers and coal-fired plants in the presence of green certificate trading, the gradual phasing out of government subsidies, and the setting of quota benchmarks and penalty parameters will ultimately shape China’s renewable power pricing system and its impact on the low-carbon energy transition.
Comparative analysis of the distinct renewable energy pricing models is a pivotal consideration in research on pricing systems; this type of analysis primarily focuses on three dimensions. The first is the influence of various regulatory models on investors’ decisions from the perspective of risk mitigation. Hustveit et al. (2017) construct a dynamic stochastic model to study the market mechanisms of RPS–TGC pricing regulation in Sweden and Norway. The results indicate that anticipating green certificate prices remains challenging, thus requiring investors to factor uncertainties into their pricing decisions. Given the high sensitivity of green certificate prices to electricity consumption and production, changes in regulatory policies must be approached cautiously. It is advisable to prevent excessive fluctuations in green certificate prices, and both the Swedish and Norwegian TGC markets have been effective in advancing the renewable power industry while enhancing regulatory efficiency. Liu et al. (2018) employ a partial equilibrium model and use China as an example to simulate the effects of different renewable power pricing models. They assert that FIT pricing regulation significantly fosters the development of renewable power capacity, while the RPS–TGC pricing regulation model yields milder effects. Ritzenhofen et al. (2016), by constructing a dynamic, long-term capacity investment model, argue that RPS can more effectively utilize market signals to provide support for decision-makers’ investment and bidding strategies given its enhanced robustness. Fan et al. (2022) construct optimization models under the FIT policy for power plants with two distinct risk attitudes. They conduct a comprehensive analysis of the transition from the FIT policy to the market-oriented TGC policy. The findings indicate that power plants’ profits will fall should they transition from risk neutrality to risk aversion. However, when the differential in leveling costs between renewable and fossil fuel-based energy surpasses a critical threshold, risk-neutral power plants will produce a higher fossil fuel-based energy output than their risk-averse counterparts. Wang et al. (2022), by constructing a physical options model for photovoltaic power generation projects, demonstrate that lower technological costs and higher TGC prices facilitate the attainment of optimal investment opportunities. Yang et al. (2020), by employing a two-stage model, compare the influence of the FIT and RPS policies under uncertain conditions on the burgeoning renewable energy industry. Their results reveal that the FIT policy yields higher expected output and profits, but with relatively greater production and revenue risks due to lower market prices. In contrast, the RPS policy ensures relatively stable output and profits, whereas the FIT policy demonstrates a more pronounced incentive effect when renewable energy costs are elevated; the incentives associated with the RPS policy continue to strengthen as costs decrease. Azhgaliyeva et al. (2022), who utilize a fixed-effects panel model, make pioneering quantitative estimations of the impact ofthe government’s renewable energy policies on private investments from various funding sources. The results of their research underscore the significant impact of the FIT policy in stimulating renewable energy investment through public market financing, with particularly noteworthy results in the Asian subsample.
The second category of research revolves around the impact of the FIT and TGC pricing regulation systems on renewable power in particular and the electricity market in general. Haas et al. (2011) examine the price regulations adopted by EU member states for the development of new sources of renewable power. The majority of EU countries employ the FIT pricing regulation model and have successfully promoted the expansion of the renewable power industry at costs acceptable to the public. Empirical findings from countries such as Italy demonstrate that the TGC market operates inefficiently and therefore struggles to stimulate the growth of renewable power generation. Kilinc-Ata (2016) empirically investigates the influence of the FIT and RPS–TGC pricing models across 27 EU countries and 50 United States states on the development of the renewable power industry. The results suggest that FIT pricing regulation exhibits superior performance compared to the RPS–TGC pricing regulation model. García-Álvarez et al. (2018) further validate the effects of FIT and RPS–TGC pricing regulations on photovoltaic power generation in the EU during the period from 2000 to 2014. Their findings indicate that FIT pricing regulation increases the installed capacity for photovoltaic power generation in EU countries, and subsidies and timeframes have emerged as crucial regulatory parameters. Amiri-Pebdani et al. (2023) employ game theory to simulate government intervention in the electricity market through subsidies and RPS strategies. Their findings reveal that the optimal subsidies and RPS rates hinge upon the government’s emphasis on environmental impact, tax revenue, and societal welfare. Finally, Zhang et al. (2021) contend that, compared to gradually reducing fixed investment subsidies, discontinuing them after maintaining them for several years proves to be more effective. After the cessation of FIT, RPS effectively aids in sustaining the trend toward grid parity.
The third category of research delves into the effects of parameter settings under different FIT and RPS–TGC pricing models. Boomsma and Linnerud (2015) examine the influence of market and policy risks on both FIT and RPS–TGC pricing regulation and suggest that the variance in their respective impact is smaller than anticipated. They emphasize the need for cautious adjustments to regulatory parameters to avoid incurring substantial societal costs while pursuing renewable energy development objectives. Dong and Shimada (2017) contend that Japan initially adopted the RPS model for renewable power development but faced challenges in achieving its goals. Shifting to the FIT model in 2009 did not substantially improve the likelihood that its renewable energy development objectives would be realized. In addition to stage-specific heterogeneity factors in the development of the renewable power industry, the influence of power monopolies has played a significant role. By exerting pressure on the government, dominant power monopolies have manipulated regulatory parameter adjustments, thereby diminishing the efficacy of regulatory models. Fang et al. (2019) emphasize that well-considered parameter settings within regulatory models can expedite the formation of market equilibria. Based on a sensitivity analysis, Fang et al. (2022) observe that renewable energy quotas and grid electricity prices are the most influential parameters in determining this effect: with a quota set to 0.7, the proportion reaches 76.47%; and when the electricity price is 630 yuan per megawatt-hour, the proportion reaches 68.1%. Conversely, the impact of TGC prices and generation costs on renewable energy is comparatively limited. According to Zhao et al. (2021a), their results underscore the importance of scientifically designing quasi-parameters, such as technical conversion coefficients, TGC validity periods, TGC benchmark prices, and renewable energy generation quotas, for renewable energy generation systems. These factors encourage power producers to engage in TGC trading, thereby fostering the development of renewable energy sources.
Upon reviewing scholars’ investigations into distinct pricing models, it can be seen that focus has been widely placed on the investment risks and implementation effects associated with different models. Some studies have begun to recognize the pivotal role of appropriate settings for the parameters of regulatory models. Nonetheless, limited research addresses how the establishment of pricing regulation system parameters affects the strategic behaviors of renewable and coal-fired power producers as well as the transition between pricing models. In view of this, the present study, which is founded upon the construction of a tripartite evolutionary game model involving the government, renewable power producers, and coal-fired power producers, examines the equilibrium-stable strategy selections of all involved parties. This study utilizes MATLAB software to simulate and analyze the specific effects of regulatory parameter settings and constraints with the goal of furnishing viable recommendations for a smooth and effective transition from the FIT model to the mandatory RPS–TGC model in China.
2 Materials and methods
2.1 The construction of a tripartite evolutionary game model
Evolutionary game theory, which is a theoretical framework rooted in the principles of biological evolution (i.e., selection and variation), combines game theory with dynamic evolutionary processes. In contrast to traditional game theory, evolutionary game theory integrates ideas from rational economics and evolutionary biology. It refrains from modeling humans as hyper-rational players and therefore does not demand complete rationality or full information conditions from participants. Instead, it posits that humans generally achieve game equilibrium through trial and error, a process akin to biological evolution. The ultimate equilibrium is a function of the equilibrium process. Evolutionary game theory finds broad applications across traditional disciplines such as biology, behavioral science, control science, and the social sciences, particularly economics (Alger and Weibull, 2014; Liu, 2018).
In this context, we begin by embracing the principles of evolutionary game theory. By constructing a three-player evolutionary game model involving the government, renewable power producers, and coal-fired power producers, we analyze the strategic choices in the contexts of government-mandated and non-mandatory quotas for green certificate trading. We derive profit matrices for the three parties under different strategic choices. Building upon these matrices, we further dissect the process of the three-player evolutionary game while seeking equilibrium strategies that are both balanced and stable. By solving the respective replicator dynamic equations for the three parties, we pinpoint the equilibrium points reached in the evolutionary game.
Next, we subject these equilibrium points to a stability analysis. Utilizing Ritzberger’s proof, we eliminate locally equilibrious strategies that are not worthy of discussion. We calculate the Jacobian matrix eigenvalues of the local equilibrium strategies, then employ these eigenvalues to determine the asymptotic stability of local equilibrium strategies in the three-player evolutionary game. Consequently, we obtain evolutionary stable strategy (ESS) combinations for the three players. We discuss the ESSs adopted in four scenarios, thereby validating the root causes behind the limited effectiveness of China’s current voluntary green certificate system and confirming the efficacy of the RPS–TGC regulatory model. This theoretical analysis forms the basis for subsequent simulation and emulation.
The concept of tripartite evolutionary game theory and corresponding analysis methods have recently been applied in the research on environmental regulation. Chu and Bian (2018) and Li et al. (2019) conducted separate studies on the tripartite evolutionary game of government regulation in the context of smog control in the Beijing–Tianjin–Hebei region and environmental quality supervision. Gao and Liao (2020), in contrast, explored collaborative mechanisms within environmental regulation based on the framework of tripartite evolutionary games. Research into the strategic behavior choices of relevant entities in the electricity domain under different renewable power pricing systems, exemplified by Zhao et al. (2020) in their analysis of two-party evolutionary game models regarding RPS mechanisms, does not distinguish between strategic behaviors in the presence of mandatory quotas and those occurring under non-mandatory quotas. However, the government’s design rules for quota systems will have a differential impact on the strategic behaviors of power producers. Tripartite evolutionary game models have not yet been applied in the electricity trading sector. This study employs evolutionary game theory to assess the actual effectiveness of government intervention in voluntary green certificate trading and mandatory quota systems. Drawing inspiration from the aforementioned scholars’ use of evolutionary game methods, we construct a tripartite evolutionary game model in the electricity market involving the government, renewable power producers, and coal-fired power producers under both non-mandatory and mandatory quota systems to elucidate the effectiveness of mandatory quotas.
2.1.1 Model variables
The variables employed and their meanings within the tripartite evolutionary game model are shown in Table 1.
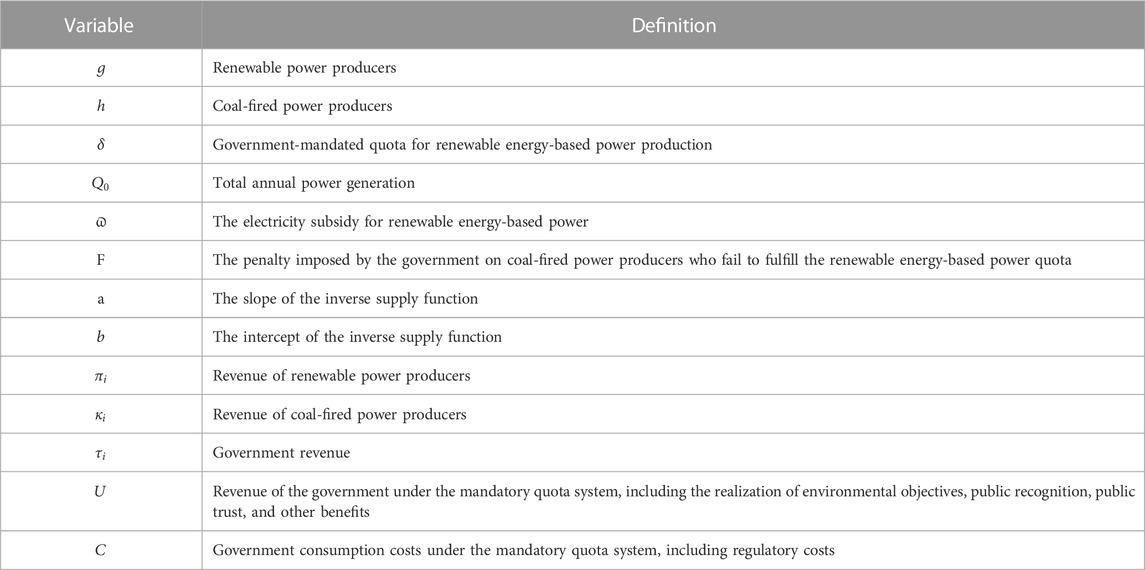
TABLE 1. Variables in the tripartite evolutionary game model.
2.1.2 Basic assumptions
Assumption 1. We envisage a scenario in which the government, renewable power producers, and coal-fired power producers are the participants in strategic interaction within the model. Operating with economic rationality, this triad engages in an evolutionary game that unfolds under conditions of incomplete information symmetry. Through a process of continuous trial and error, equilibrium is ultimately achieved. Notably, the validity period of green certificates is 1 year, and speculative behavior is nonexistent.
Assumption 2. In the near term, the challenges surrounding investing in renewable power persist. The government pursues two distinct strategic paths: (vigorous enforcement of the mandatory quota system, accompanied by penalties for coal-fired power producers failing to meet quotas; application of non-mandatory quotas). Renewable power producers, in contrast, choose from the following strategies: (certification and sale of green certificates; continuance without certification, thereby forgoing fixed grid pricing subsidies). Finally, coal-fired power producers choose from the following strategies: (procurement of green certificates to fulfill government-imposed quota objectives; acceptance of governmental penalties if abstaining from purchasing green certificates).
Assumption 3. The tariff on renewable power under the FIT mechanism aligns with the sum of coal-fired power pricing and subsidies. Under the government’s pursuit of mandatory quota fulfillment, returns encompass the attainment of predetermined objectives and utility benefits (U) arising from public approval. The corresponding costs encompass administrative expenditures (C). When renewable power producers opt to sell green certificates, their earnings amount to
Assumption 4. In the scenario in which renewable power producers certify and trade green certificates, earnings accrue in the absence of any outstanding financial obligations. Moreover, in the event that renewable power producers decline certification and continue under fixed grid pricing, the likelihood of eventually securing surplus subsidies beyond market prices is denoted as
Assumption 5. Within this framework, the probability that renewable power producers opt to certify and sell green certificates stands at
2.1.3 Establishment of the game payoff matrix
In this study, it is assumed that in the green certificate market, the supply function of green certificates is represented by
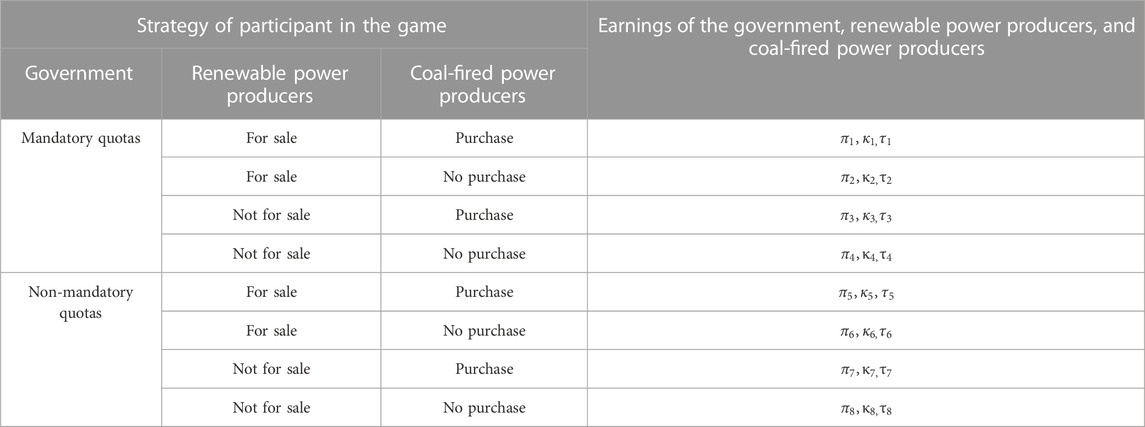
TABLE 2. Revenue matrix.
2.2 Analysis of the process of the tripartite evolutionary game between the government and power producers
The tripartite evolutionary game is not static. Instead, it involves a dynamic game process wherein all parties continuously explore and adjust their strategies to ultimately derive optimal strategies and achieve equilibrium (Su, 2020; Xu et al., 2021; Meng et al., 2022) through dynamic adaptation and evolution.
2.2.1 The tripartite evolutionary game process
The interactions among the government, renewable power producers, and coal-fired power producers represent an evolutionary game involving distinct cohorts, thus constituting an asymmetric game.
The replicator dynamics equation for renewable power producers is as follows:
The expected utilities of the strategies of “opting for certification and selling green certificates” and “not certifying green certificates” for renewable power producers are denoted as
Substituting Eqs 10–12 into Eq. 9 yields:
The replicator dynamics equation for coal-fired power producers is as follows:
The utility expectations of coal-fired power producers choosing between “purchasing green certificates” and “not purchasing green certificates” are denoted as
Substituting Eqs 15–17 into Eq. 14 yields:
The replicator dynamics equation for the government is as follows:
The government’s preference for selecting between a “mandatory quota system” and a “non-mandatory quota system” yields the expected utilities of
Substituting Eqs 20–22 into Eq. 19 yields:
When the learning rates of
Solving the system of Eq. 24 yields potential local equilibrium points within the evolutionary game, denoted as
2.2.2 Evolutionary stability analysis of tripartite strategy
In the realm of multiagent evolutionary game theory, as expounded upon by Ritzberger1 in 1996, a strategy combination is asymptotically stable in the dynamic replicator system of the game if and only if it constitutes a strict Nash equilibrium—the states of asymptotic stability and ESS combinations are mutually necessary and sufficient. Therefore, within the tripartite evolutionary game under consideration in the present study, the evolutionarily stable strategy combinations manifest in
The partial derivatives of the dynamic equations for the tripartite evolutionary game involving renewable power producers, coal-fired power producers, and the government are obtained from Eq. 25 as follows:
Pursuant to the Lyapunov stability criteria, when all eigenvalues of the Jacobian matrix λ are negative, the local equilibrium point achieves gradual stability and is designated as an attractor; if the Jacobian matrix bears a single negative eigenvalue λ, the local equilibrium point becomes unstable and is classified as a source; and in cases where the eigenvalues of the Jacobian matrix consist of one negative and two positive or one positive and two negative values, the local equilibrium point becomes unstable, akin to a saddle point. Therefore, through differentiation of Eq. 24 with respect to the renewable power producers, coal-fired power producers, and the government acting in the tripartite evolutionary game, we derive the eigenvalues of the Jacobian matrix at the local equilibrium points
2.2.2.1 Stability analysis of local equilibrium point
The Jacobian matrix for
The eigenvalues of the Jacobian matrix are
2.2.2.2 Stability analysis of local equilibrium point
The Jacobian matrix for
The eigenvalues of the Jacobian matrix are
2.2.2.3 Stability analysis of local equilibrium point
The Jacobian matrix for
Similarly, we can derive the eigenvalues for
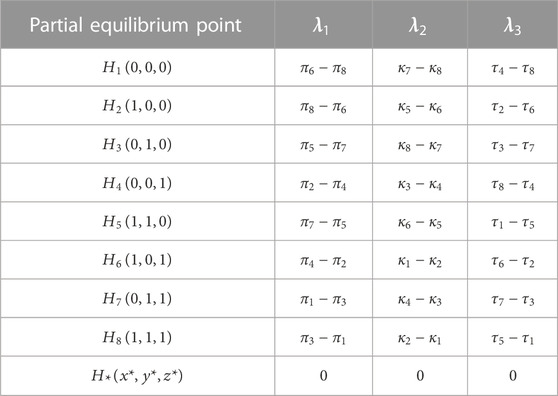
TABLE 3. Eigenvalues of the Jacobian matrix for each partial equilibrium point.
For the purpose of facilitating analysis of the direction of the signs of the eigenvalues of the Jacobian matrix corresponding to distinct local equilibrium points and without compromising generality, let us presume that U - C > 0, which indicates that the government attains positive net gains when enforcing mandatory quota regulations. Given the model’s engagement with numerous and intricate variables and parameters, the ensuing sections will separately delve into whether an ESS is reached within the tripartite evolutionary game across four distinct scenarios.
Scenario 1: When
Scenario 2: In the event that
Scenario 3: When
Scenario 4: In the circumstances in which
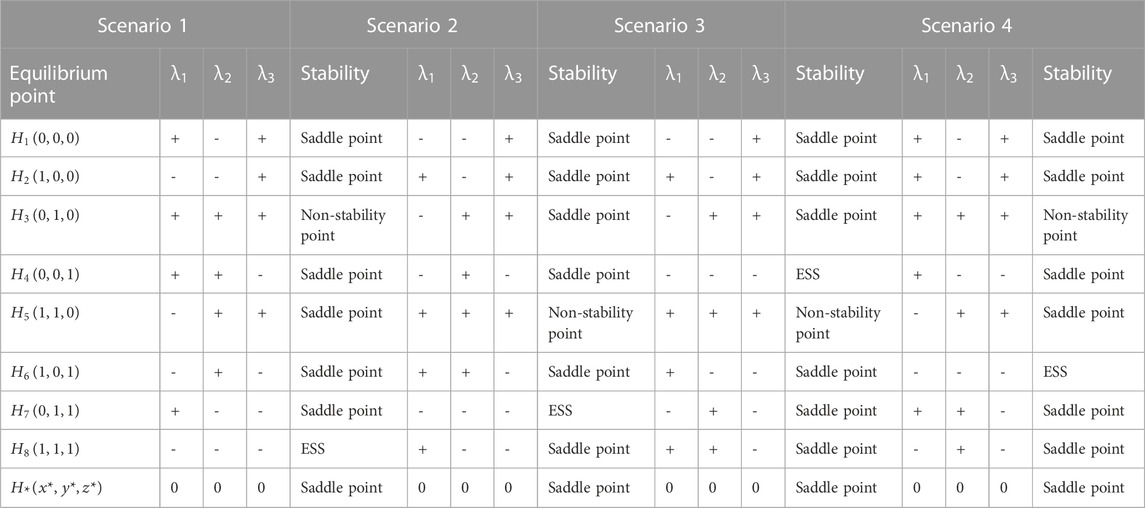
TABLE 4. Stability of partial equilibrium points (Scenarios 1, 2, 3, 4).
Combining Scenarios 1–4, the attainment of
3 Simulation and results
Drawing upon practical experience of China’s electricity market liberalization and low-carbon development, we imbue the payoff matrix of the tripartite evolutionary game with several assumptions for parameter initialization. Employing the MATLAB 2014a software package, we conduct numerical simulations of the dynamic game process under distinct initial states. We proceed to discuss the factors influencing regulatory effectiveness, an outcome that encompasses government subsidies, penalties, and quota parameters, based on the simulation outcomes. This discussion aims to provide a scientific foundation for systematic parameterization and rule design, which is essential for the seamless implementation of a renewable energy quota system.
3.1 Data selection and parameter assignment
In 2018, China’s total electricity generation amounted to 6.99 × 10⁹ MWh, with non-hydro renewable energy accounting for 7.77% of that total. Notably, China is poised to achieve grid parity in the coming years in incremental wind and photovoltaic power generation, which would entail equivalent pricing with coal-fired power and thus eliminate the need for subsidies. However, the price disparity between renewable and coal-fired power prevails and has been addressed through the subsidies provided by the Renewable Energy Fund. The specific numerical parameterizations are shown in Table 5.

TABLE 5. Parameter value settings.
In Table 5, the parameter
3.2 Simulation results
3.2.1 Scenario 1: when
The simulated strategies of the government, renewable power producers, and coal-fired power producers in Scenario 1, where the market price of green certificates surpasses the subsidies for renewable power generation and the penalty for failing to meet mandatory quotas outweighs the market price of green certificates, are depicted in Figure 1.
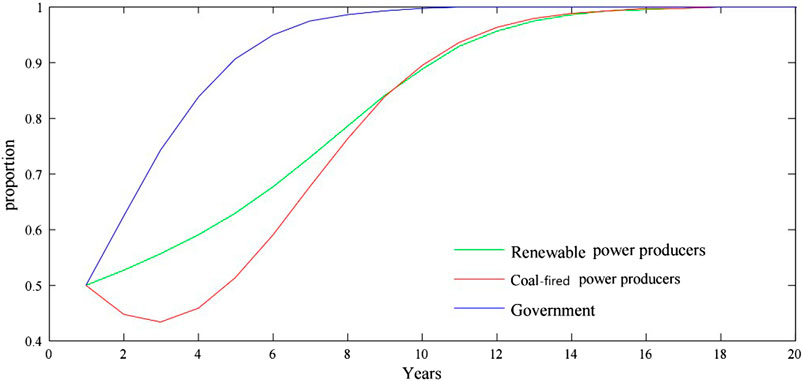
FIGURE 1. Tripartite evolutionary stable equilibrium
In Scenario 1, these three parties progressively converge toward unity, ultimately establishing a tripartite evolutionary equilibrium at point
3.2.2 Scenario 2: when
The simulated strategies of the government, renewable power producers, and coal-fired power producers in Scenario 2, where the market price of green certificates falls below the subsidies for renewable power generation and the penalty for failing to meet mandatory quotas surpasses the market price of green certificates, are illustrated in Figure 2.
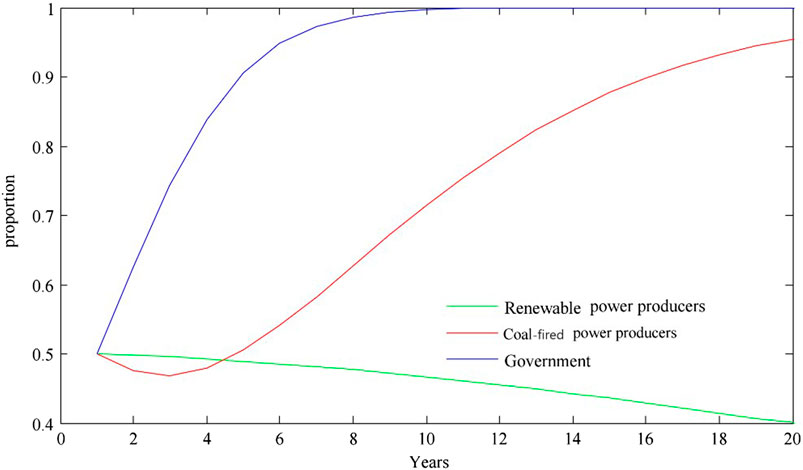
FIGURE 2. Tripartite evolutionary stable equilibrium
In Scenario 2, the government and coal-fired power producers gradually converge toward unity, while renewable power producers converge toward zero and opt out of green certificate transactions. The tripartite evolutionary equilibrium stabilizes at point
3.2.3 Scenario 3: when
The simulated strategic dynamics among the government, renewable power producers, and coal-fired power producers in Scenario 3, wherein the price of green certificates falls below the subsidies for renewable power generation and the penalty for not meeting mandatory quotas is less than the market price of green certificates, are presented in Figure 3.
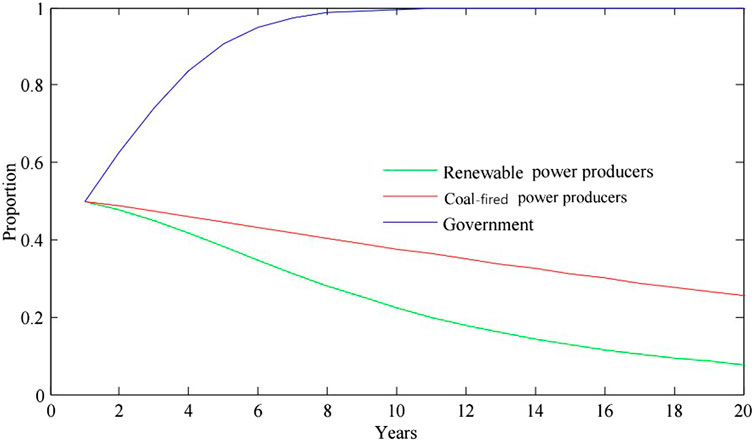
FIGURE 3. Tripartite evolutionary stable equilibrium
In Scenario 3, the government converges to a value of one, while renewable and coal-fired power producers gradually approach a value of zero, exhibiting resistance to engage in green certificate transactions. The tripartite evolutionary equilibrium stabilizes at point
3.2.4 Scenario 4: when
The strategic dynamics of the government, renewable power producers, and coal-fired power producers in Scenario 4, where the market price of green certificates exceeds the subsidies for renewable power generation and the penalty for not meeting mandatory quotas is less than the market price of green certificates, are illustrated in Figure 4.
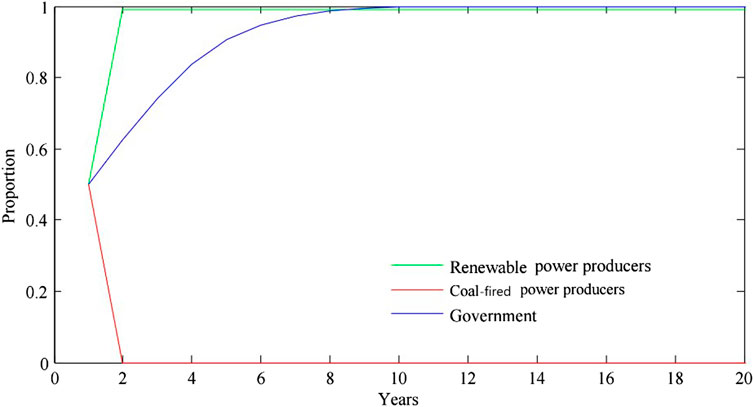
FIGURE 4. Stable equilibrium of tripartite evolution
In Scenario 4, the government and renewable power producers converge to a value of one, while coal-fired power producers converge to a value of zero, refraining from purchasing green certificates. The tripartite evolutionary equilibrium stabilizes at point AAAAA, with the government choosing to enforce mandatory quotas, renewable power producers opting to validate and trade green certificates, and coal-fired power producers opting not to purchase green certificates, ultimately causing the collapse of green certificate transactions.
By artificially simulating and evaluating the equilibrium strategies of the government, renewable power producers, and coal-fired power producers in the four aforementioned scenarios concerning mandatory and non-mandatory quotas, the conclusions drawn from the tripartite evolutionary game analysis are verified. Furthermore, to ensure that green certificate transactions become a shared strategy among power producers, the government must meticulously formulate the primary parameters of RPS and TGC, thereby averting Scenarios 2 to 4 and realizing the circumstances illustrated in Scenario 1. In the following section, we delve into a detailed discussion in the context of Scenario 1 concerning the impact of subsidy, quota, and penalty intensity parameter settings on green certificate transactions in the presence of mandatory quotas.
3.3 Discussion
3.3.1 Impact of subsidies on green certificate trading
We proceed to investigate the impact of different subsidy withdrawal patterns on green certificate transactions under Scenario 1 in the evolutionary game among stakeholders, where the ultimate equilibrium of
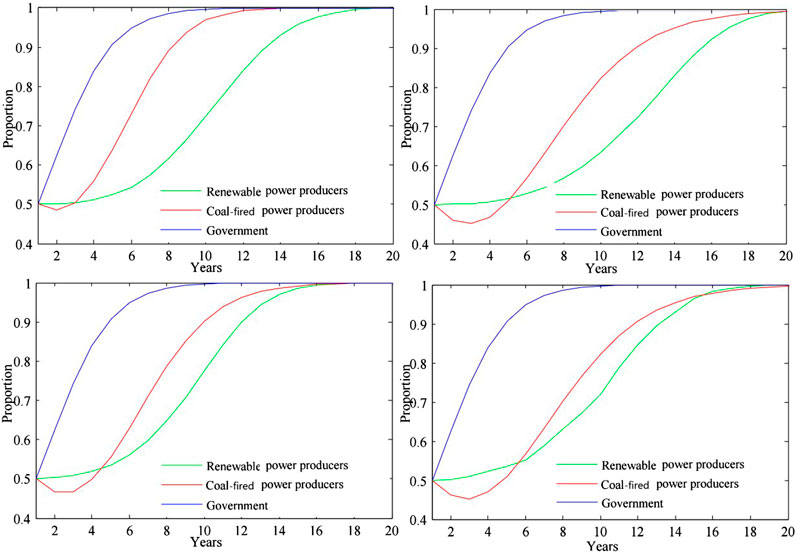
FIGURE 5. Impact of different subsidy withdrawal strategies on green certificate trading.
From Figure 5, it can be seen that under the first approach, coal-fired power producers reach equilibrium stability at Period 14, while renewable power producers attain equilibrium stability at Period 19. Notably, coal-fired power and renewable power producers do not synchronously adopt green certificate trading strategies, thereby hindering the achievement of green certificate transactions. Under the second approach (i.e., gradual-then-rapid subsidy withdrawal), both coal-fired and renewable power producers stabilize at equilibrium almost simultaneously by Period 20, thus facilitating the attainment of green certificate transactions, albeit with a lengthier equilibrium stabilization period. Under the fourth approach of stepwise subsidy withdrawal, both coal-fired and renewable power producers achieve equilibrium stability by Period 20. The third approach, which involves swift-then-gradual subsidy withdrawal, leads both coal-fired and renewable power producers to simultaneously achieve equilibrium stability by Period 15, thus facilitating the swift and efficient realization of green certificate transactions.
Consequently, in China’s transition from FIT to RPS–TGC regulation of renewable power pricing, opting for the third subsidy withdrawal approach (i.e., swift-then-gradual withdrawal) would enable the rapid realization of this transition.
3.3.2 Impact of quotas on green certificate trading
In this section, a specific comparative analysis is conducted to assess the equilibrium stability tendencies of renewable and coal-fired power producers in the context of an effective RPS–TGC framework (namely, Scenario 1), when the compulsory quota of
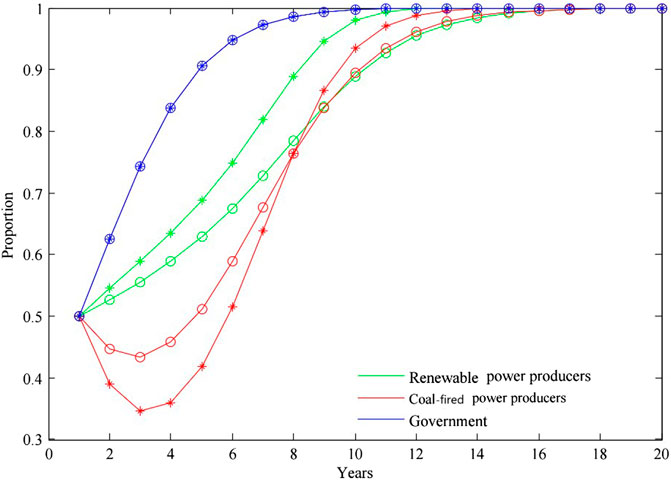
FIGURE 6. Effect of different quotas on green certificate trading.
When
With
Finally, in the scenario with a quota of 20%, both renewable and coal-fired power producers achieve strategic convergence and sustain a simultaneous ascent to equilibrium stability by the ninth period. This favorable outcome enhances the likelihood of a three-party green certificate transaction occurring. In summary, in contrast to the baseline scenario, setting
3.3.3 Impact of penalties on green certificate trading
We proceed to engage in a specific comparative analysis under the assumption of an efficacious RPS–TGC scenario in order to scrutinize the effects of three distinct penalty levels (namely, F = 1.3P, F = 1.5P, and F = 2P) on the equilibrium stability tendencies of renewable power producers, coal-fired power producers, and the governing body, with a specific focus on the implications for green certificate transactions. The ramifications of these divergent penalty levels for green certificate transactions are simulated and presented in Figure 7. Points plotted with the * symbol correspond to the F = 1.3P curve, which represents a low-penalty scenario; those plotted with the • symbol signify the F = 1.5P curve, which represents a moderate-penalty scenario; and those plotted with the o symbol denote the F = 2P curve, which represents a high-penalty scenario.
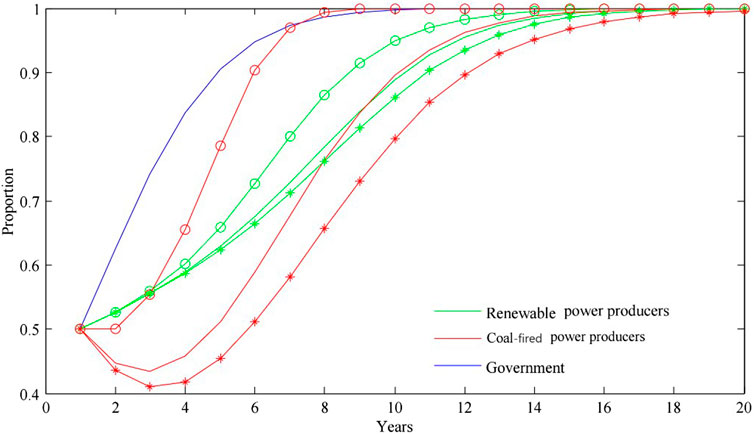
FIGURE 7. Impact of different penalty intensities on green certificate trading.
Upon analyzing Figure 7, it becomes evident that in the context of a low-penalty scenario, the establishment of a stable equilibrium strategy requires a substantial period of time. As the penalty factor (F) diminishes, the likelihood of coal-fired power producers purchasing green certificates decreases, while the probability of their incurring penalties from the governing body increases. Consequently, the rate of adjustment in the trading strategy of renewable energy producers with respect to green certificates also diminishes, but synchronizing the behaviors of these two parties remains challenging. This mutual lack of synchronization results in flatter curves for both parties, thus delaying the convergence to a mutually shared trading strategy. In the high-penalty scenario (F = 2P), coal-fired power producers experience relatively rapid evolution toward equilibrium stability in their strategic behavior, but this pace significantly outstrips that of renewable power producers, thereby leading to pronounced asynchrony. With an increase in the penalty factor (F), the propensity of coal-fired power producers to accept penalties from the governing body decreases, thus leading to a rapid escalation in the rate of adjustment in their trading strategy and resulting in steeper curves. Conversely, the rate of adjustment in the trading strategy of renewable power producers notably lags behind that of coal-fired power producers, as can be seen by the evident time delay. This asynchronous adjustment undermines the formation of a mutually shared trading strategy and postpones the achievement of a successful green certificate transaction.
In the context of a moderate-penalty scenario, both renewable and coal-fired power producers promptly synchronize their strategic behaviors and jointly converge toward an equilibrium stability strategy. This synchronization greatly contributes to the realization of a shared strategy selection within the dynamic framework of the tripartite game and facilitates green certificate transactions. In contrast with the moderate-penalty scenario, the adoption of excessively low or high penalties hinders the inclination of the agents in the tripartite game toward the shared strategic choice of engaging in green certificate transactions. This in turn impedes the transition from FIT pricing to RPS–TGC renewable energy pricing regulation.
4 Conclusion
At present, China adheres to the FIT regulatory model of renewable power pricing as well as employing existing government subsidies. Given the lackluster results of the voluntary green certificate trading pilot program in 2017, there is a need for in-depth exploration of the reasons for its ineffectiveness as well as exploration of the formulation of more effective regulatory policies for electricity pricing. In this context, we have first employed the concept of evolutionary game theory to construct a tripartite evolutionary game model involving the government, renewable power producers, and coal-fired power producers under RPS–TGC and non-mandatory quota-based green certificate trading systems while taking government subsidies into account. We solved the dynamic equations for the three parties’ strategies under two regulatory policies for pricing and have identified eight optimal strategies and local equilibrium points, including
In our simulation, we initially assigned parameter values in the profit matrices of the tripartite evolutionary game based on the actual Chinese power market and renewable energy industry. We utilized MATLAB 2014a software to simulate models of the tripartite evolutionary game under RPS–TGC and non-mandatory quota-based green certificate trading systems, with the simulation results corroborating our theoretical findings.
Furthermore, in exploring China’s transition from FIT to RPS–TGC for regulation of renewable power pricing, we have discussed the impact of different subsidy withdrawal strategies on green certificate trading using the tripartite ESS framework. We designed four subsidy withdrawal methods: uniform withdrawal, slow-then-fast withdrawal, fast-then-slow withdrawal, and stepwise withdrawal. Our results revealed that the fast-then-slow FIT subsidy withdrawal method enables both coal-fired and renewable power producers to achieve equilibrium stability at the same time, thus facilitating green certificate trading. At present, China prefers the slow-then-fast FIT subsidy withdrawal method for newly added renewable power generation, but our study indicates that this approach requires a longer period of time to attain equilibrium stability in green certificate trading. Therefore, the transition of China’s renewable power pricing regulation model from FIT to RPS–TGC will benefit from the adoption of a phased approach, with a higher initial subsidy withdrawal rate for existing renewable power producers that receive subsidies.
Finally, drawing upon the tripartite ESS results, we delved into the repercussions of various quota and penalty scenarios for the dynamics of green certificate trading among the players. Specifically, we introduced three distinct quota scenarios and three distinct penalty scenarios: high, medium, and low. The results of our simulated experiments revealed that under both the high- and low-quota scenarios, it takes an extended period of time for the parties to converge on a shared strategy that supports successful green certificate trading, as a result of the imbalance in quotas hindering efficient trading. Conversely, in the scenario in which quotas are moderate, both renewable and coal-fired power producers swiftly converge upon a shared strategy and progress toward equilibrium stability. This situation promotes a synchronized and efficient green certificate trading process. Similarly, in the presence of moderate penalties, both renewable and coal-fired power producers rapidly reach convergence and advance toward equilibrium stability. This in turn establishes shared beliefs and supports successful green certificate trading. Extremes in the key parameters within the Chinese RPS–TGC framework—whether excessively high or low—are therefore detrimental to the implementation of the RPS–TGC regulatory model for renewable energy pricing. In light of our results, we advocate for an initial quota allocation of 20% and a penalty standard of 1.5P.
Data availability statement
The raw data supporting the conclusion of this article will be made available by the authors, without undue reservation.
Author contributions
GD: Conceptualization, Formal Analysis, Writing–original draft. CJ: Supervision, Visualization, Writing–review and editing. ZL: Data curation, Investigation, Methodology, Resources, Software, Writing–original draft.
Funding
The authors declare financial support was received for the research, authorship, and/or publication of this article. This research was funded by the National Natural Science Foundation of China (Grant No. 71963034), the Philosophy and Social Science Planning Project on Popular Science of Yunnan Province (Grant No. SKPJ2022009), and the Key Liberal Arts projects of Southwest Forestry University (Grant No. WKZD104).
Acknowledgments
The authors would like to express their gratitude for the institutional support provided by the above funds.
Conflict of interest
Author ZL was employed by Huaneng Lancang River Hydropower Inc.
The remaining authors declare that the research was conducted in the absence of any commercial or financial relationships that could be construed as a potential conflict of interest.
Publisher’s note
All claims expressed in this article are solely those of the authors and do not necessarily represent those of their affiliated organizations, or those of the publisher, the editors and the reviewers. Any product that may be evaluated in this article, or claim that may be made by its manufacturer, is not guaranteed or endorsed by the publisher.
Footnotes
1In 1996, Ritzberger demonstrated that in the context of multi-agent evolutionary games, a strategy combination is asymptotically stable in the dynamic replication system of a multi-agent evolutionary game if and only if it constitutes a strict Nash equilibrium.
References
Alger, I., and Weibull, J. W. (2014). Evolutionarily stable strategies, preferences and moral values, in n-player interactions. Jrgen Wbull.
Amiri-Pebdani, S., Alinaghian, M., and Khosroshahi, H. (2023). A game theoretic approach-for time-of-use pricing with considering renewable portfolio standard effects and investment in energy storage technologies under government interventions. Energy 282, 128721. doi:10.1016/j.energy.2023.128721
Azhgaliyeva, D., Beirne, J., and Mishra, R. (2022). What matters for private investment in renewable energy? Clim. Policy 23, 71–87. doi:10.1080/14693062.2022.2069664
Bai, R. R. (2015). Mechanistic analysis of the influence of monopoly industry interest groups on regulatory relaxation. J. Humanit. (8), 9. doi:10.15895/j.cnki.rwzz.2015.08.005
Bergek, A., and Jacobsson, S. (2010). Are tradable green certificates a cost-efficient policy driving Technical change or a rent-generating machine? Lessons from Sweden 2003-2008. Energy Policy 38 (3), 1255–1271. doi:10.1016/j.enpol.2009.11.001
Boomsma, T. K., and Linnerud, K. (2015). Market and policy risk under different renewable electricity support schemes. Energy 89 (9), 435–448. doi:10.1016/j.energy.2015.05.114
Chen, L., Liu, D. Z., and Chen, Y. C. (2018). Low-spatial-frequency bias in context-dependent visual size perception. Chem. Manag. 20, 2. doi:10.1167/18.8.2
Chu, Z. P., and Bian, C. (2018). A study on environmental regulation policies for haze management in Bei-jing, Tianjin and Hebei based on evolutionary game. China Population-Resources Environ. 28 (12), 63–75. doi:10.12062/cpre.20180908
Dong, Y., and Shimada, K. (2017). Evolution from the renewable portfolio standards to feed-in tariff for the deployment of renewable energy in Japan. Renew. Energy 107 (7), 590–596. doi:10.1016/j.renene.2017.02.016
Dusonchet, L., and Telaretti, R. (2010). Economic analysis of different supporting policies for the production of electrical energy by solar photovoltaics in western European Union countries. EnergyPolicy 38 (8), 3297–3308. doi:10.1016/j.enpol.2010.01.053
Fan, H. J., and Qi, I. D. (2011). Study on the selection and design of competition models in China's natural monopoly industries--the case of electricity, telecommunication and civil aviation ind-ustries. China Ind. Econ. (8), 10. doi:10.19581/j.cnki.ciejournal.2011.08.005
Fan, Z. P., Cai, S. Q., Guo, D. L., and Xu, B. (2022). Facing the uncertainty of renewable energy production: production decisions of a power plant with different risk attitudes. Renew. Energy 199, 1237–1247. doi:10.1016/j.renene.2022.09.064
Fang, D. B., Zhao, C. Y., and Kleit, A. N. (2019). The Impact of the under Enforcement of RPS in China: anevolutionary approach. Energy Policy 135 (12), 111021. doi:10.1016/j.enpol.2019.111021
FangWeiMei, Y. W. S. (2022). How dynamic renewable portfolio standards impact the diffusion of renewable energy in China? a networked evolutionary game analysis. Renew. Energy 193, 778–788. doi:10.1016/j.renene.2022.04.131
Filimowicz, M., and Tzankova, V. (2020). Reimagining communication: action. Boca Raton, Florida, United States: Taylor an-d Francis.
Gao, M., and Liao, M. L. (2020). A study of collaboration mechanism in haze management: based on evolutionary game analysis. Operations Res. Manag. 29 (5), 152–160.
García-álvarez, M. T., Cabeza-García, L., and Soares, I. (2018). Assessment of energy policies to promote photovoltaic generation in the European union. Energy 151 (5), 864–874. doi:10.1016/j.energy.2018.03.066
Haas, R., Resch, G., Panzer, C., Busch, S., Ragwitz, M., and Held, A. (2011). Efficiency and effectiveness of promotion systems for electricity generation from renewable energy sources: lessons from EU countries. Energy 36 (4), 2186–2193. doi:10.1016/j.energy.2010.06.028
Helgesen, P. I., and Tomasgard, A. (2018). An equilibrium market power model for power markets and tradable green certificates, including Kirchhoff's laws and nash-cournot competition. Energy Econ. 70, 270–288. doi:10.1016/j.eneco.2018.01.013
HilleAlthammerDiederich, E. W. H. (2020). Environmental regulation and innovation in renewable energy technologies: does the policy instrument matter? Technol. Forecast. Social Change 153 (1), 119921. doi:10.1016/j.techfore.2020.119921
Huang, J. Y. (2018). Empirical analysis of the impact of subsidy policy on wind power industry development. Ecol. Econ. 034 (5), 115–120.
Huang, J. Y. (2011). Research on the regulation policy of renewable energy tariffs in China. https://kns.cnki.net/KCMS/detail/detail.aspx?dbname=CDFD1214&filename=1012307726.nh.
Hustveit, M., Frogner, J. S., and Fleten, S. E. (2017). Tradable green certificates for renewable support: the role of expectations and uncertainty. Energy 141 (6), 1717–1727. doi:10.1016/j.energy.2017.11.013
Johansson, P. O., and Kristrm, B. (2019). Welfare evaluation of subsidies to renewable energy in general equilibrium: theory and application. Energy Econ. 83, 144–155. doi:10.1016/j.eneco.2019.06.024
Kildegaard, A. (2008). Green certificate markets, the risk of over-investment, and the role of longterm contracts. Energy Policy 36 (9), 3413–3421. doi:10.1016/j.enpol.2008.05.017
Kilinc-Ata, N. (2016). The evaluation of renewable energy policies across EU countries and US states: an econometric approach. Energy Sustain. Dev. 31 (4), 83–90. doi:10.1016/j.esd.2015.12.006
Kirkegaard, J. K. (2018). Wind power in China. Boca Raton, Florida, United States: Taylor and Francis.
Landry, J. R., and Bento, A. M. (2019). On the trade-offs of regulating multiple unpriced externalities with a single instrument: evidence from biofuel policies. Energy Econ. 85, 104557. doi:10.1016/j.eneco.2019.104557
Leepa, C., and Unfried, M. (2013). Effects of a cut-off in feed-in tariffs on photovoltaic capacity: evidence from Germany. Energy Policy 56 (5), 536–542. doi:10.1016/j.enpol.2013.01.018
Lin, B. Q., and Li, J. L. (2014). Quantitative evaluation of China's renewable energy policies based on stochastic dynamic recursion. Econ. Res. 49 (4), 15.
Lin, B. Q. (2018). Reflections on China's new energy development strategy. J. China Uni-versity Geosciences Soc. Sci. Ed. (02), 76–83. doi:10.16493/j.cnki.42-1627/c.2018.02.008
Liu, A. Z. (2018). Research on several cooperative evolution mechanisms based on evolutionary game theory. https://kns.cnki.net/KCMS/detail/detail.aspx?dbname=CDFDLAST2019&filename=1019009665.nh.
Liu, D. N., Liu, M. G., Xu, E. F., Pang, B., Guo, X., Xiao, B., et al. (2018). Comprehensive effectiveness assessment of renewable energy generation policy: a partial equilibrium analysis in China. Energy Policy 115 (4), 330–341. doi:10.1016/j.enpol.2018.01.018
Liu, Y. J., and Dong, F. (2021). What are the roles of consumers, automobile production enterprises, and the government in the process of banning gasoline vehicles? Evidence from a tripartite evolutionary game model. Energy 238 (1), 122004. doi:10.1016/j.energy.2021.122004
Li, H. Z., Ding, S., and Xu, Z. Y., February 2019, Development status and Application benefit analysis of Power energy storage, Proceedings of the 2018 7th international conference on sustainable energy and environment engineering (ICSEEE 2018), Shenzhen, China
Mac Domhnaill, C., and Ryan, L. (2020). Towards renewable electricity in Europe: revisiting the determinants of renewable electricity in the European Union. Renew. Energy 154, 955–965. doi:10.1016/j.renene.2020.03.084
Mendonca, M., Jacobs, D., and Sovacool, B. K. (2010). Powering the green economy: the feed-in tariff handbook Oxford, Oxfordshire, United Kingdom: Earthscan Publication. doi:10.4324/9781849774550
Meng, L., Liu, K., He, J., Han, C., and Liu, P. (2022). Carbon emission reduction behavior strategies in the shipping industry under government regulation: a tripartite evolutionary game analysis. J. Clean. Production 378, 134556. doi:10.1016/j.jclepro.2022.134556
Mitchell, D. B., and Connor, P. M. (2006). Effectiveness through risk reduction: a comparison of the renewable obligation in England and wales and the feed-in system in Germany. Energy Policy 34, 297–305. doi:10.1016/j.enpol.2004.08.004
Onifade, T. T. (2016). Hybrid renewable energy support policy in the power sector: the contracts for difference and capacity market case study. Energy Policy 95, 390–401. doi:10.1016/j.enpol.2016.05.020
Ritzenhofen, I., Birge, J. R., and Spinler, S. (2016). The structural impact of renewable portfolio standards and feed-in tariffs on electricity markets. Eur. J. Operational Res. 255 (1), 224–242. doi:10.1016/j.ejor.2016.04.061
Roldan FernandezBurgos PayanRiquelme Santos, J. M. M. J. M., and Trigo Garcia, A. L. (2016). Renewable generation versus demand-side management. a comparison for the Spanish market. Energy Policy 96, 458–470. doi:10.1016/j.enpol.2016.06.014
Sandeman, J. (2010). Feed-In Tariffs: accelerating the deployment of renewable energy. Interna-tional J. Environ. Stud. 63 (3), 463–478. doi:10.1080/00207230701737011
Shi, J. L. (2017). Analysis and suggestions on policy mechanism for renewable energy development promotion. China Energy 39 (9), 6. doi:10.3969/j.issn.1003-2355.2017.09.001
Su, Y. (2020). Multi-agent evolutionary game in the recycling utilization of construction waste. Science Total Environ. 738 (7649), 139826. doi:10.1016/j.scitotenv.2020.139826
Wang, B. J., Feng, Z. L., Feng, J., Yu, P., and Cui, L. Y. (2022). Decision making on investments in photovoltaic power generation projects based on renewable portfolio standard: perspective of real option. Renew. Energy 189, 1033–1045. doi:10.1016/j.renene.2022.02.112
Xu, L., Di, Z., and Chen, J. (2021). Evolutionary game of inland shipping pollution control under government co-supervision. Mar. Pollut. Bull. 171, 112730. doi:10.1016/j.marpolbul.2021.112730
Xv, L. Y., Du, J. G., and Wang, W. L. (2017). Evolutionary game analysis of rural water environmental management actions. China Population-Resources Environ. 27 (5), 17–26. doi:10.12062/cpre.20170332
Xu, Y., and Wang, K., February 2018, Research on estimation method of mileage power consumption for electric vehicles. Proceedings of the 2018 international conference on computer science, electronics and communication engineering (CSECE 2018), Wuhan, China
Yang, Y. P., Yang, W. X., Chen, H. M., and Li, Y. (2020). China’s energy whistleblowing and energy supervision policy: an evolutionary game perspective. Energy 213 (12), 118774. doi:10.1016/j.energy.2020.118774
Zhang, L. B., Chen, C. Q., Wang, Q. W., and Zhou, D. Q. (2021). The impact of feed-in tariff reduction and renewable portfolio standard on the development of distributed photovoltaic generation in China. Energy 232, 120933. doi:10.1016/j.energy.2021.120933
Zhao, X., Bai, Y., and Ding, L. L. (2021a). Incentives for personal carbon account: an evolutionary game analysis on public-private-partnership reconstruction. J. Clean. Prod. 282 (2), 125358. doi:10.1016/j.jclepro.2020.125358
Zhao, X. G., Wu, L., and Zhou, Y. (2020). How to achieve incentive regulation under renewable portfolio standards and carbon tax policy? A China’s power market perspective. Energy Policy 143 (8), 111576. doi:10.1016/j.enpol.2020.111576
Keywords: RPS, green certificates, RPS-TGC, electricity price regulation, evolutionary game
Citation: Dang G, Jiang C and Liu Z (2023) Analysis of the tripartite evolutionary game in the marketization of China’s renewable energy-based electricity prices. Front. Energy Res. 11:1272497. doi: 10.3389/fenrg.2023.1272497
Received: 04 August 2023; Accepted: 22 September 2023;
Published: 19 October 2023.
Edited by:
Yumin Zhang, Shandong University of Science and Technology, ChinaReviewed by:
Zhengmao Li, Aalto University, FinlandGuanguan Li, Shandong University of Technology, China
Copyright © 2023 Dang, Jiang and Liu. This is an open-access article distributed under the terms of the Creative Commons Attribution License (CC BY). The use, distribution or reproduction in other forums is permitted, provided the original author(s) and the copyright owner(s) are credited and that the original publication in this journal is cited, in accordance with accepted academic practice. No use, distribution or reproduction is permitted which does not comply with these terms.
*Correspondence: Guoying Dang, MTI4MzYxNDVAcXEuY29t