 Zhiwei Li1
 Yuze Zhao
 Pei Wu
- 1State Key Laboratory of Alternate Electrical Power System with Renewable Energy Sources, North China Electric Power University, Baoding, China
- 2Laboratory of Big Data and Philosophy and Social Sciences, North China Electric Power University, Baoding, China
Hydrogen is considered a promising alternative to fossil fuels in an integrated energy system (IES). In order to reduce the cost of hydrogen energy utilization and the carbon emissions of the IES, this paper proposes a low-carbon dispatching strategy for a coordinated integrated energy system using green hydrogen and blue hydrogen. The strategy takes into account the economic and low-carbon complementarity between hydrogen production by water electrolysis and hydrogen production from natural gas. It introduces the green hydrogen production–storage–use module (GH-PSUM) and the blue hydrogen production–storage–use module (BH-PSUM) to facilitate the refined utilization of different types of hydrogen energy. Additionally, the flexibility in hydrogen load supply is analyzed, and the dynamic response mechanism of the hydrogen load supply structure (DRM-HLSS) is proposed to further reduce operating costs and carbon emissions. Furthermore, a carbon trading mechanism (CTM) is introduced to constrain the carbon emissions of the integrated energy system. By comprehensively considering the constraints of each equipment, the proposed model aims to minimize the total economic cost, which includes wind power operation and curtailment penalty costs, energy purchase costs, blue hydrogen purification costs, and carbon transaction costs. The rationality of the established scheduling model is verified through a comparative analysis of the scheduling results across multiple operating scenarios.
1 Introduction
In order to cope with the increasingly serious shortage of fossil energy and climate problems, wind power generation, photovoltaic energy generation, and other renewable power generation systems have been widely used (Xu et al., 2023). However, due to the intermittent and uncertain output of renewable sources, a reliable replacement of power supply has not been formed yet, resulting in great challenges in the safe and reliable supply of electricity (Pan G S et al., 2023), and the phenomenon of abandoning wind power and photovoltaic power generation also occurs from time to time. While clean and pollution-free hydrogen energy can be stored on a scale, the storage of hydrogen produced from renewable energy generation provides a new idea to solve the problems of power supply and consumption of renewable energy under the new power system (Zuo et al., 2023).
An integrated energy system (IES) coupled with multiple energy forms for joint supply can meet the demand for multi-energy loads with low-carbon emissions (Li et al., 2023). A hydrogen-containing integrated energy system (HIES) coupled with hydrogen energy based on traditional IES further promotes the consumption of renewable energy and carbon emission reduction (Pan et al., 2020a).
At present, most studies on HIESs mainly focus on green hydrogen production by electrolytic water. For example, based on hydrogen production by electrolytic water, Fang et al. (2022) established an optimal scheduling model of integrated energy microgrids including multiple subsystems of electricity and hydrogen that can be traded with each other. Fang et al. (2023) established a two-stage scheduling model of an IES based on green hydrogen considering the electro-hydrogen hybrid replenishment station. However, under the current background of high cost and low energy conversion efficiency of green hydrogen (Zhang, 2022) and the prominent price and low carbon emission advantage of blue hydrogen (Zhao et al., 2022), the production of blue hydrogen from natural gas has research value. In this regard, Pan et al. (2020b) argued that the current development of the electric hydrogen energy system should be fully combined with the price advantages of traditional fossil energy. Chang (2021) pointed out that currently hydrogen production from natural gas is the most widely used method of hydrogen production in the world. Wu et al. (2022) combined hydrogen production from natural gas and hydrogen energy storage configuration, built an IES model of a park with multi-energy complementation of electricity, heat, and gas, and carried out hydrogen energy storage capacity configuration. The aforementioned studies considered the production and utilization of a single form of hydrogen energy, and some studies also considered the complementary coordination between gray hydrogen production from coal and green hydrogen production from electricity. The carbon emission of blue hydrogen production is much lower than that of gray hydrogen production; however, few studies consider the coordinated utilization of green hydrogen and blue hydrogen production.
In HIES based on green hydrogen, the hydrogen load is completely supplied by green hydrogen. For example, Fang et al. (2023) used green hydrogen to supply hydrogen load of a hydrogenation station. Li et al. (2017) used green hydrogen to supply the overall hydrogen load of a microgrid system. In a gray hydrogen and green hydrogen complementary IES, Pan Z N et al. (2023) established a virtual hydrogen plant model including hydrogen production from coal, hydrogen production from electrolytic water, and hydrogen storage equipment so as to supply hydrogen load required by transportation, industries, and other fields. Li et al. (2023) supplied hydrogen load in chemical parks with complementary gray hydrogen and green hydrogen. However, the hydrogen utilization of different production methods is not precise enough, and the resulting scheduling scheme is prone to the extreme situation that hydrogen load is completely supplied by gray hydrogen with a lower economic cost, leading to a low utilization rate of green hydrogen, and the mass production of gray hydrogen will cause an increase in carbon emissions. The hydrogen load supply of the Beijing Winter Olympics is a typical coordination system of blue hydrogen and green hydrogen (Wen and Tian, 2022). The supply of blue hydrogen and green hydrogen always maintains a 1:1 proportional structure, but this proportional structure ignores the complementary characteristics between blue hydrogen and green hydrogen, reducing the flexibility of system scheduling.
In addition, direct carbon emissions are generated in the production process of blue hydrogen, while indirect carbon emissions are generated in the power grid as a result of the electricity consumption of green hydrogen (Cui et al., 2020). If this is not taken into account, the IES may have a high carbon footprint. Therefore, the carbon emissions of hydrogen production should be included in HIES, and a carbon trading mechanism (CTM) should be introduced. In this regard, Xiao et al. (2022) believed that introducing a CTM into scheduling is a new approach for the research on low-carbon IES. Chen et al. (2021) proved that introducing a CTM into IES containing hydrogen can exert its great potential for carbon emission reduction. However, the aforementioned HIESs ignored carbon emissions in the process of hydrogen production, and the scheduling schemes were not environmentally friendly.
To deal with the aforementioned issues, this paper considers the refined coordination and complementarity of green hydrogen and blue hydrogen and proposes the dynamic response mechanism of hydrogen load supply structure (DRM-HLSS) by optimizing the supply ratio of green and blue hydrogen in hydrogen load. We take the CTM into account and aim to minimize the total cost of the sum of wind power operation and wind abandoning penalty cost, energy purchase cost, blue hydrogen purification cost, and carbon trading cost. The low-carbon scheduling model of HIES with refined and coordinated utilization of green hydrogen and blue hydrogen was constructed, and the economic and low-carbon nature of the proposed scheduling strategy was verified by comparing the day-ahead scheduling results under different scenarios. The main contributions are summarized as follows:
(1) In this work, an HIES is established, including GH-PSUM for electrolytic water hydrogen production and BH-PSUM for natural gas hydrogen production. This allows for refined coordination and complementarity of multiple hydrogen sources, making the energy management mechanism of the system more flexible.
(2) CTM and DRM-HLSS are implemented to restrict the carbon emissions of the system, fully leveraging the flexibility of coordination and complementarity of multiple hydrogen sources in terms of economy and environmental protection. This leads to a reduction in the daily operation cost of the units.
(3) The proposed energy management solution (EMS) is evaluated through a case study in several operational scenarios. The proposed EMS is compared against three benchmark scenarios: no BH-PSUM, no DRM-HLSS, and no CTM. The numerical results confirm the economic and environmental benefits of the proposed EMS.
The remainder of this paper is organized as follows: Section 2 describes the structure of the HIES and the DRM-HLSS. Section 3 presents the low-carbon optimal scheduling model of the system. Section 4 contains the case studies conducted to verify the effectiveness. The conclusions are given in Section 5.
2 HIES structure
2.1 Overview of the proposed system
According to the carbon emissions associated with hydrogen production, hydrogen energy can be categorized into three types: gray hydrogen, blue hydrogen, and green hydrogen. Gray hydrogen production has high carbon emissions but low cost. Blue hydrogen production has lower carbon emissions and higher energy conversion efficiency but a slightly higher cost. Green hydrogen production does not result in direct carbon emissions but has a higher cost. Given the goal of promoting the widespread use of hydrogen energy, this research focuses on the coordination between green hydrogen and blue hydrogen. The refined coordinated comprehensive energy system built with these two types of hydrogen includes three main components: energy distribution, energy coupling, and energy consumption. This system integrates various energy sources, energy conversion, and power supply equipment. The energy structure of the system is illustrated in Figure 1.
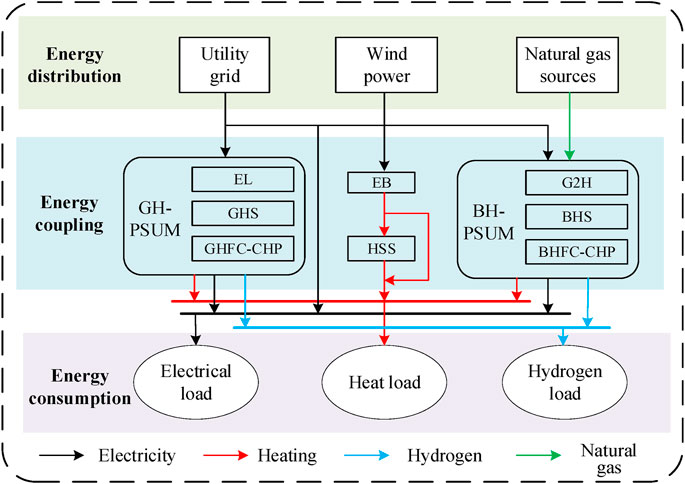
FIGURE 1. Energy structure of HIES.
The energy distribution side of HIES consists of the utility grid, wind power, and natural gas sources. The energy coupling side consists of GH-PSUM, BH-PSUM, an electric boiler (EB), and a heat storage system (HSS). The energy consumption side includes electrical, hydrogen, and heat loads. GH-PSUM consists of an electrolyzer (EL), green hydrogen storage (GHS), and green hydrogen fuel cell-based combined heat and power (GHFC-CHP). BH-PSUM includes gas-to-hydrogen (G2H), blue hydrogen storage (BHS), and blue hydrogen fuel cell-based combined heat and power (BHFC-CHP). The configuration of these two modules enables the refined coordination and complementation of green hydrogen and blue hydrogen. The electrical load of HIES is supplied by wind power, the grid, GHFC-CHP, and BHFC-CHP. The hydrogen load is supplied by GHFC-CHP and BHFC-CHP. The heat load is supplied by EB, GHFC-CHP, and BHFC-CHP. The energy storage devices in HIES ensure the balance of supply and demand by implementing time-shifting energy supply.
2.2 Models of hydrogen production–storage–use modules
The setting of GH-PSUM and BH-PSUM in the system makes the production, storage, and utilization of green hydrogen and blue hydrogen completely separate, and the whole chain of hydrogen energy from production to use can be tracked so as to achieve the purpose of refined utilization of hydrogen energy and facilitate the coordination and complementary optimization of green hydrogen and blue hydrogen.
GH-PSUM includes EL, GHS, and GHFC-CHP. EL converts electric energy into hydrogen energy without carbon emission in the whole process but consumes a lot of electric energy and water. The model of EL is shown in (1) and (2).
where
GHS is used to store green hydrogen, but the storage technology of current high-pressure gaseous hydrogen storage tank has a certain energy loss during the process of hydrogen energy from input to output, which can be measured by storage efficiency. The state of green hydrogen charge (SOGHC) can be described as expressed in (3).
where
GHFC-CHP uses fuel cells to convert hydrogen into electricity while collecting waste heat for storage or heat load to improve energy efficiency. The model of the GHFC-CHP is shown in (4) and (5).
where
BH-PSUM includes G2H, BHS, and BHFC-CHP. This work uses the currently mature hydrogen production method of natural gas steam reforming combined with pressure swing adsorption (PSA) on G2H to produce blue hydrogen through natural gas, and its main process is as follows: after pressure desulfurization, raw natural gas is mixed with steam at high temperature and then cracked and reformed into conversion gas containing H2, CO, and CO2 under catalytic action. After the conversion, gas is absorbed by the waste heat boiler, and CO in it reacts with water vapor to produce the conversion gas mainly containing H2 and CO2. The conversion gas can be purified by PSA to obtain finished blue hydrogen with a purity of 99.99%, and the PSA tail gas is reused as a fuel. In the whole process of hydrogen production, the mixed conversion requires the mixed fuel composed of burning fuel, natural gas, and analytic gas to supply high temperature, so the process involves CO2 emission and electric energy consumption in the operation of the equipment. The model of G2H can be described as follows:
where
The BHS principle is the same as that of GHS, and (10) represents the state of blue hydrogen charge (SOBHC). Similarly, the principle of BHFC-CHP is the same as that of GHFC-CHP, and its model is shown in (11) and (12).
where the symbols in (10)–(12) are defined as same as those in (3)–(5).
2.3 Models of other devices
EB converts electric energy into heat energy to supply the heat load in the HIES, which is described in (13).
where
HSS is used to store heat energy, and (14) represents its state of green heat charge (SOGHC).
where the symbols in (14) are defined as same as those in (3).
2.4 Dynamic response mechanism of the hydrogen load supply structure
Hydrogen load is the terminal energy directly supplied to the user. In the green hydrogen- and blue hydrogen-coordinated IES, it is supplied by both green hydrogen and blue hydrogen. In this work, the ratio of green hydrogen to blue hydrogen in the hydrogen load supply structure at each time is set as a variable to make the rigid hydrogen load supply structure flexible so that the hydrogen load supply structure can dynamically respond to the changes in hydrogen supply capacity and hydrogen production economy of GH-PSUM and BH-PSUM and further optimize the operation efficiency of the system. The DRM-HLSS is shown in (15)–(19):
where
After the DRM-HLSS is introduced, because the cost of producing green hydrogen by purchasing electricity is much higher than that of blue hydrogen, the priorities of hydrogen production in the system depend on wind abandonment, natural gas, and purchasing electricity. In the supply of hydrogen load, if the wind abandonment used for hydrogen production cannot meet the minimum supply of green hydrogen, the minimum supply ratio of green hydrogen should be satisfied by purchasing power from the grid and outputting hydrogen from GHS, and the rest of the supply should be produced from natural gas. If this requirement can be met, but the wind abandonment is not enough to supply the whole hydrogen load, green hydrogen is produced by wind abandonment and output by GHS, and the remaining part of the hydrogen load is supplied by blue hydrogen. If wind abandonment is sufficient to supply the whole hydrogen load, the whole hydrogen load is supplied by green hydrogen, and the excess hydrogen produced is stored. The hydrogen supply mechanism of the system is shown in Figure 2.
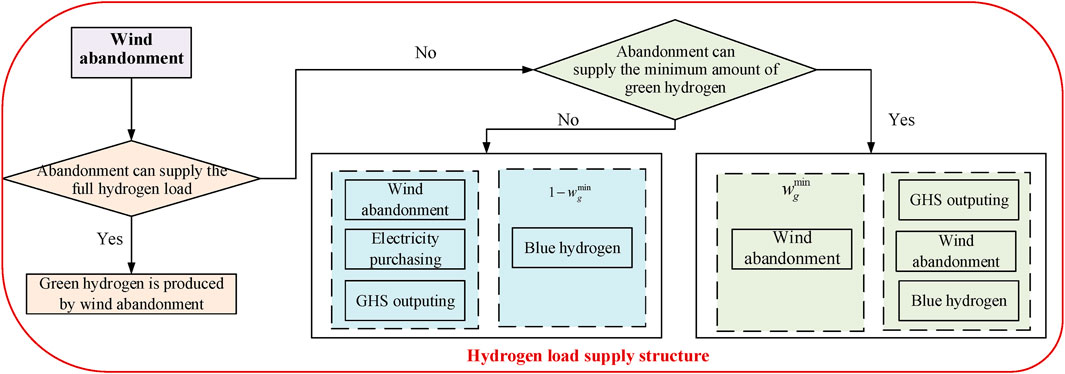
FIGURE 2. Hydrogen supply mechanism of HIES.
3 Mathematical model of HIES operation
3.1 Scheduling model
This work constructs the objective function to minimize the cost, as shown in (20).
Eq. 20 is the objective function of the total cost, including wind power operation and wind abandon penalty cost, energy purchase cost, blue hydrogen purification cost, and carbon trading cost. Eq. 21 represents wind power operation and wind abandonment penalty cost:
where T is the total number of scheduling periods;
The energy purchase cost includes electricity, water, and gas purchase, as shown in (22).
where
The utilization of the PSA technology increases blue hydrogen purity and lowers carbon emissions, but its use is also accompanied by the purification cost, resulting in an increase in the total cost. The purification cost is shown in (23):
where
Carbon emissions will be generated in the operation of HIES, including carbon emissions generated by power generation from the utility grid and hydrogen production from natural gas. Therefore, it is necessary to quantify the cost of carbon emissions and measure the cost of carbon emissions under CTM. Under CTM, system operators need to purchase corresponding carbon quotas in the carbon trading market according to the actual carbon emissions of HIES so as to carry out reasonable and legal carbon emissions in the process of supplying users’ load demands. Enterprises with large-scale carbon emissions generally have free carbon allowances, but the carbon emissions generated by the system constructed in this paper are not large during operation. Therefore, assuming that the system does not have initial free carbon allowances, all the carbon emissions generated must be purchased in the CTM. The calculation of carbon trading costs is described in (24).
where
3.2 Constraints
To ensure that the supply and demand of energy are always in balance, as well as to avoid energy wastage and shortage of energy supply, the operation of the HIES should always maintain the energy balance, including electric energy, heat energy, and hydrogen energy, as shown in (25)–(28). Among them, green hydrogen and blue hydrogen in the system are independently refined utilization, which are modeled as shown in (27) and (28), respectively, under the constraints of hydrogen energy balance.
where
where
The actual output of wind power cannot exceed the maximum output limit, as shown in (34).
The operation of each device must not exceed the upper limit, as shown in (35)–(39).
where
Wind power has significant randomness and volatility. To reduce the pressure of the main network, this paper does not consider the system selling electricity to the main network, but the purchased power must not exceed the port limit, as shown in (40).
where
4 Case study
To evaluate the effectiveness of the proposed scheduling strategy considering CTM and DRM-HLSS, cases are set under different operating scenarios for analysis. The problem is implemented in the YALMIP modeling language as linear programming and solved using the CPLEX optimizer. In this work, the i5-1035G7 CPU @1.20 GHz and 8.00 GB RAM are used for computation hardware, and the optimization is performed in MATLAB (version 2022a).
The scheduling period is 24 h, and the simulation step is set to 1 h to optimize the solution. The prediction curves of electrical load, heat load, hydrogen load, and wind power output inside the system are shown in Figure 3, while the prices of electricity, natural gas, and water are shown in Table 1. The energy storage capacities of GHS, BHS, and HSS devices are set to 100 Nm3, 100 Nm3, and 300 kWh, respectively. The maximum operating power of EB and EL is 600 kW and 500 kW, respectively. The maximum hydrogen production rate of G2H is set to 80 Nm3/h. The maximum power of the GHFC-CHP and BHFC-CHP is set to 150 kW and 50 kW, respectively. The upper limit of the switching power with the grid is set to 600 kW. The corresponding parameters of the HIES are shown in Table 2.
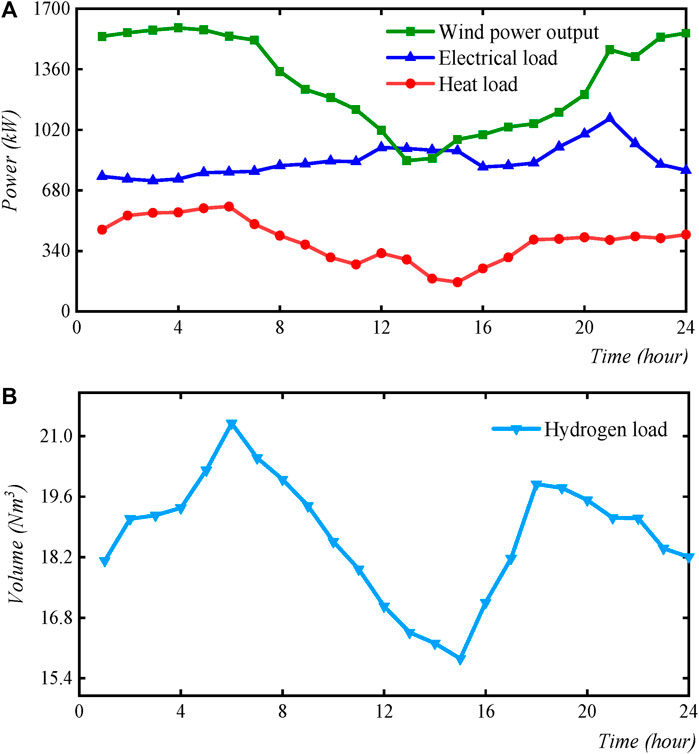
FIGURE 3. Prediction curves of (A) electrical load, heat load, and wind power output; (B) hydrogen load.
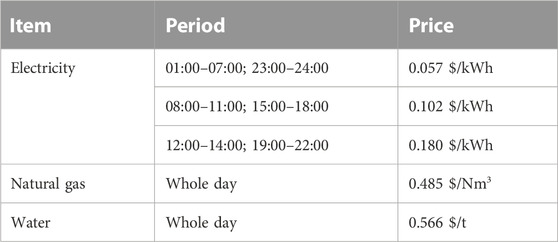
TABLE 1. Purchasing tariffs of the HIES.
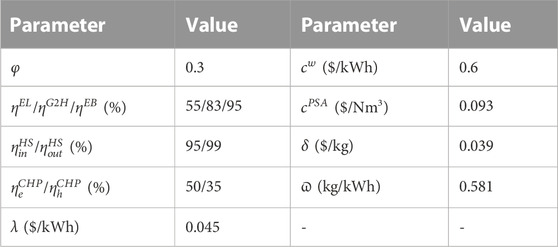
TABLE 2. Required parameters for modeling the HIES.
4.1 Analysis of considering the refined coordinated utilization of multiple hydrogen sources and the DRM-HLSS
To assess the effectiveness of the coordinated utilization of green hydrogen and blue hydrogen, as well as the DRM-HLSS proposed in this study, three different operating scenarios were set for comparative analysis. HIES1 represents a single green hydrogen scenario focused on GH-PSUM. HIES2 represents a traditional hydrogen supply scenario considering the coordinated utilization of green hydrogen and blue hydrogen, with a hydrogen supply structure set at a 1:1 ratio. HIES3 represents a flexible scheduling scenario that considers the coordinated utilization of green hydrogen and blue hydrogen, as well as the DRM-HLSS. The minimum proportion of green hydrogen is set at 0.4. To ensure comparable scheduling flexibility, the capacities of GHS and GHFC-CHP devices in HIES1 are set to equal the combined capacities of green hydrogen and blue hydrogen devices in HIES2. Furthermore, HIES2 and HIES3 have identical device capacities.
Table 3 presents the scheduling results for the three HIESs. The data reveal that in terms of environmental impact, HIES2 demonstrates a 31.78% decrease in carbon emissions compared to HIES1. Additionally, HIES3 achieves a carbon emission reduction of 39.84% relative to HIES1 and 11.80% relative to HIES2. Concerning renewable energy consumption, the curtailment rate of HIES2 is 2.25% higher than that of HIES1. For HIES3, the curtailment rate increases by 0.48% compared to that of HIES1 but decreases by 1.77% compared to that of HIES2. In relation to the total cost, HIES2 has a lower total cost compared to HIES1. Furthermore, HIES3 exhibits a further cost reduction of $31.2 compared to HIES2 and $80.9 compared to HIES1. These findings indicate that the comprehensive consideration of the coordinated utilization of multiple hydrogen sources and the DRM-HLSS leads to significant carbon emission reduction and a relatively balanced utilization of renewable energy. Although the renewable energy utilization rate is lower than that of a single green hydrogen scenario, it has increased compared to the traditional hydrogen supply scenario with a fixed proportion, while also achieving lower total costs, demonstrating improved economic feasibility.
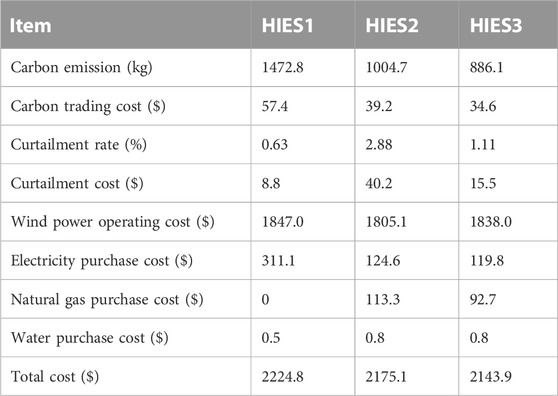
TABLE 3. Comparison of scheduling results of HIESs.
According to the wind curtailment situation of each HIES in Figure 4 and the analysis of carbon emissions and costs associated with hydrogen production, it can be estimated that the carbon emissions of green hydrogen from electricity purchase are 3.738 kg/Nm3, while the carbon emissions of blue hydrogen from natural gas are 0.889 kg/Nm3, implying that under the current carbon emission factor of the grid, the actual carbon emissions from producing green hydrogen by purchasing power from the grid are higher than those from producing blue hydrogen using natural gas through PSA. Additionally, the cost of producing green hydrogen is also higher than that of producing blue hydrogen. In the scenario of solely relying on green hydrogen, the system can only use electrolytic water to produce green hydrogen for the hydrogen load, as the system’s own wind power cannot meet the demand for hydrogen production. Therefore, electricity needs to be purchased from the grid, resulting in a certain amount of carbon emissions and high hydrogen supply costs. By considering the coordinated utilization of green hydrogen and blue hydrogen, a portion of the hydrogen load is replaced by the supply of blue hydrogen, which has lower carbon emissions and costs. As a result, the electricity purchased from the grid is reduced, leading to a reduction in carbon emissions and costs. However, due to the fixed proportion of hydrogen supply, some of the wind power initially allocated for hydrogen production cannot be consumed during periods of low load at night, leading to an increase in wind curtailment. With the inclusion of the DRM-HLSS, the dispatching scheme is further optimized, allowing the system to fully utilize the internal wind power and reduce external hydrogen production, gas purchases, and grid electricity purchases. For this reason, HIES3 is able to achieve a low wind curtailment rate while maintaining lower carbon emissions and operating costs. However, compared with scenario 1, scenario 3 introduces blue hydrogen, whose production cost is much lower than that of green hydrogen. In order to reduce operating costs, part of green hydrogen in the hydrogen load will be replaced by blue hydrogen, and the wind power used to produce this part of green hydrogen will not be able to be absorbed, so the wind curtailment in scenario 3 is slightly higher than that in scenario 1.

FIGURE 4. Wind power output in each HIES.
Under the HIES3 model, Figure 5 depicts the operation of each device in a system dispatching cycle, while Figure 6 shows the dynamic supply structure of hydrogen load. During the low-load period from night to morning, wind power is sufficient to meet the demand for electric load and electric boiler heat load. Excess wind power is then used to produce green hydrogen, with the whole hydrogen load being supplied by green hydrogen and any remaining excess being stored. Additionally, a small amount of blue hydrogen is produced using low-cost electricity for storage. During the high-load and flat-load stages from morning to night, wind power alone cannot satisfy the electric heating load. Therefore, electricity purchasing, hydrogen cogeneration operation, and wind power are combined to achieve the electric and heating balance. During this period, green hydrogen generation is absent, so blue hydrogen is primarily used to supply the hydrogen load, while the hydrogen storage tank continuously outputs green hydrogen to meet the minimum demand. It is evident that by considering the DRM-HLSS, the flexibility of system scheduling improves, allowing for dynamic optimization of the hydrogen load supply structure based on wind power output. This approach also reduces wind power output fluctuations and enhances wind power absorption capacity through flexible adjustment of each device’s output.
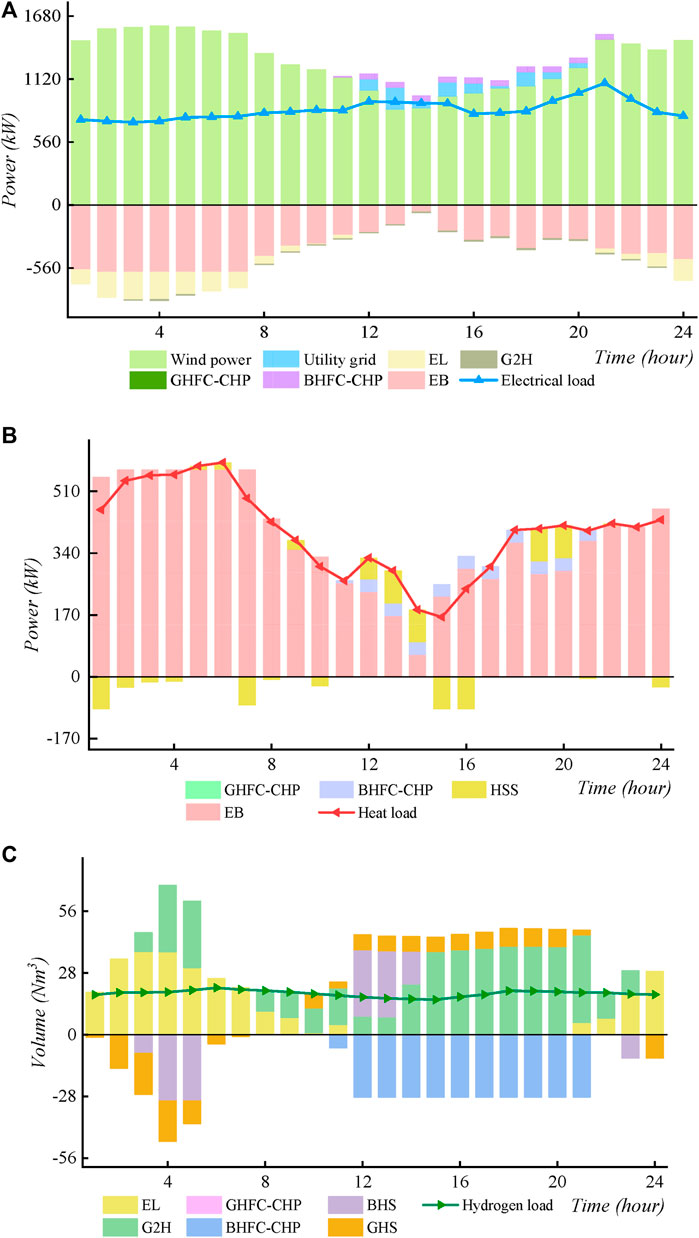
FIGURE 5. Results of (A) electricity, (B) heat, and (C) hydrogen balance considering the refined coordinated utilization of multiple hydrogen sources and the DRM-HLSS.
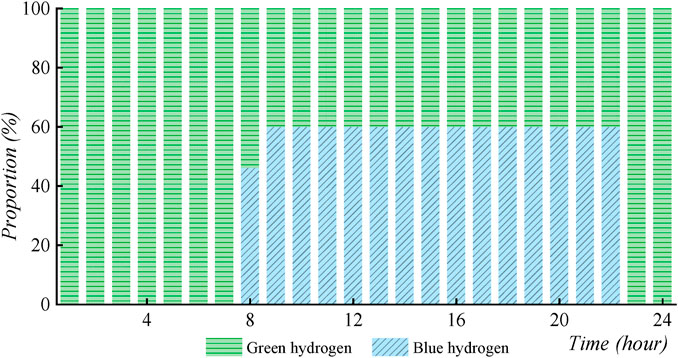
FIGURE 6. Hydrogen load supply structure in HIES3.
4.2 Analysis of considering the CTM
To analyze the effectiveness of the CTM after careful consideration, HIES4 was configured to include the coordinated utilization of green hydrogen and blue hydrogen, as well as the DRM-HLSS system, excluding the CTM. The scheduling results of HIES4 and HIES3 mentioned previously are presented in Table 4. As shown in the table, the carbon emissions of HIES3 are 113.5 kg lower than those of HIES4, representing a reduction of 11.4%. This demonstrates that considering the carbon trading mechanism can effectively achieve the goal of carbon reduction.

TABLE 4. Comparison of scheduling results of the HIESs.
Further analysis reveals that without considering the carbon trading mechanism, power purchased from the grid has no restrictions on carbon emissions. In such cases, the cost of directly using electric energy is lower than that of hydrogen energy. Due to the anti-peak regulation characteristic of wind power, the load of wind power is low, its output is high during periods of low electricity prices, and, during the remaining periods, the output is small and even insufficient to meet the demand for electric heating load. To address this, the system chooses to increase the purchase of parity electricity during the flat-load stage to supply electricity and heating load, thereby reducing the operation of the hydrogen cogeneration device, which only runs during periods of high load. Additionally, the supply of green hydrogen produced by electricity in the hydrogen load is also increased. When considering the carbon trading mechanism, not only the hydrogen load but also the conversion and utilization of hydrogen energy are increased, resulting in higher costs but lower carbon emissions. The operation of all devices takes into account the requirements of low cost and low carbon emissions, ultimately obtaining a low carbon dispatching scheme with slightly higher costs but less carbon emissions.
Different grid carbon emission factors can affect the operation of the system. In fact, these factors are constantly changing as the proportion of renewable energy increases. Therefore, it is necessary to analyze the system’s operation results as these factors change.
The operation results of HIESs under different grid carbon emission factors are shown in Figure 7. It can be observed that as the grid carbon emission factor decreases, both the total cost and carbon emission of HIES1 and HIES3 show a gradually decreasing trend. The total cost of HIES3 declines more slowly than that of HIES1, but it is always lower. Similarly, the decline in carbon emissions of HIES3 is consistently slower than that of HIES1, with an initial slow trend followed by a faster decrease. At approximately 0.2 kg/kWh grid carbon emission factor, the carbon emission curves of the two HIESs intersect. From that point onward, the carbon emission of HIES1 is consistently lower than that of HIES3. This is because HIES1 relies more on purchasing electricity and is greatly influenced by changes in the grid’s carbon emission factors. However, the production cost of green hydrogen is higher than that of blue hydrogen, resulting in a higher total cost for HIES1. It can be observed that under the continuous reduction in the grid carbon emission factor, a single green hydrogen system will have a lower carbon footprint compared to a coordinated green hydrogen and blue hydrogen system.
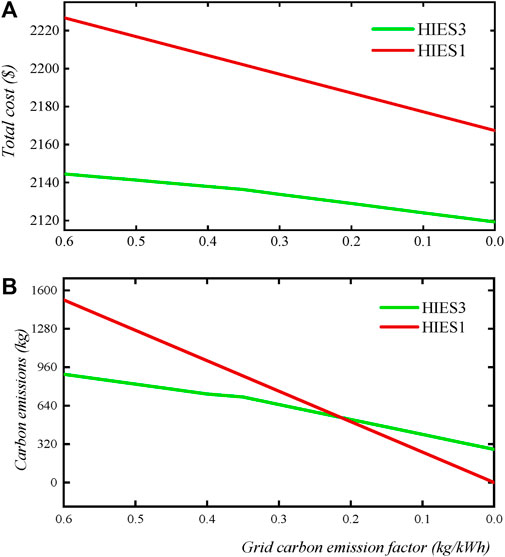
FIGURE 7. Impacts include (A) total cost and (B) carbon emissions of different grid carbon emission factors on two HIESs.
5 Conclusion
This study considers the refined coordinated utilization of multiple hydrogen sources, the DRM-HLSS, and the CTM, constructing a low-carbon economic dispatching model for HIES. By solving and analyzing the dispatching scheme, it is found that the refined coordinated utilization of green hydrogen and blue hydrogen, along with the DRM-HLSS, can simultaneously ensure high renewable energy consumption, reduce carbon emissions, and lower operating costs. The DRM-HLSS improves system scheduling flexibility, reduces wind power output fluctuations, and enhances wind power consumption capability. Additionally, the introduction of a CTM restricts carbon emissions in the comprehensive energy system, achieving carbon emission reduction goals and promoting greater utilization of hydrogen energy. It is worth noting that the current coordination system between green hydrogen and blue hydrogen effectively leverages the economic benefits of fossil fuels and the low-carbon nature of carbon capture technology. However, as the carbon emission factor of the power grid continues to decrease in the future, this system will no longer offer advantages in terms of economy and low carbon emissions. Consequently, the operation of HIES should gradually transition toward a single green hydrogen system, aligning with reduced carbon emission factors of the power grid.
For future work, it is recommended to consider flexible load demand response mechanisms, such as electricity and heat, in the optimization scheduling of the system for further research. Additionally, the uncertainty of renewable energy output should be taken into account in subsequent optimization scheduling research to ensure that the scheduling results align more closely with actual conditions.
Data availability statement
The original contributions presented in the study are included in the article/Supplementary Material; further inquiries can be directed to the corresponding author.
Author contributions
ZL: methodology and writing—review and editing. YZ: data curation and writing—original draft. PW: writing—review and editing.
Funding
The author(s) declare that financial support was received for the research, authorship, and of this article. This work was supported by the National Natural Science Foundation of China (NO. 52307098) and Fundamental Research Funds for the Central Universities (NO. 2023MS099).
Conflict of interest
The authors declare that the research was conducted in the absence of any commercial or financial relationships that could be construed as a potential conflict of interest.
Publisher’s note
All claims expressed in this article are solely those of the authors and do not necessarily represent those of their affiliated organizations, or those of the publisher, the editors, and the reviewers. Any product that may be evaluated in this article, or claim that may be made by its manufacturer, is not guaranteed or endorsed by the publisher.
Supplementary material
The Supplementary Material for this article can be found online at: https://www.frontiersin.org/articles/10.3389/fenrg.2023.1270866/full#supplementary-material
References
Chang, H. G. (2021). Technology and economic analysis of hydrogen production from natural gas. Chem. Eng. Oil Gas. 50 (04), 53–57. doi:10.3969/j.issn.1007-3426.2021.04.008
Chen, J. P., Hu, Z. J., Chen, Y. G., Chen, J. B., Chen, W. N., Gao, M. X., et al. (2021). Thermoelectric optimization of integrated energy system considering ladder-type carbon trading mechanism and electric hydrogen production. Electr. Power Autom. Equip. 41 (09), 48=55. doi:10.16081/j.epae.202109032
Cui, Y., Yan, S., Zhong, W. Z., Wang, Z., Zhang, P., and Zhao, Y. T. (2020). Optimal thermoelectric dispatching of regional integrated energy system with power-to-gas. Power Syst. Technol. 44 (11), 4254–4264. doi:10.13335/j.1000-3673.pst.2019.2468
Fang, X. L., Dong, W., Wang, W. B., Yang, Q., and Sun, S. Y. (2023). Optimal energy management of multiple electricity-hydrogen integrated charging stations. Energy 262, 125624. doi:10.1016/j.energy.2022.125624
Fang, X. L., Wang, W. B., Dong, W., and Yang, Q. (2022). Multiple time-scale energy management strategy for a hydrogen-based multi-energy microgrid. Appl. Energ 328, 120195. doi:10.1016/j.apenergy.2022.120195
Li, B., Roche, R., Paire, D., and Miraoui, A. (2017). Sizing of a stand-alone microgrid considering electric power, cooling/heating, hydrogen loads and hydrogen storage degradation. Appl. Energ 205, 1244–1259. doi:10.1016/j.apenergy.2017.08.142
Li, H. R., Xue, Y. X., Dai, T. C., Chang, X. Y., Pan, Z. G., and Sun, H. B. (2013). Collaborative optimal dispatch of electricity–hydrogen coupling system in chemical industry park considering hydrogen load response. Adv. Eng. Sci. 55 (01), 93–100. doi:10.15961/j.jsuese.202200939
LiLiu, Y. Z. H., Sang, Y. F., Hu, J. F., Li, B. J., Zhang, X. Y., et al. (2023). Optimization of integrated energy system for low-carbon community considering the feasibility and application limitation. Appl. Energ 348, 121528. doi:10.1016/j.apenergy.2023.121528
Pan G S, G. S., Gu, Z. F., Luo, E. B., and Gu, W. (2023). Analysis and prospect of electricity hydrogen production technology under background of new power system. Automation Electr. Power Syst. 47 (10), 1–13. doi:10.7500/AEPS20220630003
Pan, G. S., Gu, W., Qiu, H. F., Lu, Y. P., Zhou, S. Y., and Wu, Z. (2020a). Bi-level mixed-integer planning for electricity-hydrogen integrated energy system considering levelized cost of hydrogen. Appl. Energ 270, 115176. doi:10.1016/j.apenergy.2020.115176
Pan, G. S., Gu, W., Zhang, H. Y., and Qiu, Y. (2020b). Electricity and hydrogen energy system towards accomodation of high proportion of renewable energy. Automation Electr. Power Syst. 44 (23), 1–10. doi:10.7500/AEPS20200202003
Pan, Z. N., Liang, N., Xu, H. H., Zheng, F., He, X. Y., and Zhang, J. Y. (2023). Cooperative operation strategy of wind power-virtual hydrogen plant participating in spot market based on Nash bargaining theory. Electr. Power Autom. Equip. 43 (05), 129–137. doi:10.16081/j.epae.202301008
Wen, X., and Tian, Y. (2022). Beijing Winter Olympics accelerates the upgrading of hydrogen energy industry. Intell. Connect. Veh. 2022 (02), 80–82.
Wu, P. L., Wang, W. Q., Fan, X. C., Shi, R. J., and Cheng, Z. J. (2022). Optimized configuration of hydrogen storage in the park's integrated energy system for hydrogen production from natural gas. Sci. Technol. Eng. 22 (26), 11409–11417. doi:10.3969/j.issn.1671-1815.2022.26.019
Xiao, Q. Y., Yang, J., and Song, Z. X. (2022). Scheduling strategy of industrial parks integrated energy system considering carbon trading and electric vehicle charging load. High. Volt. Eng. 49 (04), 1392–1401. doi:10.13336/j.1003-6520.hve.20220864
Xu, G. Z., Liang, D. X., Song, J., Kang, W., Zhao, X. Y., and Gao, J. (2023). Day-Ahead economic dispatch of wind-photovoltaic-HESS-BESS integrated energy system. Mod. Electr. Power, 1–8. doi:10.19725/j.cnki.1007-2322.2022.0116
Zhang, W., Fang, B., Sun, L., Zhang, X., Liu, J., Yang, Y., et al. (2022). Roles of NOD1/Rip2 signal pathway in carotid artery remodelling in spontaneous hypertensive rats. Pet. Petrochem. Today 30 (07), 31–42. doi:10.4149/gpb_2021042
Zhao, Y. L., Cao, T. T., Zhang, C. X., and Lin, W. (2022). Progress and cost analysis of centralized hydrogen production technology. Pet. Process. Petrochem 53 (10), 122–126. doi:10.3969/j.issn.1005-2399.2022.10.034
Keywords: refined utilization of hydrogen, integrated energy system, dynamic response mechanism of hydrogen load supply structure, carbon trading mechanism, coordination and complementarity
Citation: Li Z, Zhao Y and Wu P (2023) Optimal energy management of an integrated energy system with multiple hydrogen sources. Front. Energy Res. 11:1270866. doi: 10.3389/fenrg.2023.1270866
Received: 01 August 2023; Accepted: 23 August 2023;
Published: 08 September 2023.
Edited by:
Kaiping Qu, China University of Mining and Technology, ChinaReviewed by:
Tong Qian, South China University of Technology, ChinaZhenning Pan, South China University of Technology, China
Copyright © 2023 Li, Zhao and Wu. This is an open-access article distributed under the terms of the Creative Commons Attribution License (CC BY). The use, distribution or reproduction in other forums is permitted, provided the original author(s) and the copyright owner(s) are credited and that the original publication in this journal is cited, in accordance with accepted academic practice. No use, distribution or reproduction is permitted which does not comply with these terms.
*Correspondence: Pei Wu, d3VwZWlfbmNlcHVAMTYzLmNvbQ==