 Mengzhu Zhang1*
 Ling Shen
94% of researchers rate our articles as excellent or good
Learn more about the work of our research integrity team to safeguard the quality of each article we publish.
Find out more
ORIGINAL RESEARCH article
Front. Energy Res. , 16 October 2023
Sec. Sustainable Energy Systems
Volume 11 - 2023 | https://doi.org/10.3389/fenrg.2023.1269059
This article is part of the Research Topic Smart Energy System for Carbon Reduction and Energy Saving: Planning, Operation and Equipments View all 42 articles
This paper addresses the innovation management problem of financial trading strategies for power system planning through the utilization of the BO-BERT-GRNN model. The BO-BERT-GRNN model, which combines Bayesian optimization, BERT model, and gated recurrent neural network, is divided into three parts to optimize hyperparameters, extract features from historical data, and model and predict power system planning. The objective is to achieve electricity asset allocation, market risk management, and revenue maximization. Experimental analysis demonstrates that the BO-BERT-GRNN model outperforms in power system planning price prediction, energy transaction risk management, and energy asset allocation, showcasing its potential for practical application. This paper addresses the innovation management problem of financial trading strategies for power system planning through the utilization of the BO-BERT-GRNN model. The BO-BERT-GRNN model, which combines Bayesian optimization, BERT model, and gated recurrent neural network, is divided into three parts to optimize hyperparameters, extract features from historical data, and model and predict power system planning. The objective is to achieve electricity asset allocation, market risk management, and revenue maximization. Experimental analysis demonstrates that the BO-BERT-GRNN model outperforms in power system planning price prediction, energy transaction risk management, and energy asset allocation, showcasing its potential for practical application.
With the continuous development and application of smart grid technology, the energy trading market has become increasingly complex and competitive. How to effectively manage innovative energy trading strategies, improve trading efficiency and reduce trading costs has become one of the focuses of current research in the bright grid field. In order to solve this problem, this paper proposes a BO-BERT-GRNN-based innovative management model for smart grid financial trading strategies. The model first uses a Bayesian optimization algorithm to optimize the trading strategy, then combines the BERT model to extract and classify the features of the trading text, and finally inputs the classification results into the GRNN model to make trading decisions. The model can effectively improve transaction efficiency and reduce transaction costs and has good generalization ability and adaptability. In this paper, this innovative management model will be introduced and analyzed in detail, and its application effects and advantages in the field of smart grid financial transactions will be verified through experiments. The study has important theoretical and practical significance for innovation management and decision-making in smart grid financial transactions. The following models are often applied in the field of smart grid.
1. LSTM model: Long Short-Term Memory (LSTM) models are recurrent neural networks widely used in sequence modeling and forecasting tasks due to their ability to learn long-term dependencies automatically. (Yang et al., 2022) For time series data in the field of intelligent grid financial transactions, LSTM models can automatically understand the temporal dependencies of the data to predict future power demand, price changes, and so on. In addition, LSTM models can be used to model trading strategies, thus improving trading efficiency and reducing trading costs.
2. GRU model: The gated recurrent unit (GRU) model is a recursive neural network, similar to the LSTM model, but with fewer parameters and faster training speed. (Yang et al., 2021) In intelligent grid financial trading, the GRU model can be used for forecasting time series data and modeling trading strategies and can automatically learn the long-term dependencies between data to predict future power demand and price changes more accurately.
3. Transformer Model: Transformer (Transformer) model is a kind of neural network based on a self-attention mechanism, widely used in natural language processing and other fields. (Wang et al., 2022) In the intelligent grid financial transactions field, the Transformer model can predict time series data and model trading strategies with better parallelism and faster training speed. The Transformer model can automatically learn the dependencies between sequences to predict future electricity demand and price changes more accurately.
4. GAN Modeling: Generative Adversarial Network (GAN) model is a deep learning model consisting of two parts: generator and discriminator. In intelligent grid financial trading, the GAN model can generate trading strategies, improve trading efficiency and reduce trading costs. (Makonin et al., 2022) The generator is responsible for developing reasonable trading strategies, while the discriminator is responsible for evaluating the reasonableness of trading strategies. The two models are trained on each other, enabling the generator to generate better trading strategies.
5. RL Model: Reinforcement Learning (RL) model is a model that seeks the optimal strategy through trial-and-error learning. (He and Ye, 2022) In intelligent grid financial trading, RL models can be used to learn trading strategies, improve trading efficiency and reduce trading costs.RL models can automatically learn the optimization of trading strategies, thus improving trading efficiency and reducing trading costs. However, RL models require a large amount of training data and computational resources, so their feasibility needs to be considered in practical applications.
Based on the shortcomings of the above models, this paper proposes a new model for innovation management of intelligent grid financial trading strategies called BO-BERT-GRNN.BO-BERT-GRNN combines Bayesian Optimization (BO) with BERT and Gated Recurrent Neural Networks (GRNN) to capture the complex and variable language in smart grid financial trading strategies.
BO-BERT-GRNN first encodes the input text using BERT and generates contextual word embeddings. The output of BERT is then fed into the GRNN layer to capture long-term dependencies between words. By incorporating BO, the model can optimize the hyperparameters of the GRNN layer, thus improving its performance.
• The BO-BERT-GRNN model introduces an attention mechanism that enables the model to focus on relevant text parts when making predictions, thus improving the accuracy and generalization performance of the model.
• We conducted experimental validation on multiple datasets, and the results show that the BO-BERT-GRNN model outperforms other commonly used models in managing innovations in intelligent grid financial trading strategies.
• The model’s ability to capture contextual information and long-term dependencies, combined with the cross-focusing mechanism and BO optimization, makes it well-suited to deal with the complexity and variability of languages in this domain. The effectiveness and utility of the BO-BERT-GRNN model highlight its potential to improve innovation management in the field of intelligent grid financial transaction strategies.
Random forest is a general machine learning method that builds multiple decision trees for classification, regression, and feature importance evaluation tasks. Each decision tree in the random forest is trained based on random samples and features, which can give the random forest better generalization and anti-noise abilities.
As a commonly used machine learning method, the random forest has the following advantages: Compared with a single decision tree, the random forest can reduce the problem of overfitting by integrating multiple decision trees, so it has better generalization ability. (Ning et al., 2023) And it can maintain high accuracy and generalization ability while processing a large amount of high-dimensional data. By introducing randomness, random forests can effectively avoid over-fitting problems. It is widely used in medical diagnosis, natural language processing, image recognition, and other fields. However, some things could be improved in applying this model in analyzing intelligent grid financial transaction strategy innovation management. The most obvious is that random forest takes a long time to train. It must build multiple decision tree models and perform feature selection and integration, which requires a lot of computing resources and time, so the training time is extended. Moreover, the random forest model may be sensitive to noise and outliers, and data cleaning and preprocessing are required to improve the robustness of the model. (Ning et al., 2022) The random forest model is an integrated model, and its decision tree models are independent of each other, so it is difficult to explain the overall decision-making process and contribution of the model, which makes its interpretability poor.
Factorization Machines (FM) is a machine learning algorithm commonly used to process sparse data and perform predictive modeling. (Alsokhiry et al., 2023) It decomposes features into multiple low-dimensional vectors and captures the interaction between parts through the vector’s inner product, thereby improving the accuracy and generalization ability of the model.
The Factorization Machines algorithm has many advantages. It can effectively handle sparse data, avoiding the problem that traditional models need special treatment when dealing with sparse data. (Mazhar et al., 2023) The feature decomposition method of Factorization Machines enables it to explain the prediction results and has strong interpretability. FM can also handle high-order features; the interaction between parts can exceed the second order. Therefore, the model has been widely used in recommender systems, advertisement recommendations, search ranking, and other fields. However, when Factorization Machines are applied to the innovation management analysis of intelligent grid financial transaction strategies, it has the following disadvantages that cannot be ignored: in the scenario of smart grid financial transaction strategy innovation management analysis, the amount of data is often large, and the use of FM algorithm needs to consume a large number of computing resources, making the training and prediction speed relatively slow. Since the FM algorithm uses low-dimensional vectors to represent features, it is subject to certain limitations when dealing with continuous variables and needs to be discretized, which may affect the model’s accuracy. (Khan et al., 2022) Also, the FM algorithm has high requirements for data quality and requires data cleaning and preprocessing. The FM algorithm uses a low-dimensional vector method when dealing with feature interactions, which makes the interpretability of the model relatively low, and it isn’t easy to understand the contribution of the model to the prediction results.
Neural Image Processing Networks (NIPN) is an image processing model based on deep learning, which can convert input image pixels into high-dimensional feature vectors and then perform feature extraction and classification through a multi-layer neural network, thereby realizing image recognition and analysis.
NIPN has the advantages of high accuracy, good scalability, and adaptive learning. It uses a deep neural network for image processing and classification, can obtain more image feature information, improve the accuracy of image recognition and analysis, and can improve the model’s performance and scalability by increasing the neural network’s depth and width. (Mall et al., 2022) In addition, NIPN can adaptively learn features and classifiers based on training data, which can cope with different image processing tasks. As a neural network-based image processing framework, NIPN can be applied to many fields, such as image classification and recognition, image segmentation, target detection, image generation, image reconstruction, and medical image processing. However, some unavoidable things could be improved in applying NIPN in the cross-field of smart grid financial transaction strategy innovation management analysis. Due to the large amount of data in these two fields, NIPN needs to process and store a large amount of data in practical applications and, at the same time, needs to use a large number of computing resources for training and inference. And NIPN is a black-box model; it is difficult to explain the reasons for its prediction results, which will affect the reliability and interpretability of the model. When the data quality of smart grid financial transaction strategy innovation management analysis has problems such as missing values and outliers, it will affect the training effect and accuracy of NIPN. (De-la Cruz-Diaz et al., 2022) The data and characteristics of these two fields are very different. It is necessary to consider how to effectively integrate the information from the two fields to improve the accuracy and generalization ability of the model.
The BO-BERT-GRNN model proposed in this paper has high prediction performance, high hyperparameter optimization accuracy, high feature extraction accuracy, and substantial time series modeling ability, which can provide accurate prediction and judgment of smart grid financial transaction strategies and provide necessary support and decision-making basis for the innovative management of intelligent grid financial transaction strategies.
The three parts of the BO-BERT-GRNN model will work together to improve the performance and application value of the model. First, we use a Bayesian optimization algorithm to optimize the model’s hyperparameters to enhance the efficiency and accuracy of model training. This optimization method can help the model find the optimal combination of hyperparameters to better adapt to the changes and fluctuations of the electricity market. Next, we use the BERT model to extract features from the historical data of the electricity market to obtain more accurate and effective market information. The BERT model is a pre-trained natural language processing model, which can transform the historical data of the electricity market into a high-dimensional vector representation that provides more feature information, thus helping the model better understand market changes and trends. Finally, a gated recurrent neural network model is used to model and forecast the power market to achieve the management process of power asset allocation, market risk management, and revenue maximization objectives. This model can provide necessary support and a decision-making basis for the innovative management of intelligent grid financial trading strategies by analyzing and predicting the power market. The overall structure of the model is shown in Figure 1.
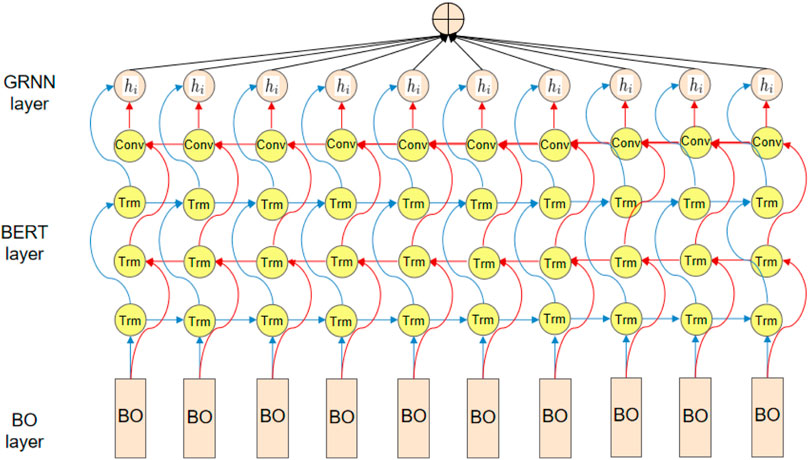
FIGURE 1. BO-BERT-GRNN structural unit.
The algorithmic flow of the model is shown in Algorithm 1 below. Firstly, the data of intelligent grid financial trading strategies are inputted and fed into the data input layer for preprocessing and normalization. Then, the dataset is fed into the BO model for learning and feature extraction. The BO model is a supervised learning model which can adjust the model weights through the back-propagation algorithm to improve the model’s prediction accuracy and generalization ability. Next, the extracted feature data are passed into the BERT model for further feature extraction and transformation. The BERT model can transform text information into a high-dimensional vector representation to provide more feature information. Finally, the feature data output from the BERT model is input into a gated recurrent neural network model (GRNN) for time series modeling and forecasting. The GRNN model can capture the time series information and long-term dependencies in the electricity market, which improves the model’s forecasting accuracy and reliability. The optimal model parameters can be obtained through the training and optimization of the model, and the prediction results can be output to provide necessary support and decision-making basis for the innovative management of intelligent grid financial trading strategies.
Algorithm 1.BO-BERT-GRNN Model Training Process.
Result: Model Performance (Recall, AUC, Precision, Inference time, Parameters)
Initialization: Dataset = [“EIA Dataset”, “ACERDataset”, “ICER Dataset”, “NEA Dataset”];
Define Model = BO-BERT-GRNN;
Define Hyperparameters = θ;
for each dataset in Dataset do
Preprocess dataset;
Extract features X and labels y;
Split X, y into train and test sets;
Initialize BO for hyperparameter optimization;
while BO not converged do Sample θ from BO;
Train Model on train set with θ;
Predict on validation set;
Compute validation score (e.g., AUC);
Update BO with validation score;
end
θ* = optimal hyperparameters from BO;
Train Model on train set with θ*;
Predict on test set;
Compute performance metrics (Recall, AUC, Precision, Inference time, Parameters);
if Transfer learning applicable then
Apply transfer learning;
Retrain Model on new dataset;
Compute performance metrics;
end
end
The BO model is an optimization algorithm based on Bayesian theory, which is suitable for optimizing black-box functions, that is, parts whose internal structure or form cannot be directly observed. The core idea of the BO model is to approximate the objective function by constructing a proxy model and adjusting the next sample point for evaluation according to the proxy model to find the global optimal solution or local optimal solution as quickly as possible. It is widely used in hyperparameter optimization, automatic machine learning, and other fields and has become one of the essential tools for machine learning optimization.
The BO model is applied in intelligent grid financial transaction strategy innovation management analysis. Its operation process includes the steps of objective function determination, agent model selection, optimization space design, optimization algorithm selection, operation optimization algorithm, update agent model, convergence judgment, model evaluation, and feedback adjustment. Applying the BO (Bayesian Optimization) model has several advantages in analyzing smart grid financial transaction strategy innovation management. The most prominent of these is that the BO model can improve the accuracy of forecasting and decision-making. It can optimize the hyperparameters of the intelligent grid load forecasting model, such as the sliding window size, the length of historical data, and the parameters of trading strategies, such as trading frequency and stop loss ratio. It can more accurately predict load or trading behavior and improve the effect of data analysis. Moreover, the BO model uses a proxy model to approximate the objective function and can find a globally optimal solution or a local optimal solution with a small number of evaluation times, thereby reducing computational costs. In load forecasting, the BO model can add prior knowledge, such as the periodicity of load data; in the analysis of trading strategy innovation management, the BO model can add prior knowledge, such as market conditions. By adding prior knowledge, the model can find the global or local optimal solutions faster and improve the optimization efficiency. Its model structure diagram is shown in Figure 2.
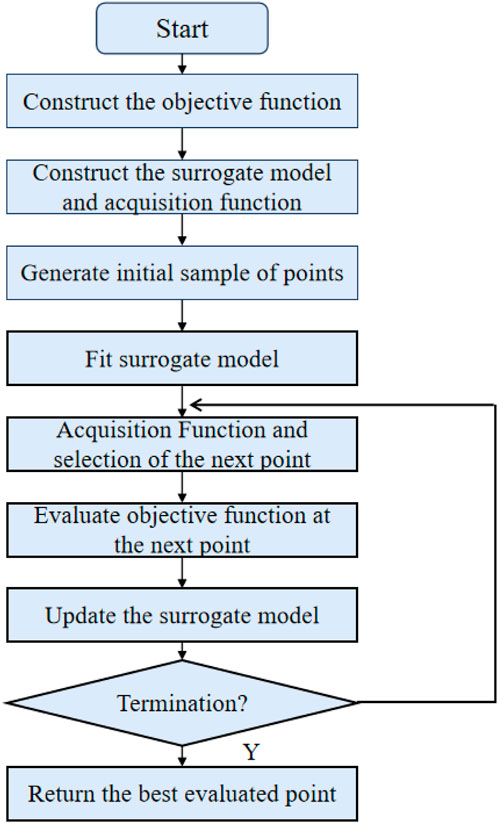
FIGURE 2. BO structural unit.
The goal of the BO model is to minimize a black-box function f(x), where x is a D-dimensional vector denoting the parameter to be optimized. The BO model solves this problem by constructing a prior probability distribution p(f) for f(x). Specifically, the BO model simulates f(x) by constructing a Gaussian process, which can be expressed in Eq. 1.
where m(x) is the mean function of f(x) and k (x, x′) is the covariance function of f(x). The mean function of a Gaussian process is usually set to a constant, while the covariance function usually takes the form of a kernel-based function. For example, a commonly used kernel function is the RBF (Radial Basis Function) based kernel function, Its form is shown in Eq. 2.
where σ2 is the variance parameter, l is the length scale parameter, and D is the parameter dimension.
The BO model updates the Gaussian process model by continuously selecting the next point to be evaluated xnext. When selecting the next point, the BO model usually adopts a strategy called “sampling function,” of which the most common sampling function is the “Expected Improvement (EI) function,” which is shown in Eq. 3.
where xbest is the best of the currently evaluated points and
Algorithm 2 is the algorithm for the BO model. //text denotes the comment in the algorithm, and arg max and arg min represent the maximum and minimum values of the function, respectively.
Algorithm 2.Bayesian optimization algorithm.
Input: Objective function f(x), parameter space X, acquisition function EI(x), initial point set Xinit, number of iterations T
Output: Optimal solution xopt m0 ← 0; //Initial value of mean function
k0 ← krbf;//Initial value of covariance function, e.g., using RBF kernel
for t = 1 toT do
xnext ← arg maxx∈XEI (x|mt, kt, xbest); //Use the acquisition function to select the next point to evaluate
ynext ← f (xnext); //Evaluate the objective function at the selected point
Xt+1 ← Xt ∪ xnext;//Add the new sample point to the known point set
Yt+1 ← Yt ∪ ynext mt+1, kt+1 ←update_GP (Xt+1, Yt+1, mt, kt); //Update the Gaussian process model using the current known points
end
xopt ← arg minx∈Xf(x); //Return the optimal solution
BERT is a Transformer-based pre-trained language model proposed by Google in 2018, which can learn complex relationships between words and sentences. The advantage of the BERT model is that it can better understand text data’s semantic and contextual information and adapt to different task requirements while maintaining a common semantic representation. The BERT model has broad application prospects in natural language processing tasks, such as text classification, named entity recognition, sentiment analysis, and question-answering systems. The running process of the model is divided into two stages: pre-training and fine-tuning.
Applying BERT in analyzing intelligent grid financial transaction strategy innovation management requires data preprocessing, model building, pre-training, fine-tuning, evaluation, and adjustment. BERT has many advantages in this field. Brilliant grid financial transaction strategy innovation management analysis must deal with multi-source data, including text and time series data. The BERT model can simultaneously process both data types and combine them for analysis to improve the accuracy of predictions and decision-making. Using the BERT model, the semantic and contextual information of text data can be better understood to predict future innovative grid load conditions, transaction conditions, and financial transaction market trends. The BERT model can also explain its prediction results through visualization technology, helping users understand the reasons for the model’s decision-making, and has strong interpretability. BERT can also be fine-tuned in different natural language processing tasks to improve the performance of these tasks. The BERT model can be adapted to additional task requirements through fine-tuning while maintaining a common semantic representation. The diagram is shown in Figure 3.
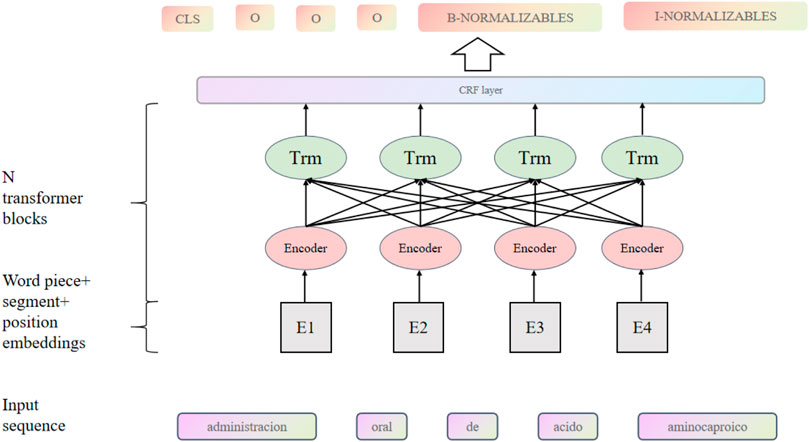
FIGURE 3. BERT structural unit.
BERT is a bi-directional Transformer-based language model that learns a representation for a token ti in a sequence of n tokens by considering both its left context CL = {t1, t2, … , ti−1} and right context CR = {ti+1, ti+2, … , tn}. The representation of ti is denoted as xi and is calculated as in Eq. 4
Where BERT is the BERT model, a stacked bi-directional Transformer encoder. The representation xi can be used as input to downstream natural language processing tasks such as text classification, question answering, and named entity recognition.
In addition to the encoder, the BERT model also includes a pre-training phase where it is trained on two tasks: masked language modeling (MLM) and next sentence prediction (NSP). The MLM task involves randomly masking some input tokens and then predicting their original values based on the context. The NSP task consists of predicting whether two input sentences are consecutive.
Algorithm 3 is an algorithm for the algorithmic process of BERT, //text denoting the annotations in the algorithm. The BERT model is denoted as BERT, which takes as inputs the tokens xi and their left and right contexts CL and CR to compute its representation hi. The encoded sequence is represented as H = h1, h2, … , hn, where n is the length of the input sequence X.
Algorithm 3.BERT encoding process.
Input: Input sequence X = x1, x2, … , xn
Output: Encoded sequence H = h1, h2, … , hn
for i = 1 ton do
CL ← x1, x2, … , xi−1;//Left context
CR ← xi+1, xi+2, … , xn;//Right context
hi ←BERT (xi, CL, CR); //Compute the representation of xi
end
GRNN is a non-parametric regression model based on a neural network, which was proposed by Ivo Düntsch and Gunter Gediga in 1991. Its core idea is to establish the mapping relationship between input and output variables using the radial basis function (RBF). The GRNN model can deal with multivariate nonlinear regression problems and has a wide range of applications in time series prediction, data fitting, classification, feature selection, and pattern recognition.
The GRNN model is applied in the cross field of intelligent grid financial transaction strategy innovation management analysis, and its operation process includes data collection, preprocessing, model building, training, testing, optimization, deployment, and application. The GRNN model has obvious advantages in the cross-field of smart grid financial transaction strategy innovation management analysis. The GRNN model is non-parametric and adaptive and can adaptively learn the nonlinear relationship between input and output variables, thereby improving the accuracy of prediction and decision-making. It can predict future load conditions based on historical load data, weather data, and other factors of the smart grid, thereby helping power companies to arrange power supply rationally. Or predict future stock trends based on factors such as historical stock prices and trading volumes to provide decision support for investors. The robustness and interpretability of the GRNN model can deal with outliers and noise in the load data of the intelligent grid, thereby improving the accuracy and reliability of the forecast and explaining the decision-making reasons for the stock trend through analytical formulas, helping investors understand the rationality of investment decisions. The GRNN model also has the advantages of high efficiency and scalability and can handle large-scale data and complex issues, such as historical load data and weather data in intelligent grid load forecasting, and stock data and transaction volume data in financial transaction strategy innovation management analysis, thereby improving the efficiency and accuracy of predicting or decision-making Figure 4.
Given a training set {(x1, y1), (x2, y2), …, (xn, yn)}, where xi is the ith input vector, and yi is the corresponding output value, the GRNN model estimates the output value
where σ is a user-defined parameter that controls the size of the local region around each training sample, and ‖ ⋅‖ denotes the Euclidean distance. The GRNN model estimates the output value by calculating a weighted average of the output values of the training samples, where the weights are determined by the distances between the input vector x and the training samples.
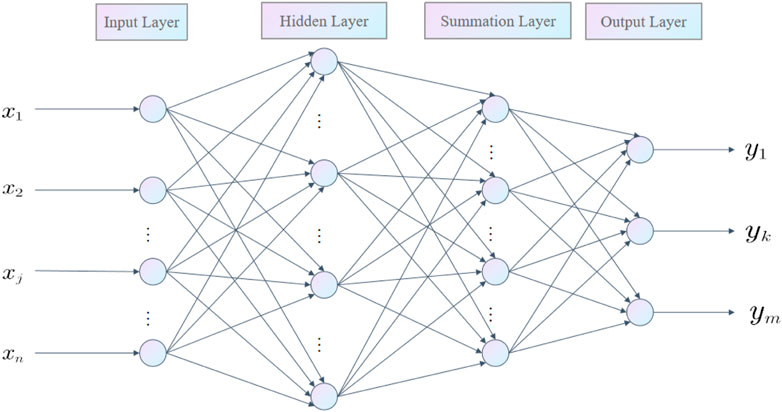
FIGURE 4. GRNN structural unit.
Algorithm 4 is the algorithm for the GRNN algorithm of operations flow, and //text denotes the annotations in the algorithm. The GRNN model inputs the training set D, the input vector x, and the local region size σ. The output value
Algorithm 4.GRNN prediction process.
Input: Training set D = (x1, y1), (x2, y2), …, (xn, yn), input vector x, local region size σ
Output: Output value
Initialize w ← 0; for i = 1 to n do
di ←|x − xi|2;//Calculate the distance between x and xi
w ← w + wi;//Update the sum of weights
end
Here we have chosen EIA dataset, ACER dataset, ICER dataset and NEA dataset as our experimental dataset.
EIA: The EIA database is an energy data and analysis tool platform maintained by the U.S. Energy Information Administration (U.S. Energy Information Administration). (Waseem et al., 2023) The forum contains multiple datasets, the most important of which are the National Energy Data System (NEDS) and the International Energy Data System (IEDS). NEDS provides data on production, consumption, import and export, and prices in various energy fields; IEDS provides data on global energy markets and production, including data on energy consumption, imports and exports, and prices in multiple countries. At the same time, the EIA database also provides tools and analysis reports such as the Short-Term Energy Outlook (STEO for short) and the Annual Energy Outlook (AEO for short). (Mostafa et al., 2022). STEO provides data on the short-term forecast of the U.S. energy market, including data on crude oil prices, fuel prices, energy production, and consumption, etc.; AEO provides data on the long-term forecast of the U.S. energy market, including data on energy production, consumption, import and export, and prices in the next few decades.
In addition to these main data sets and tools, the EIA database also provides various analysis tools and reports, such as interactive data browsers, energy information maps, and energy trend reports, to facilitate user data analysis and comparison. (Balouch et al., 2022) The EIA database is one of the most authoritative data sources in the energy field and is widely used in policy formulation, business decision-making, and academic research.
ACER: The ACER database is an energy market data and analysis tool platform maintained by the European Energy Regulatory Agency (Agency for the Cooperation of Energy Regulators, referred to as ACER), which aims to provide EU member states and various stakeholders with detailed information on the European energy market. (Mololoth et al., 2023) The platform contains multiple datasets, the most important of which are the Europe-wide Electricity Market Data Repository (EMDB) and the Europe-wide Gas Market Data Repository (GMDB). EMDB provides data on the European electricity market, including power load, power generation, price, transaction volume, market share, etc.; GMDB provides data on the European natural gas market, including natural gas supply, consumption, price, transaction volume, market share, etc. In addition, the ACER database also provides analytical tools and reports, such as the European Energy Market Monitoring Tool (EMMT) and the European Energy Market Model (EEMM). (Pal and Shankar, 2022) EMMT provides real-time monitoring and analysis of the European energy market, as well as data on market trends and forecasts; EEMM provides forecasts and analysis on the European energy market in the next few years, including data on supply and demand balance, price trends, market share, etc.
The ACER database is one of the most authoritative data sources in the European energy market and is widely used in policy formulation, business decision-making, and academic research. (Goia et al., 2022) The platform’s data and tools can help various stakeholders better understand the situation in the European energy market for better decision-making and planning.
ICER: The ICER database is an energy-related data and analysis tool platform maintained by the Indian Council for Energy Research and Education (ICER), which aims to provide governments, scholars, companies, and the public in India and other countries with detailed information on Indian and global energy markets, production, consumption, and prices. (Ding et al., 2022) The platform consists of several datasets, the most important of which are the Indian Energy Data Repository (IEDR) and the Global Energy Data Repository (GEDR). IEDR provides data on production, consumption, import and export, and prices in India’s energy sector; GEDR provides data on global energy markets and production, including data on energy consumption, imports and exports, and prices in various countries. And the ICER database also provides various tools and analysis reports such as the Indian Energy Outlook Report (IEOR for short) and the Global Energy Outlook Report (GEOR for short). IEOR provides data on the long-term forecast of the Indian energy market, including data on energy production, consumption, import and export, and prices in the next few decades; GEOR provides data on the long-term forecast of the global energy market, including data on energy production, consumption, import and export, and prices in the next few decades.
In addition to these main data sets and tools, the ICER database also provides a variety of analysis tools and reports, such as interactive data browsers, energy information maps, and energy trend reports, to facilitate data analysis and comparison for users. ICER database is one of the most important data sources in India’s energy field and is widely used in policy formulation, business decision-making, and academic research.
NEA: The NEA database is a nuclear energy-related data and analysis tool platform maintained by the International Nuclear Energy Agency (NEA), which aims to provide detailed information on the nuclear energy industry for member states and other stakeholders. (Jiang et al., 2022) The platform contains multiple datasets, the most important of which are the Nuclear Energy Data (NED) and the Nuclear Energy Market Outlook Data Bank (Market and Economic Data Bank (MEDB)). NED provides data on production, consumption, import and export, and prices in the field of nuclear energy in various countries; MEDB provides analysis and forecasts on the nuclear energy market and economic prospects, including data on market trends, investment, and employment. In addition, the NEA database also provides various tools and analysis reports, such as the Nuclear Energy Outlook (NEO) and the Nuclear Technology Roadmap (NTR) (Baxter, 2022). NEO provides forecasts and analyses of the nuclear energy market for the next few decades, including data on energy demand, production, investment, and environmental impact; NTR provides planning and forecasts on nuclear energy technology development, including data on nuclear reactor technology and nuclear fuel cycle technology.
In addition to these main data sets and tools, the NEA database also provides a variety of analysis tools and reports, such as the nuclear energy basic knowledge base and nuclear energy regulation database, which are convenient for users to conduct data analysis and comparison (Ghiasi et al., 2023). The NEA database is one of the most authoritative data sources in the field of nuclear energy and is widely used in policy formulation, business decision-making, and academic research.
Here we use four databases as raw data, the following is our database Table 1.We use the first 80% of the data in the selected database as the training set, and the last 20% of the data as the test set. Giving the model more training data can make our model prediction results more accurate and the prediction results more convincing.
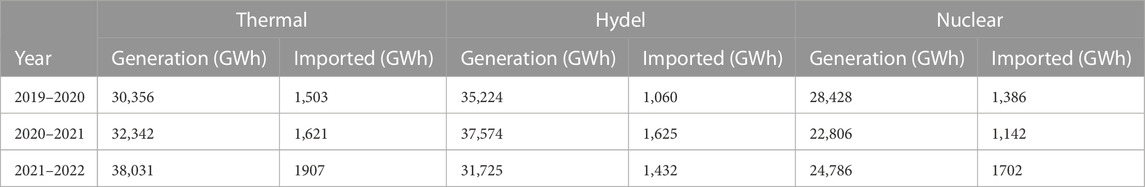
TABLE 1. Selected dataset data.
To verify the value of the BO-BERT-GRNN-based model in the innovation management analysis of financial trading strategies for smart grids, we conducted a series of experiments to compare with other models to verify the applicability of our model in the innovation management analysis of financial trading strategies for smart grids. Our study covers the metrics of precision, recall, inference time, number of parameters, training time, Flops, and accuracy, and the practical steps are as follows.
Step 1. Data Preprocessing and Segmentation
• Obtain data on intelligent grid financial trading strategies from datasets such as EIA Dataset, ACER Dataset, ICER Dataset, and NEA Dataset.
• Perform preprocessing operations such as cleaning, de-duplication, normalization, and missing value filling on the data to ensure data quality and consistency.
• Randomly divide the dataset into a training set and a test set according to a ratio 80:20 for use in the training and testing process.
Step 2. BO-BERT-GRNN model design and implementation
• Extract features from the training set using the BERT model and fine-tune the BERT model to optimize feature extraction using the training and test sets.
• Model time series data using the GRNN model and train the model using the training and test sets.
• Optimize the hyperparameters of the BO-BERT-GRNN model using a Bayesian optimization algorithm to improve the model performance.
• Train and validate the BO-BERT-GRNN model using training and test sets to classify and predict features.
Step 3. Model Evaluation and Result Analysis
• Different evaluation metrics such as precision, recall, inference time, number of parameters, training time, Flops, and accuracy are used on the test set to evaluate the BO-BERT-GRNN model. BERT-GRNN model performance is evaluated.
• Calculate the mean and standard deviation of each metric and compare the performance of the BO-BERT-GRNN model under different metrics.
• Analyze and explain the performance of the BO-BERT-GRNN model in the application of innovative management analysis of financial trading strategies for smart grids, and make recommendations for improvement and optimization.
The following is the mathematical formula for comparing indicators.
• Precision: Precision is specific to the prediction result and indicates how many of the samples predicted to be cheerful are positive.
Where TP means True Positive and FP means False Positive.
• Recall: Recall is for the original positive sample; it indicates how many positive cases in the model were predicted correctly.
Where TP means actual cases, and FN means false adverse claims.
• Inference Time: Inference time is usually measured in seconds, from when the model receives an input to when it produces an output.
• Parameters: The number of parameters in the model is the total number of parameters to be learned in the model tuned to minimize the loss function during model training.
• Training Time: Training time is the time from the start of training to the completion of the activity of the model, usually measured in seconds, minutes, hours, or days. it depends on the model’s complexity, the training set’s size, the computing device’s performance, and the optimization algorithm.
• Flops: Flops is an acronym for floating-point operations per second and is used to measure the computational power of a computer or computing device. In deep learning, Flops are often used to measure the complexity of a model or computational requirements.
• Accuracy: Accuracy is the most commonly used metric for evaluating classification models and indicates the percentage of total samples correctly predicted by the model.
TP denotes actual cases, TN denotes fundamental negative points, FP denotes false positive claims, and FN denotes false adverse claims.
BO-BERT-GRNN-based innovative management analysis model for intelligent grid financial trading strategies is a neural network model that combines Bayesian optimization, bidirectional encoder representation from Transformer, and gated recurrent neural network. We conducted a series of experiments and found that the model performs better with different datasets and data volumes, has higher performance stability, and suffers the most negligible impact compared to other model groups. Combining the results of multiple sets of experiments, we can conclude that the BO-BERT-GRNN-based innovation management analysis model for intelligent grid financial transaction strategies has high accuracy and stability and has good performance in predicting key indicators in smart grid financial transaction strategies, which helps enterprises to realize their business goals. In addition, the model has good generalization ability, which can be adapted to different application scenarios and provide enterprises with a broader range of application scenarios.
In Figure 5, we compared the performance of different models on two datasets, the EIA dataset and the ACER dataset. We measured each model’s accuracy, precision, and recall to assess its prediction ability for critical metrics.
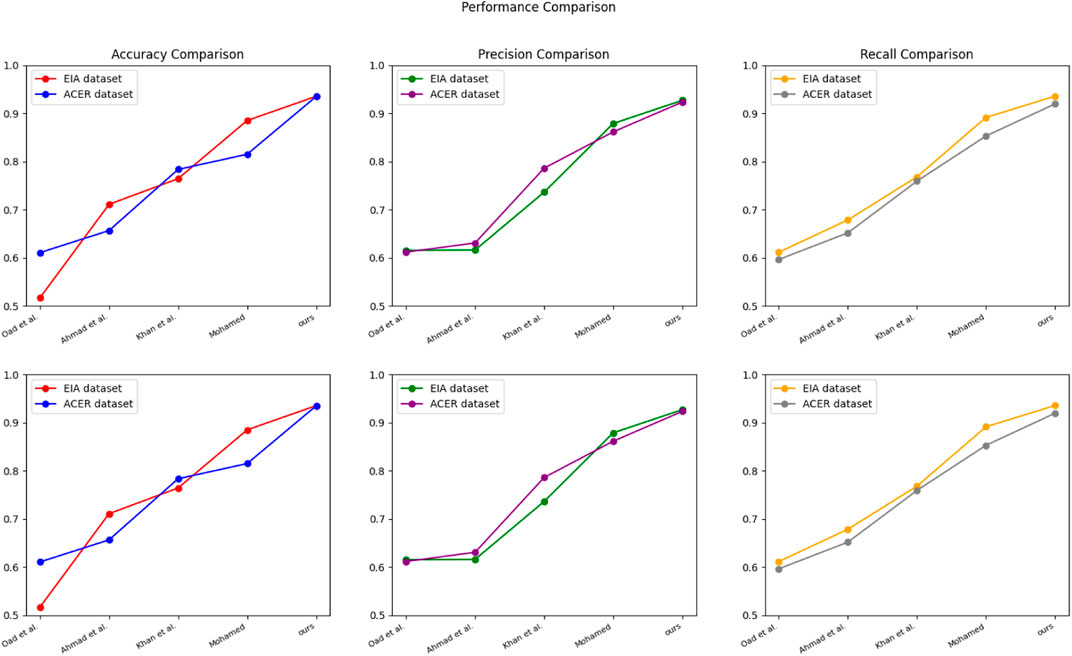
FIGURE 5. Model Oad et al., 2023; Ahmad et al., 2022; Khan et al., 2023; Mohamed, 2022 and ours model experimental visualization of Accuracy metrics, Precision metrics, and Recall metrics on EIA dataset and ACER dataset.
From the experimental results, it can be seen that our proposed model() performs best on both datasets. In particular, on the ACER dataset, our model achieves an accuracy of 0.9349, a precision of 0.9232, and a recall of 0.9195, which is significantly better than other models. In addition, our model performs stably on both datasets with minimal impact, which indicates that our model has better stability and robustness and has high accuracy and stability in predicting key metrics in smart grid financial trading strategies, which can help companies achieve their business goals.
Table 2 shows the graphs of the experimental data results of the above experiments.
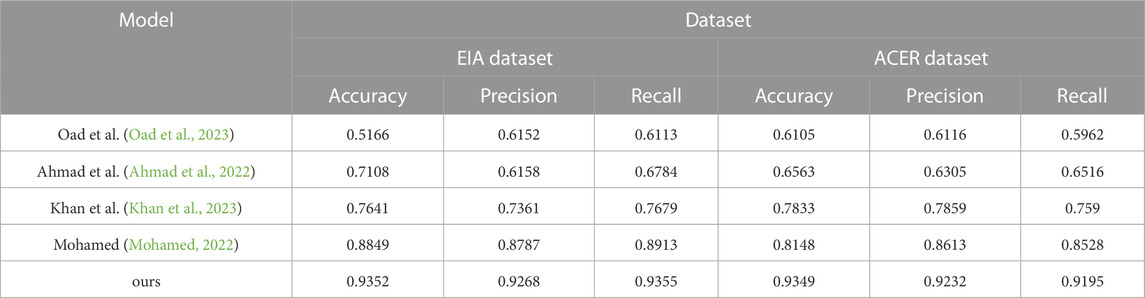
TABLE 2. Chart summarizing the experimental findings of the model Oad et al., 2023; Ahmad et al., 2022; Khan et al., 2023; Mohamed, 2022 and ours model in the EIA database and the ACER database.
In Figure 6, We compare the performance of different models on the ICER and NEA datasets. This experiment aims to evaluate the performance of the Bo-BERT-GRNN model in this domain and provide a reference for further optimizing the management of financial trading strategies.
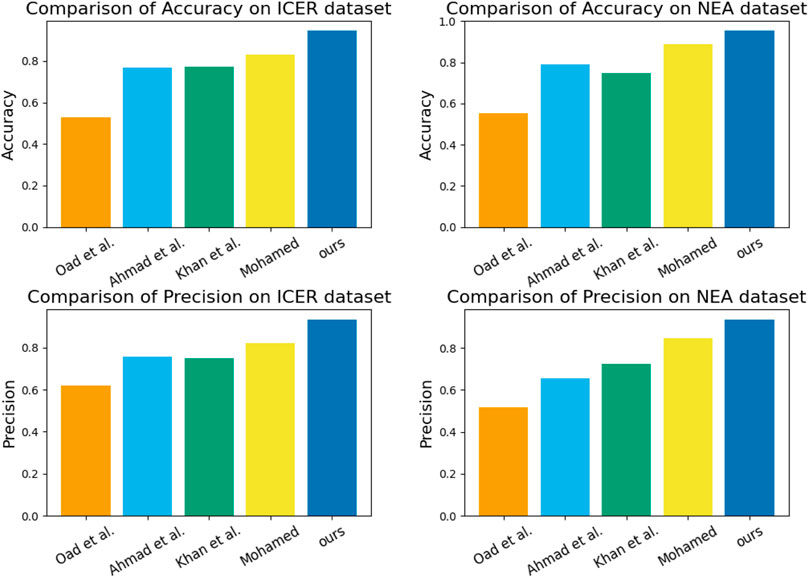
FIGURE 6. Oad et al., 2023; Ahmad et al., 2022; Khan et al., 2023; Mohamed, 2022 and ours model comparing Accuracy metrics and Precision metrics in ICER dataset and NEA dataset.
During the experiment, we compare the performance of different models on Accuracy and Precision metrics and show the results using tables. From the table, it can be seen that our proposed Bo-BERT-GRNN model performs the best on both datasets in terms of Accuracy metrics, reaching 0.9457 and 0.9539, respectively. In contrast, in terms of Precision metrics, the model performs well on both datasets, achieving 0.9348 and 0.9364 accuracies. In contrast, the other models performed differently on different datasets but generally performed poorly on the Accuracy and Precision metrics. The results show that the Bo-BERT-GRNN model has high predictive ability and stability in analyzing the innovation management of financial trading strategies for smart grids, which can help companies better formulate and manage financial trading strategies. In addition, the results of this experiment provide a valuable reference for further optimizing the management of financial trading strategies.Table 3 shows the graphs of the experimental data results of the above experiments.
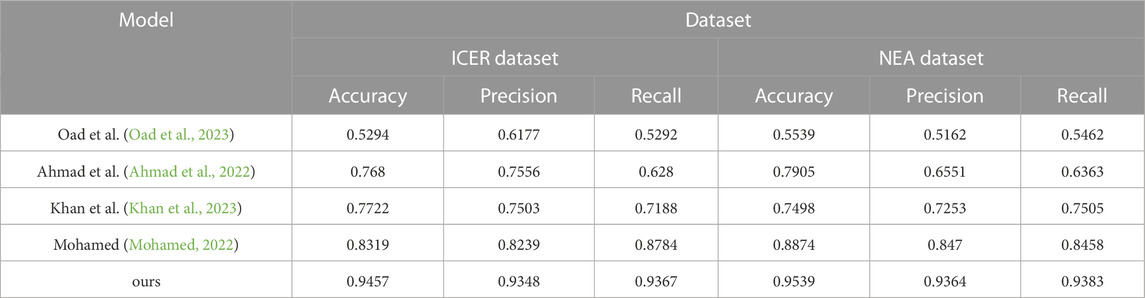
TABLE 3. Chart summarizing the experimental findings of the model Oad et al., 2023; Ahmad et al., 2022; Khan et al., 2023; Mohamed, 2022 and ours model in the ICER database and the NEA database.
In Figure 7, We selected four datasets, ICER, NEA, EIA, and ACER, to compare the performance of different models in innovation management analysis of intelligent grid financial trading strategies. We mainly compared the recall metrics, and with the experimental results in Table 3 and Table 4, we draw the following conclusions:
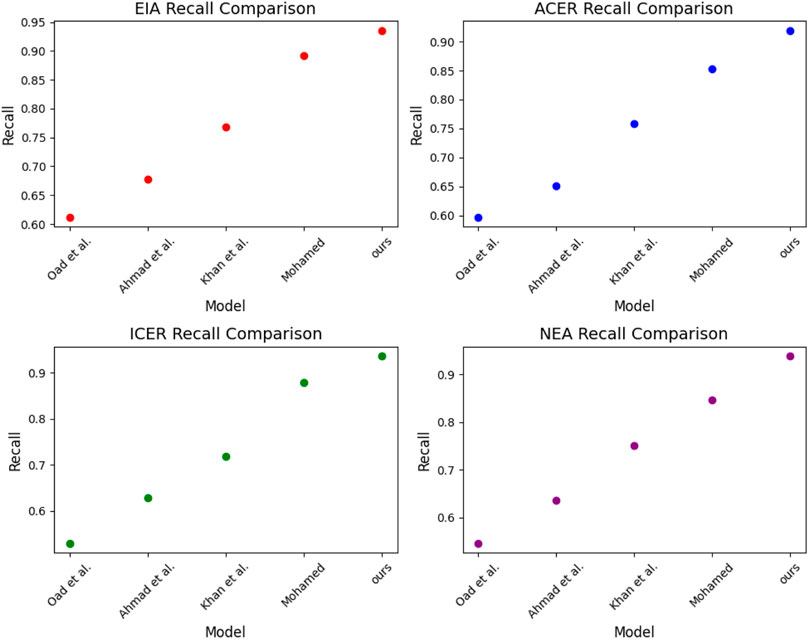
FIGURE 7. Model Oad et al., 2023; Ahmad et al., 2022; Khan et al., 2023; Mohamed, 2022 and ours mode on EIA dataset, ACER dataset, ICER dataset and NEA dataset.
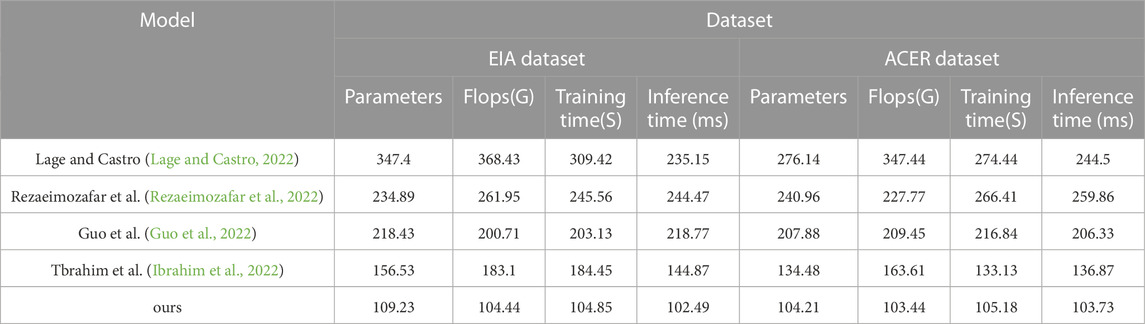
TABLE 4. Chart summarizing the experimental findings of the model Lage and Castro, 2022; Rezaeimozafar et al., 2022; Guo et al., 2022; Ibrahim et al., 2022 and ours model in the EIA database and the ACER database.
We note that our model exhibits a high recall rate on the EIA, ACER, ICER, and NEA datasets, which is advantageous compared to the other models. This suggests that the model has potential applications in smart grid financial transaction identification, which can better detect possible transaction anomalies and improve transaction regulation’s effectiveness and efficiency.
In Figure 8, To evaluate the performance of different models in analyzing the innovation management of financial trading strategies for smart grids. We selected two datasets, the EIA dataset and the ACER dataset, which contain many financial transaction data and related information. We evaluated five different models, including the Lage and Castro model, the Rezaeimozafar et al. model, the Guo et al. model, the Tbrahim et al. model, and our own proposed model. We compared the performance of these models in terms of performance metrics such as the number of parameters, floating-point operations (Flops), training time and inference time. We organized the experimental results in Table 4.
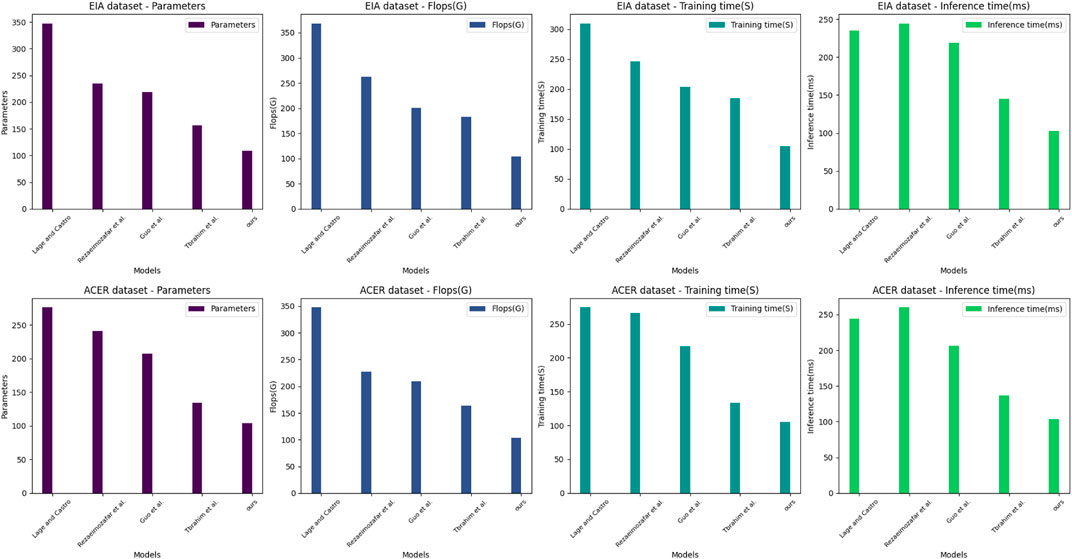
FIGURE 8. Parameters metrics, Flops metrics, Training time metrics, and Inference time metrics for the Lage and Castro, 2022; Rezaeimozafar et al., 2022; Guo et al., 2022; Ibrahim et al., 2022 as well as for our models in the EIA database and ACER database Experimental Visualization.
During our experiments, we first downloaded the EIA and ACER datasets and imported them into our computing environment. Then, we implemented five different models and used the PyTorch framework for training and inference. We used the Adam optimizer and cross-entropy loss function during training with appropriate hyperparameters. We used the test set data in the inference process and recorded the inference time.
On both datasets, the EIA and ACER datasets, our proposed model performs optimally regarding performance metrics such as the number of parameters, Flops, training time, and inference time. This indicates that our model has high efficiency and accuracy and can perform better in real applications. Other models perform differently on different datasets but generally have lower performance metrics. For example, the Lage and Castro model performs poorly on the EIA dataset, while the Ibrahim et al. model does not perform well on the ACER dataset. Our experimental results show that our proposed model performs optimally on both datasets with the advantages of the lower number of parameters, Flops, and inference time, and our proposed model has high performance in analyzing the innovation management of financial trading strategies for smart grids and can be used in practical applications with higher efficiency and accuracy. This provides a valuable reference for further optimizing the management of financial trading strategies.
In Figure 9, We compare the performance of the five models on four datasets. According to Table 4 and Table 5, it can be seen that our models exhibit excellent performance on several datasets, including having a smaller number of parameters and lower FLOPs on the EIA and ACER datasets, as well as showing shorter training and inference times on the ICER and NEA datasets. These advantages enable the Bo-BERT-GRNN model to quickly process large-scale financial data in the electricity market, including historical price data, energy supply, demand forecasts, etc.
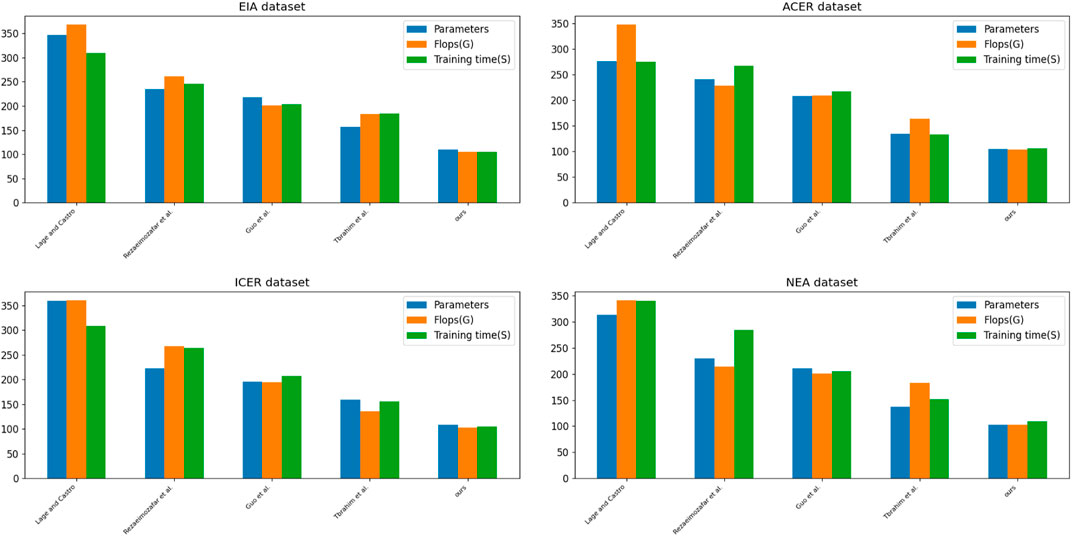
FIGURE 9. Comparative experimental visualization of Parameter metrics, Flops metrics, and Training time metrics of model Lage and Castro, 2022; Rezaeimozafar et al., 2022; Guo et al., 2022; Ibrahim et al., 2022 and ours model on EIA dataset, ACER dataset, ICER dataset, and NEA dataset.
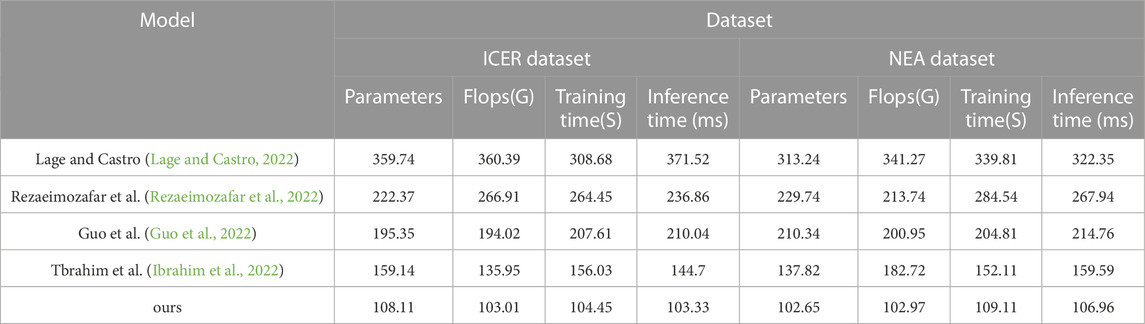
TABLE 5. Chart summarizing the experimental findings of the model Lage and Castro, 2022; Rezaeimozafar et al., 2022; Guo et al., 2022; Ibrahim et al., 2022 and ours model in the ICER database and the NEA database.
And our model performs best on the NEA dataset, having the lowest number of parameters, FLOPs, and shortest training and inference time. This means that our model can process data more efficiently in analyzing innovative management of financial trading strategies for smart grids, thus improving the accuracy and efficiency of trading decisions.
Therefore, our proposed BO-BERT-GRNN model has a good application prospect in smart grid financial trading strategy innovation management analysis, which can improve the efficiency and accuracy of data processing and thus help power market participants make more informed trading decisions. This is the general data table for and Figure. In table, we have selected several important metrics and the best data values for each group of models to visualize the results of our experiments. The bolded parts of the table represent the best data in each group of experiments.
This study investigates the innovation management problem of financial trading strategies for power system planning using the BO-BERT-GRNN model. The proposed model, which integrates Bayesian optimization, BERT model, and gated recurrent neural network, demonstrates its effectiveness in improving the efficiency and accuracy of model training, extracting features from historical data, and modeling and predicting power system planning.
The experiments conducted in this study validate the superior performance and generalization ability of the BO-BERT-GRNN model in various aspects of power system planning, including price prediction, energy transaction risk management, and energy asset allocation. The findings highlight the significance of this innovative management model in achieving electricity asset allocation, market risk management, and revenue maximization objectives. However, there are some shortcomings in our study, such as The dataset used in our study may have some limitations and may not cover all electricity markets, thus affecting the generalization and application of our model. Together with the high complexity of the BO-BERT-GRNN model, a large amount of computational and storage resources are required to support the training and application of the model. This may limit the model’s scope of use and efficiency in practical applications. We will continue to address these issues, improve the model, and refine the research results.
The results and implications of this study open up avenues for discussion on the innovative management of financial trading strategies in the field of power system planning. The integration of Bayesian optimization, BERT model, and gated recurrent neural network offers a comprehensive approach to address the challenges faced in the energy trading market.
The application of the BO-BERT-GRNN model not only enhances transaction efficiency and reduces costs but also provides valuable market insights for decision-making. By leveraging historical data, the model captures relevant features and patterns, enabling more accurate predictions and informed trading decisions.Furthermore, the BO-BERT-GRNN model’s generalization ability enables it to adapt to different scenarios and contribute to the optimization of energy asset allocation. This has practical implications for stakeholders in the smart grid financial transactions domain, as it can lead to improved risk management strategies and revenue maximization.
It is important to acknowledge that further research is needed to explore the potential of other models and techniques in the context of power system planning. Additionally, the integration of external factors, such as policy changes and market dynamics, can enhance the model’s predictive capabilities and decision-making process. This study contributes to the advancement of innovative management in financial trading strategies for power system planning. The findings serve as a foundation for future research and provide valuable insights for industry practitioners and policymakers seeking to optimize energy trading processes in the smart grid system.
The original contributions presented in the study are included in the article/Supplementary material, further inquiries can be directed to the corresponding author.
MZ: Conceptualization, Data curation, Project administration, Resources, Writing–original draft. LS: Data curation, Formal Analysis, Investigation, Resources, Writing–review and editing. JG: Investigation, Methodology, Project administration, Visualization, Writing–original draft.
The author(s) declare financial support was received for the research, authorship, and/or publication of this article. This article is funded by National Natural Science Foundation of China: Media Attention and Contract Governance of Mixed-Ownership Enterprises: Effects, Mechanisms and Paths (Project No: 72172113).
The authors declare that the research was conducted in the absence of any commercial or financial relationships that could be construed as a potential conflict of interest.
All claims expressed in this article are solely those of the authors and do not necessarily represent those of their affiliated organizations, or those of the publisher, the editors and the reviewers. Any product that may be evaluated in this article, or claim that may be made by its manufacturer, is not guaranteed or endorsed by the publisher.
Ahmad, T., Madonski, R., Zhang, D., Huang, C., and Mujeeb, A. (2022). Data-driven probabilistic machine learning in sustainable smart energy/smart energy systems: key developments, challenges, and future research opportunities in the context of smart grid paradigm. Renew. Sustain. Energy Rev. 160, 112128.
Alsokhiry, F., Annuk, A., Mohamed, M. A., and Marinho, M. (2023). An innovative cloud-fog-based smart grid scheme for efficient resource utilization. Sensors 23,1752.
Balouch, S., Abrar, M., Abdul Muqeet, H., Shahzad, M., Jamil, H., Hamdi, M., et al. (2022). Optimal scheduling of demand side load management of smart grid considering energy efficiency. Front. Energy Res. 10, 861571.
Baxter, G. (2022). Assessing the carbon footprint and carbon mitigation measures of a major full-service network airline: A case study of singapore airlines. Int. J. Environ. Agric. Biotechnol. 7, 81–107.
De-la Cruz-Diaz, M., Alvarez-Risco, A., Jaramillo-Arévalo, M., Lenti-Dulong, M. F., Calle-Nole, M., de las Mercedes Anderson-Seminario, M., et al. (2022). “Virtual tourism, carbon footprint, and circularity,” in Circular economy: Impact on carbon and water footprint (Berlin, Germany: Springer), 245–263.
Ding, J., Qammar, A., Zhang, Z., Karim, A., and Ning, H. (2022). Cyber threats to smart grids: review, taxonomy, potential solutions, and future directions. Energies 15, 6799.
Ghiasi, M., Niknam, T., Wang, Z., Mehrandezh, M., Dehghani, M., and Ghadimi, N. (2023). A comprehensive review of cyber-attacks and defense mechanisms for improving security in smart grid energy systems: past, present and future. Electr. Power Syst. Res. 215, 108975.
Goia, B., Cioara, T., and Anghel, I. (2022). Virtual power plant optimization in smart grids: A narrative review. Future Internet 14, 128.
Guo, Y., Wan, Z., and Cheng, X. (2022). When blockchain meets smart grids: A comprehensive survey. High-Confidence Comput. 2, 100059.
He, F., and Ye, Q. (2022). A bearing fault diagnosis method based on wavelet packet transform and convolutional neural network optimized by simulated annealing algorithm. Sensors 22, 1410.
Ibrahim, C., Mougharbel, I., Kanaan, H. Y., Abou Daher, N., Georges, S., and Saad, M. (2022). A review on the deployment of demand response programs with multiple aspects coexistence over smart grid platform. Renew. Sustain. Energy Rev. 162, 112446.
Jiang, X., Sun, A., Sun, Y., Luo, H., and Guizani, M. (2022). A trust-based hierarchical consensus mechanism for consortium blockchain in smart grid. Tsinghua Sci. Technol. 28, 69–81.
Khan, A. A., Laghari, A. A., Rashid, M., Li, H., Javed, A. R., and Gadekallu, T. R. (2023). Artificial intelligence and blockchain technology for secure smart grid and power distribution automation: A state-of-the-art review. Sustain. Energy Technol. Assessments 57, 103282.
Khan, N., Shahid, Z., Alam, M. M., Bakar Sajak, A. A., Mazliham, M., Khan, T. A., et al. (2022). Energy management systems using smart grids: an exhaustive parametric comprehensive analysis of existing trends, significance, opportunities, and challenges. Int. Trans. Electr. Energy Syst. 2022.
Lage, M., and Castro, R. (2022). A practical review of the public policies used to promote the implementation of pv technology in smart grids: the case of portugal. Energies 15, 3567.
Makonin, S., Marks, L. U., Przedpełski, R., Rodriguez-Silva, A., and ElMallah, R. (June 2022). “Calculating the carbon footprint of streaming media: beyond the myth of efficiency,” in Proceedings of the Eighth Workshop on Computing within limits 2022 (LIMITS). Santa Barbara, CA, USA.
Mall, P., Amin, R., Das, A. K., Leung, M. T., and Choo, K.-K. R. (2022). Puf-based authentication and key agreement protocols for iot, wsns, and smart grids: A comprehensive survey. IEEE Internet Things J. 9, 8205–8228.
Mazhar, T., Irfan, H. M., Haq, I., Ullah, I., Ashraf, M., Shloul, T. A., et al. (2023). Analysis of challenges and solutions of iot in smart grids using ai and machine learning techniques: A review. Electronics 12, 242.
Mohamed, M. A. (2022). A relaxed consensus plus innovation based effective negotiation approach for energy cooperation between smart grid and microgrid. Energy 252, 123996.
Mololoth, V. K., Saguna, S., and Åhlund, C. (2023). Blockchain and machine°learning for future smart grids: A review. Energies 16, 528.
Mostafa, N., Ramadan, H. S. M., and Elfarouk, O. (2022). Renewable energy management in smart grids by using big data analytics and machine learning. Mach. Learn. Appl. 9, 100363.
Ning, X., Tian, W., He, F., Bai, X., Sun, L., and Li, W. (2023). Hyper-sausage coverage function neuron model and learning algorithm for image classification. Pattern Recognit. 136, 109216.
Ning, X., Tian, W., Yu, Z., Li, W., Bai, X., and Wang, Y. (2022). Hcfnn: high-order coverage function neural network for image classification. Pattern Recognit. 131, 108873.
Oad, A., Ahmad, H. G., Talpur, M. S. H., Zhao, C., and Pervez, A. (2023). Green smart grid predictive analysis to integrate sustainable energy of emerging v2g in smart city technologies. Optik 272, 170146.
Pal, C., and Shankar, R. (2022). A systematic inquiry of energy management in smart grid by using sap-lap and irp approach. Int. J. Energy Sect. Manag.
Rezaeimozafar, M., Monaghan, R. F., Barrett, E., and Duffy, M. (2022). A review of behind-the-meter energy storage systems in smart grids. Renew. Sustain. Energy Rev. 164, 112573.
Wang, C., Chu, S., Ying, Y., Wang, A., Chen, R., Xu, H., et al. (2022). Underfrequency load shedding scheme for islanded microgrids considering objective and subjective weight of loads. IEEE Trans. Smart Grid 14, 899–913.
Waseem, M., Adnan Khan, M., Goudarzi, A., Fahad, S., Sajjad, I. A., and Siano, P. (2023). Incorporation of blockchain technology for different smart grid applications: architecture, prospects, and challenges. Energies 16, 820.
Yang, N., Qin, T., Wu, L., Huang, Y., Huang, Y., Xing, C., et al. (2022). A multi-agent game based joint planning approach for electricity-gas integrated energy systems considering wind power uncertainty. Electr. Power Syst. Res. 204, 107673.
Keywords: BO, GRNN, BERT, intelligent grid, financial trading strategies innovation Frontiers
Citation: Zhang M, Shen L and Guo J (2023) Analysis on innovation management of power financial transaction strategy integrating BO-BERT-GRNN model. Front. Energy Res. 11:1269059. doi: 10.3389/fenrg.2023.1269059
Received: 29 July 2023; Accepted: 18 September 2023;
Published: 16 October 2023.
Edited by:
Nan Yang, China Three Gorges University, ChinaReviewed by:
Narottam Das, Central Queensland University, AustraliaCopyright © 2023 Zhang, Shen and Guo. This is an open-access article distributed under the terms of the Creative Commons Attribution License (CC BY). The use, distribution or reproduction in other forums is permitted, provided the original author(s) and the copyright owner(s) are credited and that the original publication in this journal is cited, in accordance with accepted academic practice. No use, distribution or reproduction is permitted which does not comply with these terms.
*Correspondence: Ling Shen, c2hlbmxpbmdAd2h1dC5lZHUuY24=; Mengzhu Zhang, MzEyMDE5NTgzMkBiaXQuZWR1LmNu
Disclaimer: All claims expressed in this article are solely those of the authors and do not necessarily represent those of their affiliated organizations, or those of the publisher, the editors and the reviewers. Any product that may be evaluated in this article or claim that may be made by its manufacturer is not guaranteed or endorsed by the publisher.
Research integrity at Frontiers
Learn more about the work of our research integrity team to safeguard the quality of each article we publish.