 Zheng Li1
 Baoqiang Zhang
 Guoqiang Zu
95% of researchers rate our articles as excellent or good
Learn more about the work of our research integrity team to safeguard the quality of each article we publish.
Find out more
ORIGINAL RESEARCH article
Front. Energy Res. , 16 November 2023
Sec. Energy Storage
Volume 11 - 2023 | https://doi.org/10.3389/fenrg.2023.1269041
With the vigorous promotion of new energy policies, the large-scale charging of new energy vehicles has put forward higher requirements for the safety and stability of the distribution network. Based on the daily driving habits and charging patterns of new energy vehicles, a Monte Carlo sampling algorithm was used to establish a charging load model for new energy vehicles. The model analyzed the driving range, charging load, and time related parameters of new energy vehicles. By analyzing the law of daily charging power of new energy vehicles, the overall trend of charging load of new energy vehicles is obtained. Combined with the daily electricity consumption law of the distribution network, the total load of the distribution network is obtained, and the degree of impact on the distribution network is analyzed. This provides direction for the scheduling of future electric vehicle charging behavior and the construction of related supporting facilities, and provides strong guidance for the optimization and upgrading of the distribution network.
Against the backdrop of energy scarcity, severe environmental pollution, and the expected “dual carbon” policy of global climate change (Shen et al., 2022; Pinzan et al., 2023), electric vehicles (Hereinafter referred to as “EVs”) have gradually become the mainstream means of transportation, and public transportation is gradually transitioning towards electric power. It has irreplaceable advantages in reducing carbon emissions and promoting the establishment of environmentally friendly homes. At present, EVs have become the focus of Transportation planning and the direction of vehicle enterprises’ R&D, and the market share has gradually expanded (Sidharthan and Arefi, 2021; Cabrera-Tobar et al., 2022). In response to the new national policies on the distribution and planning development of new energy vehicles and charging stations, considering their impact on the power system, analyzing the hybrid charging station system of renewable energy systems such as solar photovoltaic and wind energy (Bastida-Molina et al., 2021), and evaluating the development of new energy vehicles and the planning and construction of the power system have far-reaching significance (Kang et al., 2022; Manousakis et al., 2023).
The calculation of charging load for EVs is of great significance for power system planning and operation as it serves as the basis for analyzing the impact of EV on the distribution network (Zanvettor et al., 2022). Reference (Ma et al., 2023) established a charging load model for EVs based on the travel characteristics of EVs drivers and the distribution of charging facilities, and certain actual statistical data. It did not analyze the impact of charging load and access points on the distribution network. Reference (Hua et al., 2022) takes the highest basic load of the distribution network as the objective function, and the charging characteristics of EVs and the output capacity of the distribution network as constraints, including the substation capacity of supporting substations, transmission line capacity, and voltage of relevant nodes in the distribution network. It analyzes the charging load of EVs, without considering their driving habits and charging randomness. Reference (Qian et al., 2022) A charging load prediction model for EVs was constructed, based on the characteristics of vehicle driving behavior. The region of the vehicle was determined through a function, and the position of EVs was described using Weibull probability distribution to form the vehicle’s charging network, and constructing charging load prediction models for private electric vehicles and electric taxis. Reference (Zhou et al., 2022) proposes a novel predictive energy management strategy for smart communities, optimizing usage in buildings and electric vehicle charging stations. This approach successfully balances demand response, providing significant energy efficiency improvements validated through simulation studies. Reference (Klingert and Lee, 2022) Using the characteristics of a real city in Germany, including transportation and mobility, to study the impact of electrified transportation on the distribution network. Findings show grid load sensitivity to charging station distribution, but behavior changes can reduce local peaks by 50%. It contributes to dynamic simulation research using real mobility data, albeit with spatialization and randomization challenges. Reference (Palahalli et al., 2022) explores the impact of large-scale EV integration into a medium voltage distribution network, using a 69-bus test network. It models EV charging behavior based on a measurement dataset, and analyses the effects on the network using probabilistic load flow simulation, focusing on voltage distribution and unbalance factor at different times of day. Reference (Vashisth et al., 2023) analyzed the impact of EVs on solar power supply networks under different penetration rates, proposed two electric vehicle models, and studied their voltage distribution. Using the convex relaxation technique of AC-OPF, an IEEE 33 bus network with time of use electricity price was analyzed. It also explored the sensitivity of voltage distribution to charging price, but it involved fewer charging vehicles and did not consider the driving and charging characteristics of the vehicles. Reference (Demirci et al., 2023; Hussien et al., 2023) studied the impact of EV charging and discharging on the distribution network, clarifying the environmental risks caused by uncoordinated EV charging on the network, distribution network, and power equipment. Reference (Liu et al., 2023) analyzed the impact of EVs charging loads on the distribution network using different permeabilities, specifically in terms of grid losses and voltage drops, but did not take into account the driving characteristics of EVs. The SPA based uncertainty model proposed in reference (Gong et al., 2020) aims to minimize the fluctuation and cost of EVS charging, taking into account seasonal characteristics. It can well track the output of renewable energy and reflect its fluctuation characteristics.
On the basis of considering the motion mode and charging behavior of EVs, this article establishes a Monte Carlo sampling algorithm based calculation method and model for the total charging load of electric vehicles. Based on the charging habits of EVs, the starting time, total charging duration, total energy consumption, and daily driving distance of EVs are predicted. Combined with the daily basic electricity load of the distribution network, the impact of EV charging patterns and penetration rates on the distribution network is analyzed. This model can be used to simulate power systems with various capacities of EVs and different nodes, providing a model basis for the impact of EVS disorderly charging on distribution networks in the future, providing direction for the future scheduling of EV charging behavior and the construction of related supporting facilities, and providing strong guidance for the optimization and upgrading of the distribution network.
By conducting research and processing on the driving data of electric vehicles in a certain region of Tianjin within a month, a charging model for electric vehicles was obtained, including daily mileage, charging time, charging power, and battery capacity. Please refer to the following text for details.
Assuming that the driving habits of electric vehicle users are the same as those of regular fuel vehicle users, organizing research data, it is concluded that the daily driving distance follows a logarithmic normal distribution
In the equation, take the mean
The probability distribution of daily distance for ordinary household EV is shown in Figure 1.
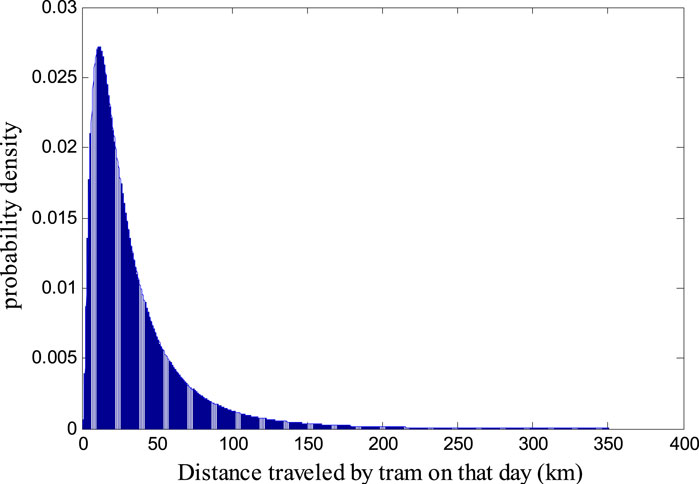
FIGURE 1. Probability distribution map of daily driving mileage.
Assuming that the new energy vehicle is fully charged before each trip, calculate the daily distance traveled by the new energy vehicle and obtain the probability distribution of the EV’s charging state.
The return time of EV
In the equation, take the mean
The probability distribution of the initial charging time can be obtained as shown in Figure 2.
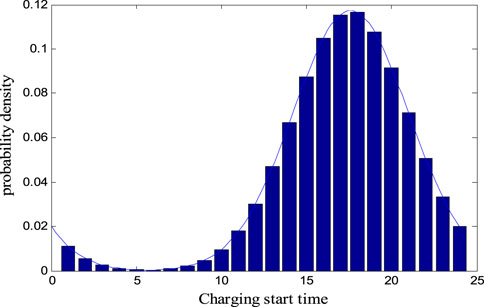
FIGURE 2. Probability distribution diagram of initial charging time.
The time distribution of total electric vehicle charging power is shown in Figure 3, which is sourced from the total charging power data of an electric vehicle charging station in a certain area of Tianjin within a month, including the average total charging power of various vehicle models, including private cars, ride hailing cars, logistics vehicles, etc., within 24 h. From the graph, it can be seen that the charging peak of EVs during the day is mainly concentrated during the rush hour of commuting and long periods of parking. The charging peak of EVs is around 20:00 every day.
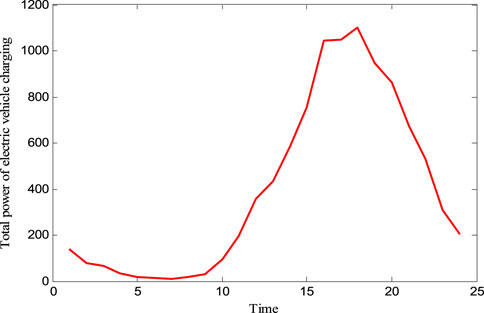
FIGURE 3. Probability distribution of charging power time.
The battery capacity of EVs varies depending on the vehicle model, usage diagram, and battery material. It can be seen from Big data that the capacity of most civil EVs batteries is widely distributed between 20 and 50 kW h. In this paper, the uniform distribution of 20–50 kW h is selected to represent the different battery capacities of EVs. The probability density function is Equation 3:
Monte Carlo Method (An and Zhang, 2023) mainly using computer generated “random numbers”, Its essence is probability methodology (Shirley et al., 2023), By simulating experiments with infinitely large samples, the frequency of events can be obtained, minimizing the error in the probability of event occurrence as much as possible, and approaching the probability of real events infinitely.
Establish a matching probability methodology model based on actual engineering, so that the parameter settings, probability distribution, and expectations of the model are infinitely close to actual engineering. Using the Monte Carlo method, multiple simulations can be conducted on the range and charging power of electric vehicles, greatly improving the efficiency and accuracy of the simulation.
g (x) is the functional model of actual engineering, and X is the discrete random variable of the function. The expected expression of the function is shown in Eq. 4:
When X is a continuous random variable, the expected value expression of g (x) is shown in Eq. 5:
Where f (x) is the probability density function of the random variable x.
The final result obtained based on the simulation method is an estimated value, rather than the actual solution of the problem, so there must be errors. On the basis of variance, the error of Monte Carlo simulation method is analyzed.
If X is a discrete random variable, then the variance
When X is a continuous random variable of the function, the function
On the basis of Kolmogorov’s theorem of large numbers (Misra et al., 2023), the random variables g (xi),i = 1,2,3, … ,n are independent of each other and follow the same probability distribution. If the mathematical expected value exists, then:
From the above formula, when n is infinite, the estimated value g(xn) of random variable in Monte Carlo simulation converges to E(g(x)) with probability 1.
On the basis of Central limit theorem, random variable g (xi),
The random variable
In the simulation method, the random variable g (xi),
In the equation
The values a and xa in the above equation can be determined by looking up the integral table. When confidence a is given, the error value
The variance coefficient b is used here to represent the simulation error:
From Equation 14 above, it can be seen that the computational difficulty of Monte Carlo sampling simulation is not affected by the distribution network. Therefore, the Monte Carlo sampling simulation method can be applied to the power system in various scenarios, and can solve the problem of multiple EVs accessing the distribution network and the correlation of each node of the power system. The calculation amount of Monte Carlo sampling simulation method is inversely proportional to the square of variance coefficient, and is proportional to the variance. Therefore, under certain accuracy requirements, reducing variance is a means to accelerate computational efficiency.
The total electricity load of EVs is the sum of the electricity consumption of each EV, and the calculation of the total load takes into account the randomness of charging start time and vehicle SOC.
The total charging energy consumption is measured in days, with time intervals of minutes. The total charging energy of EVs at the i-th moment is:
In the formula: Li is the total charging power in the i-th minute,
Define the jth charging behavior of the nth new energy vehicle as S based on charging demand
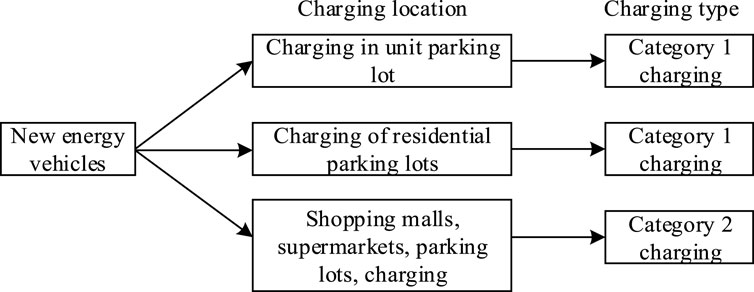
FIGURE 4. Charging locations and types of EV.
Assuming that the power grid does not control the charging behavior of electric vehicles, they will start charging immediately after being connected to the grid. Based on empirical values and research results, it can be concluded that the power consumption of electric vehicles per 100 km is between 10 and 15 kW h. According to the ratio of fast and slow charging power, the unit average charging power is calculated to be around 8.5 kW. Taking an empirical value of 7.5 represents the conversion relationship between electric vehicle mileage and power consumption, and taking a unit charging power of 8.5 kW represents the conversion relationship between electric vehicle charging quantity and charging time. Monte Carlo simulation is used to extract the starting SOC of a unit vehicle The flowchart of the calculation method for the charging load of electric vehicles based on the initial charging time is shown in Figure 5.
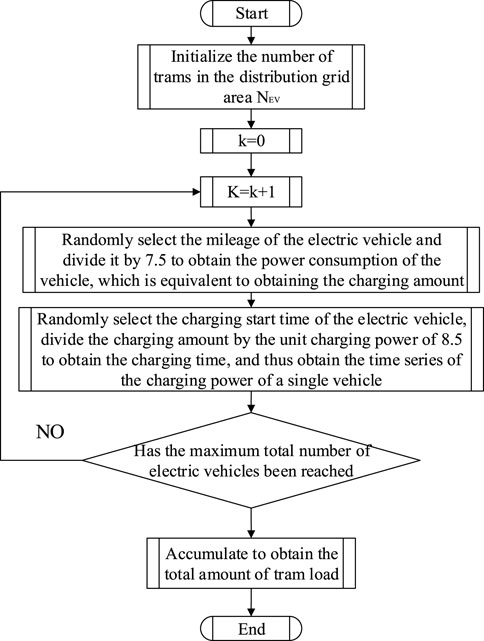
FIGURE 5. Charging load calculation flow chart based on Monte Carlo simulation.
The input information of the system includes the total scale of EV, the probability distribution of two types of charging behaviors, the probability distribution of charging period and initial charging time, and the probability distribution of initial SOC corresponding to different types of charging behaviors.
When EVs leave, it is the time when they are fully charged, and the charging demand of EVs is calculated. Calculate the total charging time from this. When the total charging time is met, reduce the sampling range at the starting time and randomly sample the starting charging time according to a specific probability distribution. Through Monte Carlo simulation, the daily distance of EV, the required charging amount after daily driving, the required charging time after daily driving, and the starting time of charging are respectively shown in Figures 6–9.
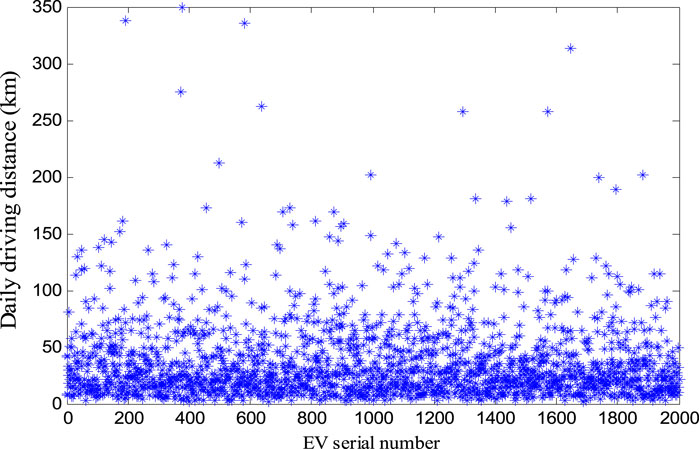
FIGURE 6. Daily distance of EV generated by Monte Carlo.
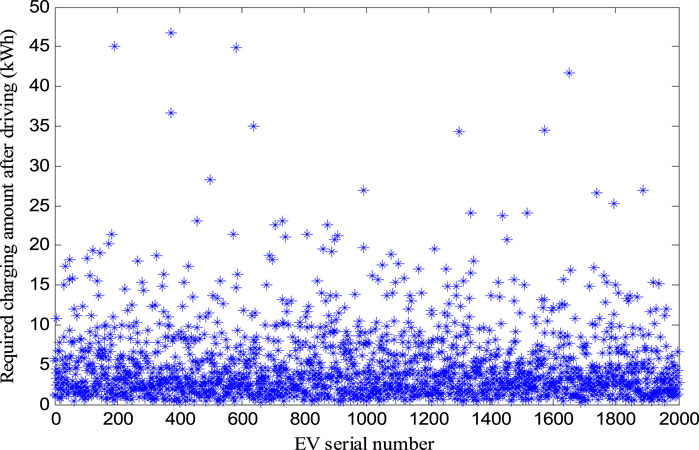
FIGURE 7. Charging amount of EV generated by Monte Carlo after daily driving.
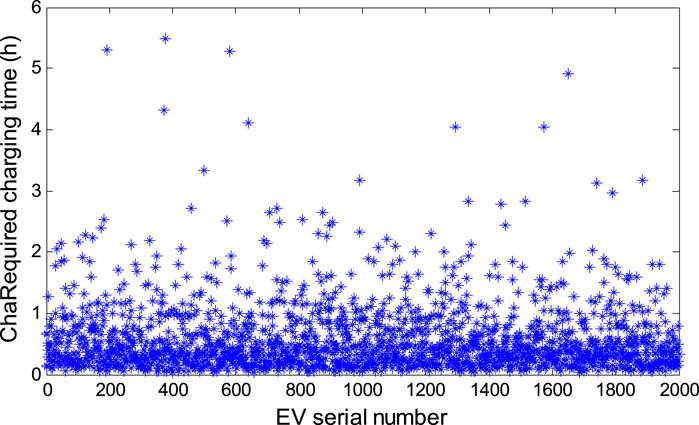
FIGURE 8. Charging time after daily driving of Monte Carlo generated EV.
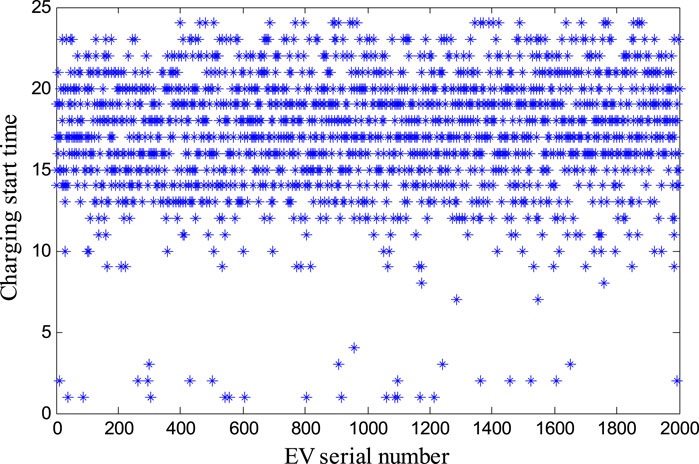
FIGURE 9. Start time of charging for Monte Carlo generated EV.
The daily driving range of EV is below 50 km, and the required charging capacity is also within 15 kWh. Charging often takes less than 1 and a half hours, and most of it starts after returning to their homes after commuting to work at night. It is mainly concentrated between 18:00 and 22:00 in the evening, which is consistent with the trend of residents’ basic load electricity consumption, and there is a phenomenon of “peak to peak".
Build an IEEE 33 distribution network simulation model to analyze the impact of different penetration rates of EV and different access locations on node voltage. The disorderly connection of EV to different locations can lead to a serious decrease in voltage at different nodes. Set the battery capacity to 30 kW h when EV are connected to nodes 14, 17, 21, and 26. Figure 10 shows the voltage deviation of the power grid after the new energy vehicle charging station is connected. It can be seen that the larger the distance from the power node, the greater the voltage deviation of system. 17. The voltages of the 21 nodes are 0.921 and 0.927 pu respectively, which have fallen out of the national safety range of ±7%, has a certain impact on the safety and reliability of the distribution network.
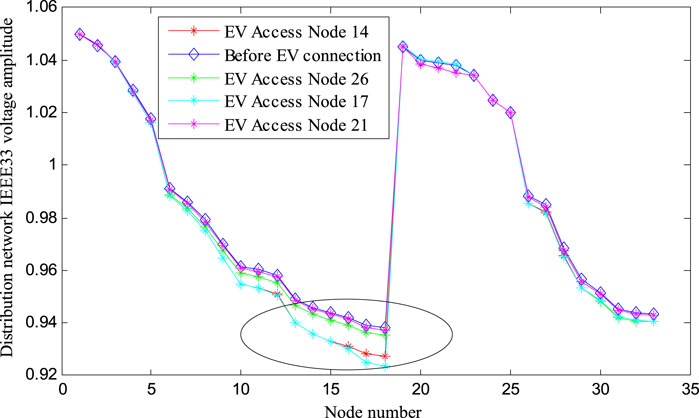
FIGURE 10. Connection of EV with the same charging power to different nodes.
Figure 11 shows the voltage diagram of IEEE33 node 17 for EV with charging power of 15, 30, 45, and 60 kW respectively. It can be seen that the higher the charging power of EV, the greater the voltage deviation. When the charging power is 45 kW and 60kW, the maximum voltage offset is 0.04 and 0.05 pu, respectively.
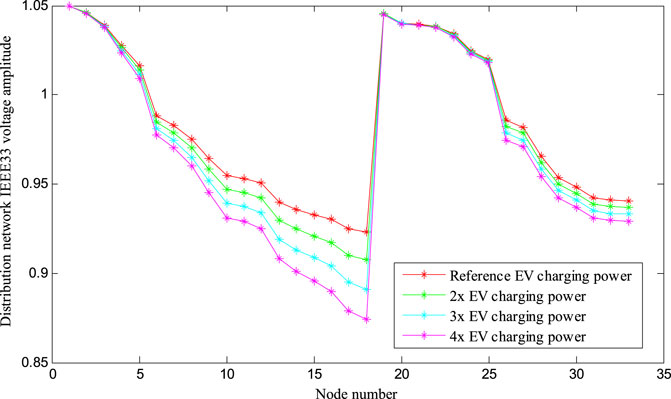
FIGURE 11. Node diagram of EV with different charging powers connected to the same node.
Distribution network loss refers to the active power loss in the network, which can be expressed as:
In the formula, Pk and Qk are the active and reactive power flowing into the first section of the k-th branch; Uk is the amplitude of the voltage at the head end of the k-th branch; Rk is the resistance of the k-th branch.
Figure 12 shows the network losses of EV with the same charging power connected to different nodes of the IEEE33 node distribution network. The network losses of the four nodes are significantly different, and when there is no new EV connected, the network losses will further increase when the EV is connected. The further away the new EV is connected from the power supply zero point system, the more system network losses will be added.

FIGURE 12. Changes in network loss of EV with the same charging power connected to the distribution network at different positions.
After EV with different charging powers are connected to the same IEEE33 node distribution network, the network loss of the system will consume a portion of reactive power due to the presence of transformers. Therefore, the power factor of the new energy vehicle charging station is set to 0.95.
As shown in Figure 13, EV with charging powers of 15, 30, 45, and 60 kW are connected to 17 nodes. The higher the charging power, the more system network losses it increases. When the charging power is 45 kW and 60 kW, the highest network losses are 0.07 and 0.1 pu, respectively, which occur from 20p.m. to 21p.m., which is also the time when the basic load is the highest, seriously affecting the efficient and stable operation of the distribution network.
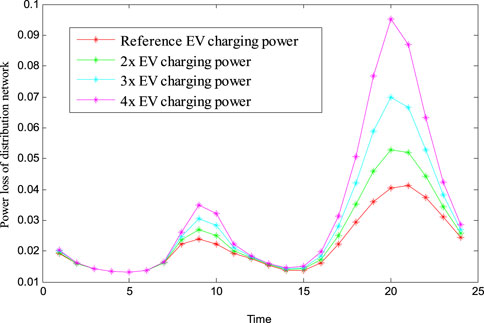
FIGURE 13. Diagram of EV with different capacities connected to the same node.
Taking private cars in a residential area of Tianjin as the research object, the charging loads of electric vehicles were divided into winter and summer for analysis. Set relevant parameters such as electric vehicle charging mode, charging method, and charging power, and define the penetration rate of electric vehicles as the percentage of the total number of electric vehicles. There are a total of 4,500 vehicles in this area, and when the penetration rate of electric vehicles is 15%, 35%, and 55%, the corresponding number of electric vehicles is 400, 1,200, and 2,000, respectively. Set other parameters as shown in Table 1.
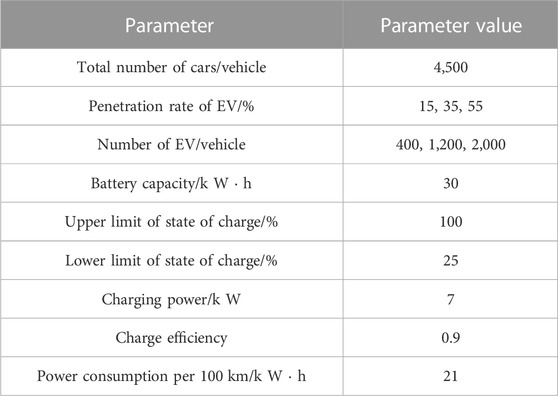
TABLE 1. Parameter setting table.
The winter and summer basic load curves of this area are shown in Figure 14. The data curve is sourced from the basic power load data of a certain area in Tianjin on August 5th and 5 December 2022, where August 5th represents summer and December 5th represents winter.
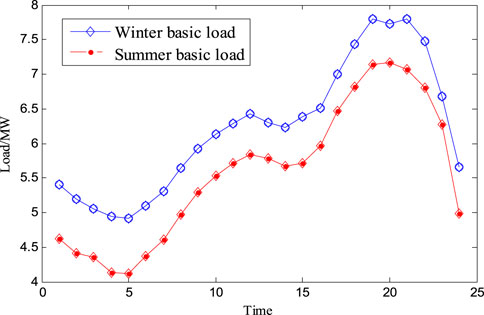
FIGURE 14. Basic load curve in winter and basic load curve in summer.
The basic load in this area is higher in winter than in summer. Taking into account the basic loads in winter and summer, both weights are set to 0.5, and the basic load data in the region is weighted average to obtain the annual average basic load as shown in Figure 15.
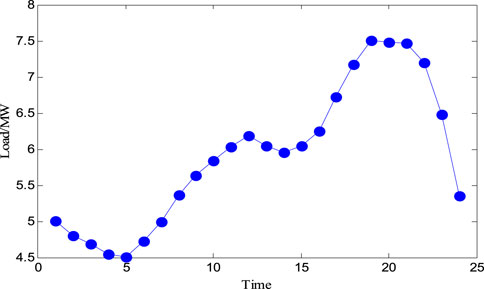
FIGURE 15. Basic load curve.
According to the above data and model, set a time sampling point every 1 h from 0:00, the Monte Carlo simulation method is used to calculate the electricity load of EVs. The basic electricity load and charging load of EVs in the distribution network are obtained. The superimposed load data and curves of 15%, 35%, and 55% of the basic electricity load and permeability are shown in the table and Figure 16.

FIGURE 16. Superimposed load curves with basic load and permeability of 15%, 35%, and 55%, respectively.
From the analysis of Table 2; Figure 16, it can be concluded that the peak charging load period of EV is mainly concentrated between 18:00 and 1:00 p.m. in the evening. The number of centrally charged EV with penetration rates of 15%, 35%, and 55% all exceeds 80% of the total number of EV. The peak period of basic load in the distribution network usually also occurs around 19:00 to 22:00, which will lead to the phenomenon of “peak to peak” superimposed load. As the penetration rate continues to increase, the percentage of new energy vehicle charging load in the superimposed load will continue to increase, and there may even be situations where the charging load value exceeds the base load.
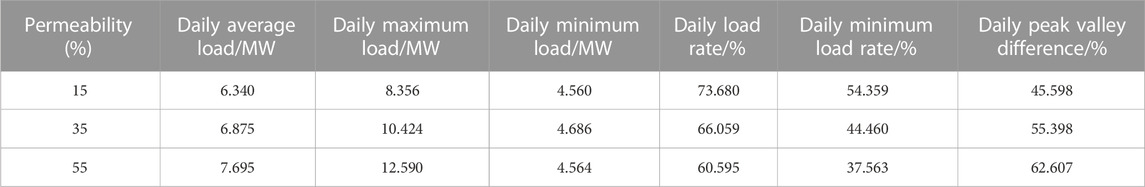
TABLE 2. Superimposed load characteristic indicator.
Due to the fact that the permeability of 15% is closest to the actual situation, a permeability of 15% is used as the benchmark. According to Table 2, when the penetration rate is 35%, the maximum load of the distribution network increases by about 24%; When the penetration rate is 55%, the maximum load of the distribution network increases by about 40%. The magnitude of permeability determines the peak load of the distribution network and is positively correlated. According to this law, when the penetration rate increases to a certain extent, the power grid equipment will experience serious overload problems.
This article uses Monte Carlo sampling algorithm to establish an EVs charging load model. This model predicts the driving range, charging duration, and load of EVs, and simulates the impact of different penetration rates on the IEEE33 node distribution system. The analysis results indicate that the charging power of EVs and the nodes connected to the distribution network have a significant impact on the loss and voltage drop of the power system. The wider the charging behavior, the greater the charging load, and the greater the voltage drop and power loss away from the source. The impact of charging load on the distribution network was verified through numerical examples. The results showed that the charging characteristics and power of EVs, when superimposed on the basic electricity load of the distribution network, are prone to the phenomenon of “peak to peak”, which seriously affects the safety and stability of the distribution network.
The data on the load and power of the distribution system in this article is influenced by actual charging scenarios. There is a situation where EV use household basic electricity for charging. In response to this situation, strengthening the orderly charging guidance for EVs and reducing the load on the distribution network is the next research direction.
The original contributions presented in the study are included in the article/Supplementary Material, further inquiries can be directed to the corresponding author.
ZL: Writing–original draft, Writing–review and editing. CL: Writing–original draft, Writing–review and editing. BZ: Writing–original draft, Writing–review and editing. QD: Writing–original draft, Writing–review and editing. LL: Writing–original draft, Writing–review and editing. GZ: Writing–original draft, Writing–review and editing. QL: Writing–original draft, Writing–review and editing.
The author(s) declare that financial support was received for the research, authorship, and/or publication of this article. The work is funded by the National Key R&D Program of China (2022YFB2403900) and the science and technology project of SGCC (State Grid Corporation of China).
Authors ZL, CL, and BZ were employed by CATARC New Energy Vehicle Test Center (Tianjin) Co., Ltd. Authors GZ and QL were employed by State Grid Tianjin Electric Power Company.
The authors declare that this study received funding from State Grid Corporation of China. The funder has the following involvement in the study: Study design and decision to submit it for publication.
The remaining authors declare that the research was conducted in the absence of any commercial or financial relationships that could be construed as a potential conflict of interest.
All claims expressed in this article are solely those of the authors and do not necessarily represent those of their affiliated organizations, or those of the publisher, the editors and the reviewers. Any product that may be evaluated in this article, or claim that may be made by its manufacturer, is not guaranteed or endorsed by the publisher.
An, D., and Zhang, T. (2023). “Power dispatching strategy of electric vehicle charging station based on reinforcement learning and heuristic priority,” in 2023 5th Asia Energy and Electrical Engineering Symposium (AEEES), Chengdu, China, March, 2023, 1241–1246. doi:10.1109/AEEES56888.2023.10114166
Bastida-Molina, P., Hurtado-Pérez, E., Moros Gómez, M. C., and Vargas-Salgado, C. (2021). Multicriteria power generation planning and experimental verification of hybrid renewable energy systems for fast electric vehicle charging stations. Renew. Energy 179, 737–755. doi:10.1016/j.renene.2021.07.002
Cabrera-Tobar, A., Blasuttigh, N., Massi Pavan, A., Lughi, V., Petrone, G., and Spagnuolo, G. (2022). Energy scheduling and performance evaluation of an e-vehicle charging station. electronics 11 (23), 3948. doi:10.3390/electronics11233948
Demirci, A., Tercan, S. M., Cali, U., and Nakir, I. (2023). A comprehensive data analysis of electric vehicle user behaviors toward unlocking vehicle-to-grid potential. IEEE Access 11, 9149–9165. doi:10.1109/ACCESS.2023.3240102
Gong, L., Cao, W., Liu, K., Yu, Y., and Zhao, J. (2020). Demand responsive charging strategy of electric vehicles to mitigate the volatility of renewable energy sources. Renew. Energy 156, 665–676. doi:10.1016/j.renene.2020.04.061
Hua, Y. P., Wang, S. Q., Han, D., Bai, H. K., Wang, Y. Y., and Li, Q. Y. (2022). Analysis of charging load acceptance capacity of electric vehicles in the residential distribution network. World Electr. Veh. J. 13 (11), 214. doi:10.3390/wevj13110214
Hussien, D. A., Omran, W. A., and Sharkawy, R. M. (2023). “Smart charging of electric vehicles in charging stations,” in 2023 5th International Youth Conference on Radio Electronics, Electrical and Power Engineering (REEPE), Moscow, Russia, March, 2023, 1–5. doi:10.1109/REEPE57272.2023.10086885
Kang, Y., Li, W., Fu, Y., Jiang, D., and Zhao, G. (2022). “Influence of electric vehicle charging station development on distribution network planning in shandong province,” in 2022 5th International Conference on Power and Energy Applications (ICPEA), Guangzhou, China, November, 2022, 384–387. doi:10.1109/ICPEA56363.2022.10052302
Klingert, S., and Lee, J.-W. (2022). Using real mobility patterns to assess the impact of 100% electrified mobility in a German city. Energy Inf. 5 (1), 32. doi:10.1186/s42162-022-00248-x
Liu, H., Shen, H., Hu, W., Ji, L., Li, J., and Yu, Y. (2023). “Electric vehicle load forecast based on higher order Markov chain,” in 2023 5th Asia Energy and Electrical Engineering Symposium (AEEES), Chengdu, China, March, 2023, 1203–1207. doi:10.1109/AEEES56888.2023.10114238
Ma, Y., Zhang, B., and Zhou, X. (2023). An overview on impacts of electric vehicles integration into distribution network. 2015 IEEE International Conference on Mechatronics and Automation (ICMA). IEEE 218 (02), 2065–2070. doi:10.1109/ICMA.2015.7237804
Manousakis, N. M., Karagiannopoulos, P. S., Tsekouras, G. J., and Kanellos, F. D. (2023). Integration of renewable energy and electric vehicles in power systems: a review. Processes 11, 1544. doi:10.3390/pr11051544
Misra, S., Jha, B., and Mishra, V. M. (2023). “Modelling of charging and discharging of electric vehicle,” in 2023 2nd International Conference for Innovation in Technology (INOCON), Bangalore, India, March, 2023, 1–5. doi:10.1109/INOCON57975.2023.10101093
Palahalli, H., Diaz-Londono, C., Maffezzoni, P., and Gruosso, G. (2022). “Impact analysis of electric vehicle charging stations on the medium voltage distribution network,” in IECON 2022 – 48th Annual Conference of the IEEE Industrial Electronics Society, Brussels, Belgium, October 2022, 1–6. doi:10.1109/IECON49645.2022.9968929
Pinzan, D., Haddad, M. A., and Cwikowski, O. (2023). “Electrical design for the conversion of existing UK HVAC overhead lines to HVDC operation under severe pollution conditions, ranging from 170 to 500 kV DC,” in 19th International Conference on AC and DC Power Transmission (ACDC 2023), Glasgow, UK, March, 2023, 181–187. doi:10.1049/icp.2023.1327
Qian, X., Wang, W., Lu, Z., Si, S., Chen, J., and Wang, N. (2022). “An electric vehicle charging load prediction method based on travel trajectory characteristics,” in 2022 IEEE 6th Conference on Energy Internet and Energy System Integration (EI2), Chengdu, China, November, 2022, 2844–2849. doi:10.1109/EI256261.2022.10116549
Shen, J., Cai, W., Chen, X., Chen, X., Zhao, Z., Ma, Z., et al. (2022). Synergies of carbon neutrality,air pollution control,andhealth improvement-a case study of China Energy Interconnection scenario. Glob. Energy Interconnect. 5 (05), 531–542. doi:10.1016/j.gloei.2022.10.007
Shirley, C. P., Evangelin Sonia, S. V., Sathya, V., Manikandan, N., Vidhyalakshmi, M. K., and Reddy, Ch. V. K. (2023). “Blockchain and deep learning development of smart charging of electric vehicles to meet the demand side management,” in 2023 International Conference on Sustainable Computing and Data Communication Systems (ICSCDS), Erode, India, March, 2023, 1377–1381. doi:10.1109/ICSCDS56580.2023.10105037
Sidharthan, A. P., and Arefi, S. A. (2021). “Optimization of charging in a multi-port EV charging station for emergency vehicle priority fast charging,” in 2021 IEEE International Women in Engineering (WIE) Conference on Electrical and Computer Engineering (WIECON-ECE), Dhaka, Bangladesh, December 2021, 192–195. doi:10.1109/WIECON-ECE54711.2021.9829632
Vashisth, S., Agrawal, P. K., Gupta, N., Naizi, K. R., and Swarnkar, A. (2023). “A novel strategy for electric vehicle home charging to defer investment on distributed energy resources,” in 2023 IEEE IAS Global Conference on Renewable Energy and Hydrogen Technologies (GlobConHT), Male, Maldives, March, 2023, 1–6. doi:10.1109/GlobConHT56829.2023.10087723
Zanvettor, G. G., Casini, M., Smith, R. S., and Vicino, A. (2022). Stochastic energy pricing of an electric vehicle parking lot. IEEE Trans. SMART GRID 13 (4), 3069–3081. doi:10.1109/TSG.2022.3160229
Keywords: Monte Carlo, charging load, charging power, charging model, permeability
Citation: Li Z, Li C, Zhang B, Duan Q, Liu L, Zu G and Li Q (2023) Research on new energy vehicle charging prediction based on Monte Carlo algorithm and its impact on distribution network. Front. Energy Res. 11:1269041. doi: 10.3389/fenrg.2023.1269041
Received: 29 July 2023; Accepted: 06 November 2023;
Published: 16 November 2023.
Edited by:
Hongwei Wu, University of Hertfordshire, United KingdomReviewed by:
Preetham Goli, University of Missouri Kansas City, United StatesCopyright © 2023 Li, Li, Zhang, Duan, Liu, Zu and Li. This is an open-access article distributed under the terms of the Creative Commons Attribution License (CC BY). The use, distribution or reproduction in other forums is permitted, provided the original author(s) and the copyright owner(s) are credited and that the original publication in this journal is cited, in accordance with accepted academic practice. No use, distribution or reproduction is permitted which does not comply with these terms.
*Correspondence: Baoqiang Zhang, emhhbmdiYW9xaWFuZ0BjYXRhcmMuYWMuY24=
Disclaimer: All claims expressed in this article are solely those of the authors and do not necessarily represent those of their affiliated organizations, or those of the publisher, the editors and the reviewers. Any product that may be evaluated in this article or claim that may be made by its manufacturer is not guaranteed or endorsed by the publisher.
Research integrity at Frontiers
Learn more about the work of our research integrity team to safeguard the quality of each article we publish.