 Qian Zhang
 Song Chen
95% of researchers rate our articles as excellent or good
Learn more about the work of our research integrity team to safeguard the quality of each article we publish.
Find out more
ORIGINAL RESEARCH article
Front. Energy Res. , 09 November 2023
Sec. Solar Energy
Volume 11 - 2023 | https://doi.org/10.3389/fenrg.2023.1268687
Introduction: In the field of solar energy utilization, the construction of low cost and easy to process large concentrated photothermal system is a scientific problem to be solved. A linear Fresnel reflection solar concentrator is proposed in this paper.
Methods: The position, tilt angle and width of the glass mirrors placed in the same plane are different to ensure that all the reflected light falls on the flat focal plane or cylindrical focal surface. According to the focusing principle of the concentrator, two experimental system platforms ware built. When a flat focal plane is used to receive radiation from the sun, the intensity distribution of focal plane light spot is uniform in theory.
Results: The CCD measurement method is used to analyze the concentrated light spot under experimental conditions, and it is proved that the energy flux density on the focal plane is uniform. Placing monocrystalline silicon cells on the focal plane, the experimental results of p-v power generation voltammetry show that the power generation efficiency of monocrystalline silicon cell does not decrease due to the uniform solar energy density, which can reach 17.1%. The photothermal experiment is carried out by using one-dimensional tracking mode of sunlight. The concentrator reflects the sun’s rays onto the vacuum collector tubes, heating the heat conduction oil flow in. The thermocouple measures the temperature of the heat conduction oil at the inlet and outlet of the vacuum collector tubes. The experimental photothermal conversion efficiency of this concentrator was analyzed and calculated through multiple groups of photothermal experiments, and compared with the theoretical concentrator efficiency. With two collector tubes in series, the theoretical photothermal conversion efficiency reaches 0.8 and the experimental photothermal conversion efficiency reaches about 0.74.
Discussion: Because of its good concentrating performance and low cost, this type concentrator can be widely used in photothermal and photovoltaic applications.
Excessive use of fossil energy in the process of industrialization leads to frequent environmental pollution problems caused by global warming and climate warming, which seriously threatens the sustainable development of social economy. In response to the international community’s call for an effective response to climate change, countries have predicted their carbon emissions and developed carbon neutrality goals. For example, China is expected to offset all carbon dioxide emissions by 2060 by planting trees, saving energy, and reducing carbon emissions, and South Korea has announced that it will achieve carbon neutrality by 2050 (Derindag et al., 2023; Li et al., 2023; Xu et al., 2023; Yao et al., 2023). The peak and equilibrium of carbon dioxide emissions is a major issue that people all over the world must face in the future. Solar energy is “inexhaustible” and can steadily reduce carbon emissions (Sharma and Bhattacharya, 2020; Hassan et al., 2021; Shepovalova et al., 2021; Zhang et al., 2022a; Zhang et al., 2022b). By concentrating the light, the density of solar energy flow is significantly improved, which can be widely used in the photovoltaic and photothermal systems (Coccia et al., 2021; Tsai, 2022). At present, various concentrators have been applied in solar concentrator systems (Ma et al., 2020; Beltagy, 2021; Sagade et al., 2021; Alnajideen and Gao, 2022; Wang et al., 2022), among which the linear Fresnel reflector (FLR), parabolic trough collector (PTC), solar tower, and solar disk are the most commonly used solar concentrator technologies (Liang et al., 2021; Xiao et al., 2021). The various existing concentrators have their own disadvantages when applied to the photothermal system, such as trough concentrators and dish concentrators, which have complex processing technology and high cost (Sagade et al., 2021; Tsai, 2022). Although the Fresnel lens concentrator is cheap, it has the limitation of making a single large-area product (Ma et al., 2020; Beltagy, 2021; Wang et al., 2022). Therefore, in the field of solar energy utilization, the construction of a low-cost and easy-to-process large concentrated photothermal system is a scientific problem to be solved.
The linear Fresnel reflection solar concentrator proposed in this paper places several glass mirrors in sequence in the same plane and concentrates the sunlight on the cylindrical focal surface through reflection so as to obtain concentrating spots with high energy flow density (Gupta et al., 2021). Compared with a curved reflection concentrator (trough concentrator and disc concentrator), a planar reflection concentrator can obtain uniform energy flow density on the focusing surface, which can be used for photovoltaic power generation (Hu et al., 2011). The glass mirrors adopt a segmented arrangement and has a certain gap between each other, which significantly reduces the wind resistance and improves the safety of the system compared with a single large area of the reflecting surface. At the same time, the smaller single glass mirror reflector has a relatively low production cost and is convenient to install. Therefore, the research of this kind of a concentrator has high practical value.
The linear Fresnel reflection solar concentrating system is a non-imaging concentrator. By adjusting the position, angle, and width of the reflecting glass mirrors, each mirror superimposed the incident sunlight reflection onto the fixed flat focal plane or cylindrical focal plane. Centering on the vertical projection of the center line of the focal surface, the glass mirrors are arranged on both sides of the same plane and numbered i, and the light reflected by each of the glass mirrors does not block each other.
The structural model depicting the reflection of the Sun’s rays onto the flat focal plane is shown in Figure 1.
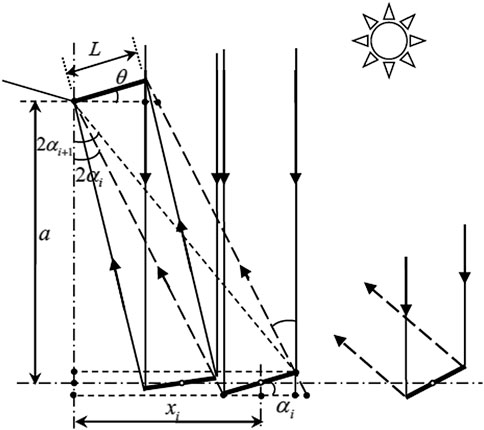
FIGURE 1. Flat focal plane reception model of the linear Fresnel reflection solar concentrator.
According to the geometric relationship,
The parameters of the first glass mirror can be expressed as Eq. 4,
For ease of design and calculation, this paper presents Eq. 5:
When a、L、b1、θ are known, the width, angle, and position of each glass mirror can be obtained.
The structural model depicting the reflection of the Sun’s rays onto the cylindrical focal plane is shown in Figure 2.
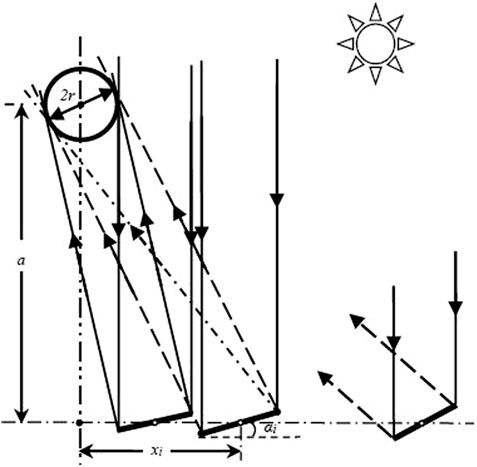
FIGURE 2. Cylindrical focal plane reception model of the linear Fresnel reflection solar concentrator.
According to the geometric relationship,
The parameters of the first glass mirror can be expressed as Eq. 9,
For the same, this paper presents bi = 1/2Wi. When a、r、b1 are known, the width, angle, and position of each glass mirror can be obtained.
In order to better analyze the concentrating performance of the concentrator, two dimensionless parameters are introduced in this paper, taking the flat focal plane reception model in Figure 1 as an example.
The geometric concentrating ratio CR is defined as the sum of the areas of all glass mirrors in the direction of the solar ray incident to the area of the focal plane.
The area utilization ratio k is defined as the sum of the areas of all glass mirrors in the direction of the solar ray incident to the area of the glass mirrors’ mounting area.
where n is the number of mirrors on one side of the concentrator.
The relationship between the concentration ratio CR, the installation angle θ, and the number of mirrors n when L = 25 mm and a = 400 mm is shown in Figure 3. The relationship between the area utilization ratio k, the installation angle θ, and the number of mirrors n is shown in Figure 4.

FIGURE 3. Variation in concentration ratio CR with θ and n.
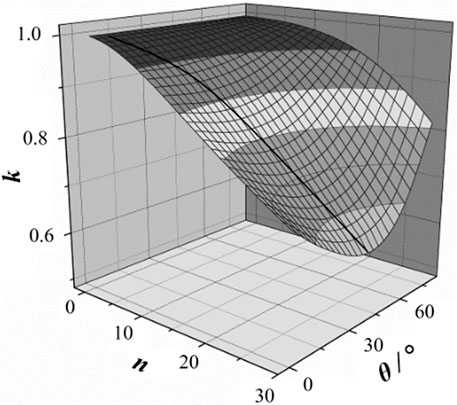
FIGURE 4. Variation in area utilization ratio k with θ and n.
As shown in Figure 3, when the number of glass mirrors n is the same, the smaller or larger the angle θ, the smaller the concentration ratio CR. The maximum concentration ratio is shown at the fitted solid line in the diagram. When θ is approximately equal to 30°, the concentration ratio CR is maximum with the same number of mirrors n.
It can be seen from Figure 4 that the area utilization rate k has a minimum value as the θ value changes. The area utilization rate k is the smallest, and the concentrator ratio CR is the largest. When θ is approximately equal to 30°, the area utilization rate k tends to be minimum with the same number of mirrors n.
With the continuous change in the receiving plane installation angle θ, the change trend between the theoretical concentration ratio CR and the area utilization rate k is shown in Figure 5.
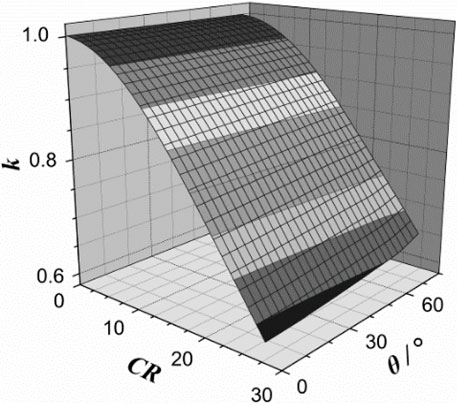
FIGURE 5. Change trend between CR and k.
As shown in Figure 5, when the area utilization ratio k is approximately 90%, the concentrating ratio CR can reach 12.5. When the concentrating ratio CR reaches 30, the area utilization ratio k will decrease to 60%. In practical applications, the area utilization rate k should be comprehensively considered according to the concentrating ratio CR value that needs to be achieved so as to use the space as much as possible. Reflective mirrors can be arranged on both sides of the center line, compared with the unilateral arrangement, and under the same area utilization rate k, the concentration ratio value can be doubled.
Based on the aforementioned theoretical analysis, a set of small concentrating photovoltaic experimental systems was built, with receiving solar cell width L = 25 mm, installation angle θ = 0, and installation height a = 400 mm, as shown in Figure 6. In this experiment, 20 mirrors were arranged on one side.
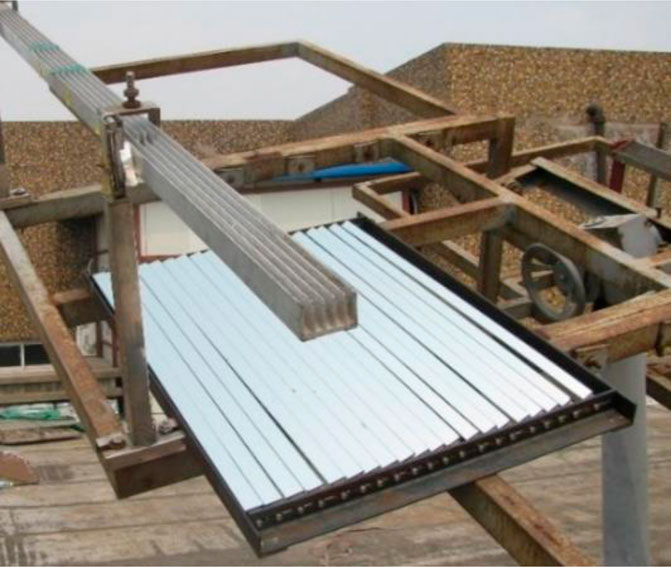
FIGURE 6. Picture of the linear Fresnel reflection solar concentrator photovoltaic experimental system.
According to Eqs 1–5, the parameters of the glass mirrors can be obtained by using FORTRAN programming. In order to ensure that the incident rays of sunlight are always perpendicular to the plane where the glass mirrors are installed, a two-dimensional tracking system is adopted in the experimental system (Jiang, 2009).
The direct solar energy flux density was measured under experimental conditions by a direct radiation instrument to be 602 W/m2, and the CCD test method (Dai and Liu, 2008) was used to analyze the concentrating efficiency. The test principle of this experiment is to place a Lambert target at the focal plane of the concentrator and obtain the focal spot image on it by using a CCD camera. Then, the relative distribution of the image is given after graying and normalization. Finally, the total average heat flux density is calibrated by a heat flowmeter. Figure 7 shows a CCD photograph of the concentrated light spot.
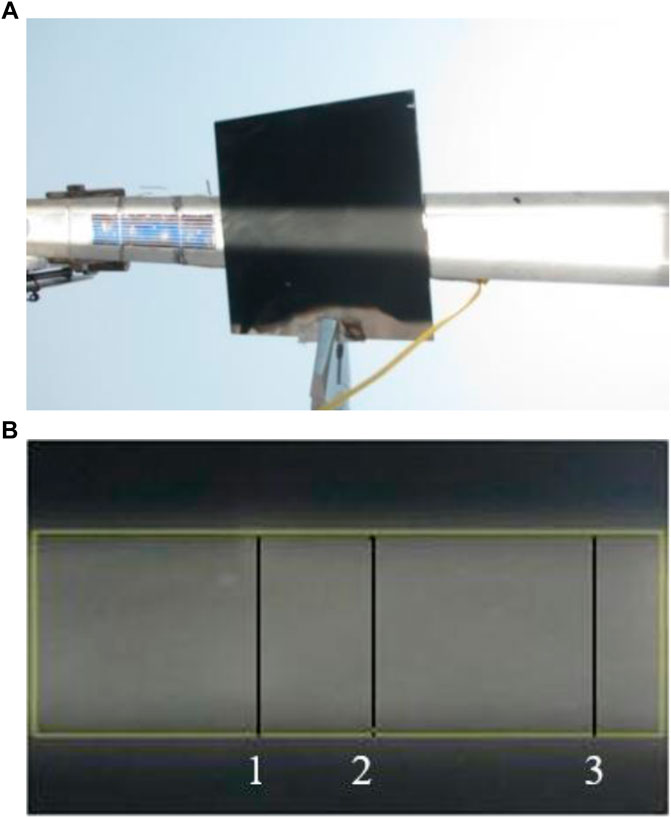
FIGURE 7. Picture of the light spot.
Figure 8 shows the energy flux densities of the solar cell focal plane in three directions. It shows that the illumination intensity is evenly distributed in both the width and length directions. The energy flux density at the edge of the focal plane is lower, which is mainly affected by the solid angle of the solar radiation beam. At the same time, the energy flux density under the simulated condition is given by the Monte Carlo ray tracing method (Duffie and Beckman, 2006).
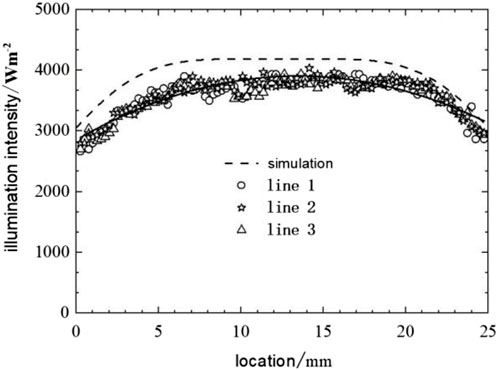
FIGURE 8. Concentrating spot illumination intensity distribution.
As shown in Figure 8, the dashed line represents the theoretical energy flux density on the focal plane. The solid line is a Gaussian fitting curve of the mean of the measured values, with a regression coefficient R2 of 0.865. The curve fitting effect in regression is good, which can reflect the distribution trend of energy flux density under actual measurement. By comparing the theoretical value and the measured fitting value, it can be seen that the energy flux density of the focal plane under measured conditions is approximately 93% of the theoretical value. The reasons of the error may be the installation error, the cleanliness of the glass mirrors, and the measurement error.
A 125 mm × 25 mm monocrystalline silicon cell was used to conduct the concentrating photovoltaic characteristic experiment. A rheostat is required to adjust the circuit resistance to change the terminal voltage and circuit current of the solar cell.
According to the data measured during the experiment, the average energy flux density in the focal plane is 3218 W/m2; the open circuit voltage and short circuit current at both ends of the monocrystalline silicon cell are 0.55 V and 4.81 A, respectively; and the maximum output power Pe,cell is 1.72 W, as shown in Figure 9.
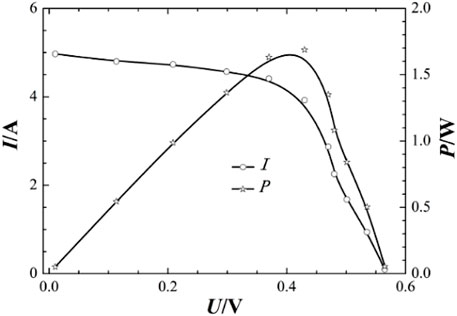
FIGURE 9. Photovoltaic characteristics of monocrystalline silicon cells.
According to the fill factor calculation method (Ju et al., 2012), it can be obtained that the fill factor of the monocrystalline silicon cell is 0.65 with solar concentration.
The calculation formula of power generation efficiency of the monocrystalline silicon cell is as follows:
where Acell is the surface area of monocrystalline silicon cells, Ps,c is the energy flux density in the focal plane, and β is the angle between the sunlight incident ray and the normal of the glass mirror mounting plane. During the experiment, the sunlight is incident vertically to the glass mirror installation plane, so we take β = 0.
According to the experimental data, the power generation efficiency of the cell is 17.1%. The results show that the power generation efficiency of the monocrystalline silicon cell does not decrease under the concentrating condition because of the uniform distribution of the concentrating spot energy flux density.
In order to analyze the heat collection performance of the linear Fresnel reflection solar concentrator, an experimental platform with solar cylindrical collector tubes as radiation receivers was established.
During the experiment, the heat conduction oil flows out of the oil box and passes through the flowmeter for measuring its instantaneous flow rate. The concentrator reflects the Sun’s rays onto the vacuum collector tubes, heating the heat conduction oil flow in. The thermocouple measures the temperature of the heat conduction oil at the inlet and outlet of the vacuum collector tubes. Combined with the solar radiation power received by the collector tubes, the photothermal conversion efficiency of the concentrator was calculated.
In this experiment system, the heat conduction oil flows through two heat collecting tubes. In order to increase the time for the heat conduction oil to receive solar radiation, the flow velocity of the heat conduction oil should be reduced as much as possible. When the flow velocity is low, the liquid in the pipeline mostly exists in a laminar flow state (Zhang, 1998), and the Reynolds number Re should be satisfied,
where u is the flow velocity of the oil, d is the inner diameter of the pipeline, and νo is the kinematic viscosity of the fluid in the pipeline (unit: m2/s). Therefore, the flow velocity u can be expressed as follows:
The flow rate Q of the fluid in the pipeline can be expressed as follows:
In the experiment, the inner diameter of the vacuum solar collector tube is d = 60 mm. When the temperature of thermal oil is 50°C, the kinematic viscosity νo = 9.022 × 10⁻⁵ m2/s and the calculated flow rate Q should be controlled below 8.18 m3/h. When the temperature is 150°C and νo = 8.11 × 10⁻⁶ m2/s, Q should be less than 3.19 m3/h. When the temperature increases to 300°C and νo decreases to 1.67 × 10⁻⁶ m2/s, Q should be kept below 0.66 m3/h.
The pump provides the power required for the flow of heat conduction oil in the loop, including the height pressure h difference required to start the loop, fluid resistance along the loop hf1, and local resistance loss hf2 (Zhang, 1998), where
In the formula, lt is the total length of the loop pipe, and lt = 20 m. The lower the temperature, the larger the νo, and therefore the larger the hf1, the greater the pump head required. According to the formula, when the temperature of the heat conduction oil is 50°C, hf1<5.6 m. Local resistance loss hf2 comes from the resistance of devices such as bends, oil box, flowmeter, thermometers, and necessary valves and filters. In this experimental system, drag coefficient ζ = 17 (Zhang, 1998), which was substituted into Eq. 17 to obtain hf2<10.5 m. The maximum h is 3.5 m, hf1 is 5.6 m, and hf2 is 10.5 m, so the minimum pump head required by the system platform is approximately 19.6 m.
Combined with the aforementioned analysis, we chose the oil pump head as 20 m, the flow rate as 3 m3/h, and the flow rate test range of the flowmeter as 0.3–3.8 m3/h. The physical picture of the experimental platform is shown in Figure 10.
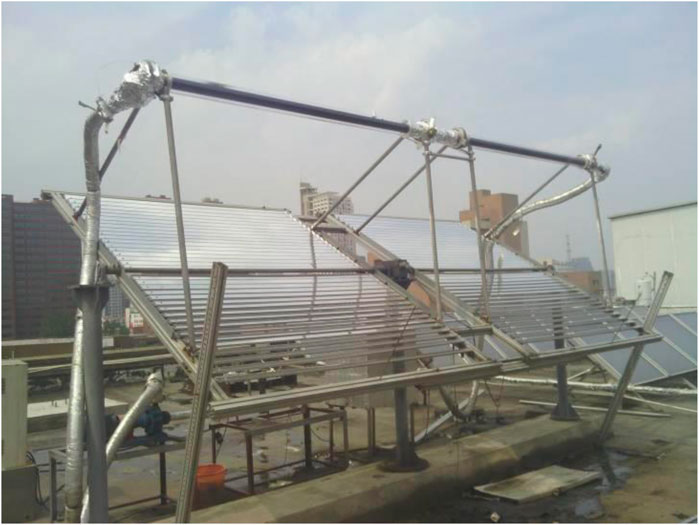
FIGURE 10. Physical picture of the experimental platform.
Two collector tubes are used in series: the inner diameter of the collector tube is 2r = 60 mm, the length of one single collector tube is l0 = 1.92 m, the installation height of the collector tube is a = 1.2 m, and the spacing between the two collector tubes is l′ = 0.6 m. The relevant parameters of the reflective mirror can be calculated according to the parameters of the experimental platform. Glass mirrors are arranged on both sides of the collector tube (17 pieces and 18 pieces).
In practical application, the reflectivity of the glass mirror cannot reach the ideal value, and the transmittance of the glass enclosure and coating absorptivity of the vacuum collector tube also have certain loss. According to the calculation method of reflectivity, transmittance, and absorption rate in the spectral range adopted by Wang et al. (2011), relevant parameters of the glass mirror and collector tube in the experimental system were analyzed and calculated successively.
For glass mirrors, the spectral transmittance can be considered 0, so the sum of absorptivity and reflectance is equal to 1. The solar spectrum is divided into bands, and the average reflectance of the glass mirror ρm is approximately equal to the ratio of the reflected energy of the glass mirror to the solar radiation energy.
where ρλ,m is the reflectivity of the glass mirror when the wavelength is λ and Es(λ) is the solar spectral irradiance.
The ratio of the solar spectral radiation energy to the total solar spectral radiation energy under direct sunlight can be regarded as the spectral transmittance of a certain material. If the absorption ratio of the glass enclosure of the vacuum collector tube is 0, the average transmittance τg can be expressed as follows:
where τλ,g is the transmittance of the glass enclosure of the vacuum collector tube when the wavelength is λ.
The average absorption rate of the collector tube coating αad can be expressed as follows:
where ρλ,ad is the reflectivity of the endothermic coating of the collector tube when the wavelength is λ.
The spectral reflectivity of the glass mirror, the spectral transmissivity of the glass enclosure of the collector tube, and the spectral absorptivity of the absorption coating of the collector tube are shown in Figure 11 under each band (Δλ = 10 nm) within the radiation spectral range (280 nm–2430 nm). In equations (18)–(20), n = 216, λ1 = 280 nm, and λ216 = 2430 nm. Under the standard direct solar spectrum radiation (AM1.5D) (ASTM G 173-03, 2003), the average reflectance of the glass mirror ρm = 94.82%, the average transmittance of the glass enclosure of the collector tube τg = 90.99%, and the average absorption rate of the heat absorption coating of the collector tube αad = 96.78%, as shown in Figure 12.
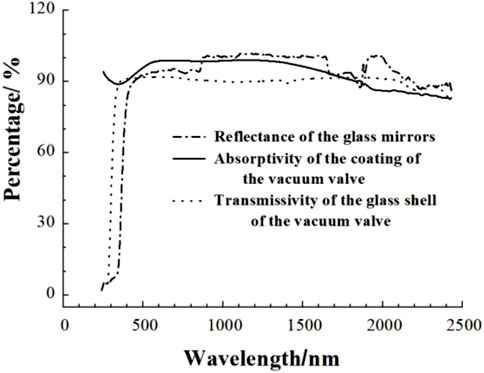
FIGURE 11. Spectral reflectivity of the glass mirror, the spectral transmissivity of the glass enclosure of the collector tube, and the spectral absorptivity of the absorption coating of the collector tube.
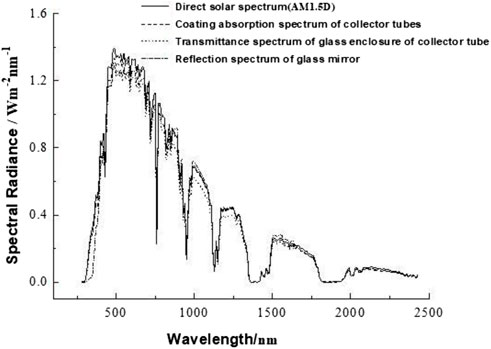
FIGURE 12. Reflection spectrum of the glass mirror, transmittance spectrum of the glass enclosure, and absorption spectrum of the coating of the collector tube.
The angle between the sunlight and the normal line of the reflection plane β can be regarded as the solar hour angle.
where N is the number of hours in a day (24 h).
In this experimental system, the length of the radiation coating of a single vacuum collector tube l0 = 1.92 m, the length of the connecting segment between the two collector tubes l′ = 0.6 m, and the installation height of the collector tube a = 1.2 m. Figures 13A–E show the solar rays of the concentrating system reflected at several specific moments. According to the geometry, βa = 74.876°, βb = 64.537°, βc = 57.995°, βd = 26.565°, and βe = 0°.
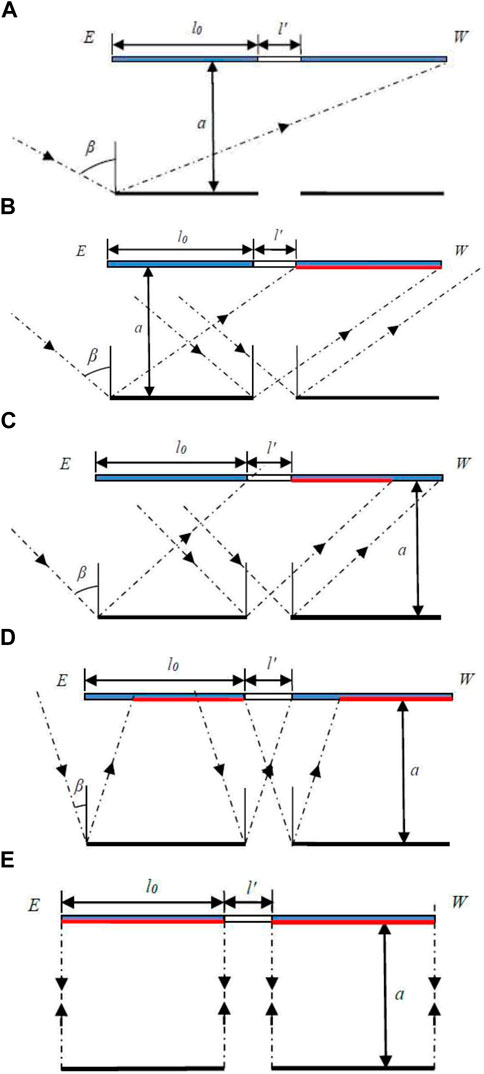
FIGURE 13. Effective radiation.
After 12:00 at noon, the effective radiation area is opposite to that in the morning position, and the value of β is consistent with that recorded in the morning. According to the different incident angle, the effective heat length l can be expressed as follows:
The ratio of the effective heat collection length to the total length of the radiation coating is defined as the heat collection length utilization rate ηc,
Sun Shoujian’s research on straight-through vacuum collector tubes (Sun, 2009) reveals the emissivity of high-temperature selective absorption coating Cu/Cr-Ni-A1-N/A1N to be εad ≤ 0.15 (350°C).
Considering that the plane reflection frame is partially blocked in the direction of sunlight incidence and the radiation energy of sunlight directly irradiating on the vacuum collector tube, the theoretical photothermal conversion efficiency of the concentrator ηt,th can be approximated, given the reflectivity of the glass mirrors ρm, the transmittance of the glass enclosure of the vacuum collector tube τg, the absorption rate of the selected absorption coating αad, and the emissivity of the collector tube coating εad (Kalogirou, 2004; Xiong et al., 2009; Singh et al., 2010; Xiong et al., 2010; Xie et al., 2011).
where Is represents the solar direct radiation intensity, Pm is the radiation power received by the glass mirror in the direction of sunlight incidence, Pc is the effective radiated power received by the collector tube, and Eb,T is the full wavelength radiant energy exchanged between the blackbody per unit surface area and the environment.
In the aforementioned formula, Tout is the outlet temperature of the vacuum collector tube, T0 is the ambient temperature, and T0 = 298 K. σ is the Stefan–Boltzmann constant.
Figure 14 shows the variation rule of theoretical photothermal conversion efficiency at 12:00 noon (β = 0°) with collector heat temperature Tout and solar direct radiation intensity Is. As can be seen from the figure, when solar radiation intensity Is is constant, the theoretical photothermal conversion efficiency ηt,th decreases gradually with the increase in heat collector temperature Tout. For the same collector temperature Tout, the higher the radiation intensity received by the collector tube, the greater the theoretical photothermal conversion efficiency ηt,th. When the radiation intensity received by the collector tube is lesser and the heat collection temperature is higher, the efficiency ηt,th is smaller. For example, when the temperature of the heat conduction oil is 240°C and the solar radiation energy flow density is 200 W/m2 (the radiation power received by the collector tube is 1569 W), the theoretical efficiency ηt,th is only approximately 0.64. Therefore, the heat collection oil temperature should not be too high in practical applications.
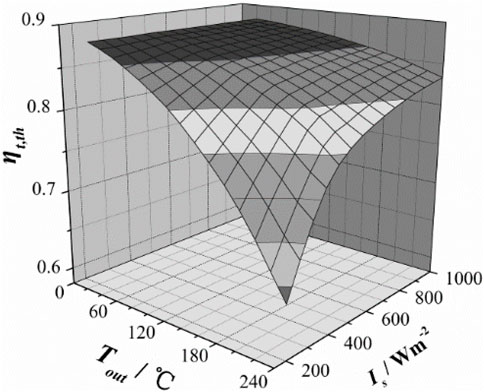
FIGURE 14. Theoretical photothermal conversion efficiency (β = 0°).
In this experimental system, it takes very less time for the heat conduction oil element to travel from the inlet to the outlet of the collector tube, so β can be regarded as constant, and so can the effective heat collection length. The outlet temperature Tout experiences less change in a short time, and the inlet and outlet temperature of the collector tube at the same time can be approximately regarded as the temperature of the same liquid microelement flowing through the inlet and outlet of the collector tube. The experimental photothermal conversion efficiency of the concentrator ηt can be expressed as the ratio of the heat stored by the temperature rise of the heat conduction oil in the system loop to the total amount of incident solar light received by the vacuum collector tube (Singh et al., 2010; Hou et al., 2011).
where ρo is the density of heat-conducting oil, cp is the specific heat capacity of heat-conducting oil, Qt is the instantaneous flow value measured by the flowmeter, and Tout and Tin are the outlet and inlet temperatures of the vacuum collector tube, respectively.
The direct solar energy flux density was measured by direct radiometer TBS-2–2 (Jinzhou Sunshine Meteorological Technology Co., LTD.). During the experiment, the heat conduction oil flows out of the oil box and passes through the flowmeter for measurement of its instantaneous flow rate. The concentrator reflects the Sun’s rays onto the vacuum collector tubes, heating the heat conduction oil flow in. The thermocouple measures the temperature of the heat conduction oil at the inlet and outlet of the vacuum collector tubes. Combined with the solar radiation power received by the collector tubes, the photothermal conversion efficiency of the concentrator was calculated.
A number of experiments were conducted under different flow rates and direct solar energy flow densities. The fitting curves of experimental data and photothermal conversion efficiency are shown in Figures 15–17.
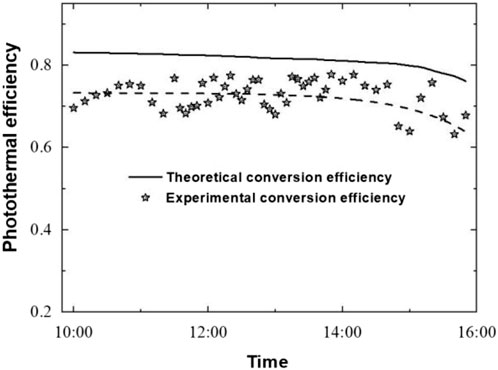
FIGURE 15. Theoretical and experimental photothermal conversion efficiency (group 1).
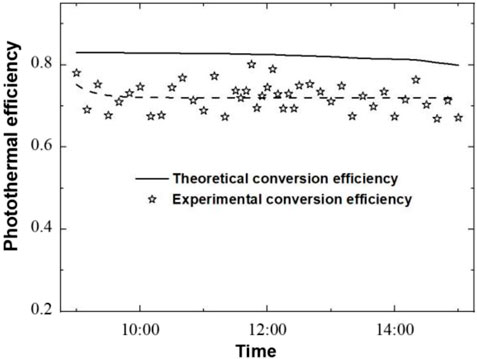
FIGURE 16. Theoretical and experimental photothermal conversion efficiency (group 2).
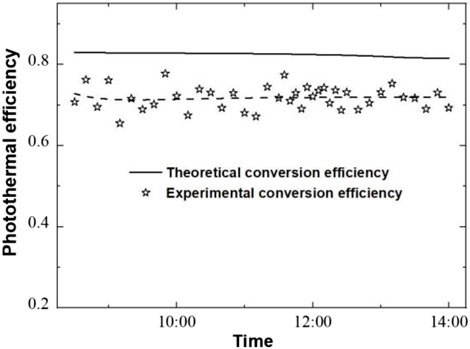
FIGURE 17. Theoretical and experimental photothermal conversion efficiency (group 3).
As can be seen from the experiments, the higher the average radiation power that the collector tube receives in a day, the higher the maximum heat collection temperature it can reach. The heat collection temperature begins to decline at about 13:00. The higher the average radiated power is, the later the temperature begins to decrease.
The higher the temperature is, the greater the radiation of the collector tube is, and the experimental and theoretical photothermal conversion efficiency both decrease. After 15:00, the effective heat collection length of the heat collection tube gradually decreases, and the efficiency decreases obviously. With the same average energy flow density and the different flow rates (the flow rate in Figure 15 is approximately 1.05 m3/h and approximately 0.75 m3/h in Figure 17), and the heat collection efficiency is basically the same, which is approximately 0.74. Therefore, the flow rate has little effect on the photothermal conversion efficiency of the concentrator. As shown in Figure 16, the collector tube receives the highest radiation intensity, reaches the highest peak temperature, and the radiation power of the collector tube coating is also the largest, but the photothermal conversion efficiency can still be maintained at approximately 0.74. Therefore, it can be inferred that at the same heat collection temperature, the higher the radiant energy flow density is, the higher the heat collection efficiency of the system will be, which is consistent with the theoretical efficiency analysis result in Figure 14. As shown in the three groups of figures, the theoretical heat collection efficiency can be maintained above 0.8 before 15:00, but the experimental heat collection efficiency is relatively low, which is due to the dust in the glass mirrors and the glass enclosure of the heat collecting tube, experimental installation error, and insufficient mixing of heat conduction oil in the heat collecting tubes.
Because the reflectivity of the glass mirrors ρm, the transmittance of the glass enclosure of the vacuum collector tube τg, and the absorption rate of the selected absorption coating αad are less than 1, all of the sunlight received by the concentrator cannot be incident on the collector tube coating, and a part of the heat is lost. The high temperature collector tube radiates heat to the environment, and another part of heat is lost. Therefore, the theoretical photothermal conversion efficiency and experimental photothermal conversion efficiency of the concentrator are less than 1.
Using second-order exponential fitting, the experimental conversion efficiency fitting curve was obtained. The change trend of the fitting curve and the theoretical conversion efficiency curve is basically the same, and the fitting effect is good. By comparing the theoretical value with the experimental fitting value, the experimental conversion efficiency is approximately 90% of the theoretical conversion efficiency. The reasons for the experimental error are the glass mirror installation error, a small amount of dust on the glass mirrors and the glass cover of the collector during the experiment, and the radiation rays received on the focal surface of the cylinder being less than those in the theoretical state.
Limited by the experimental site, the number of collector tubes connected in series is only 2. The heat conduction oil circulates in the collector tube, receives solar radiation for a short time, and cannot reach a high heat collection temperature. In order to better analyze the heat collection performance of the linear Fresnel reflector, it is necessary to study the photothermal efficiency under high-temperature conditions.
In the heat collection experiment, the system power drive equipment (motor; pump) and the valve device in the loop pipeline are closed so that the heat transfer oil in the collector tube is in a static state and the temperature of the heat transfer oil can be rapidly increased in a short time. The photothermal conversion efficiency can be expressed as follows:
where dt is the duration of the static state of the heat conduction oil in the collector tube, and dT is the temperature rise of the heat conduction oil in the vacuum collector tube within dt time.
In this paper, the experiment is shown to be carried out at around 12:00 noon, and dt was taken as 3 min. At this time, the collector tube could basically receive all the solar radiation reflected by the concentrator, and β could be approximately considered unchanged. The east and west ends of the collector tube were selected as temperature measuring points, and two groups of experiments were carried out. Experimental data and fitting curves of photothermal efficiency are shown in Figure 18 and Figure 19.
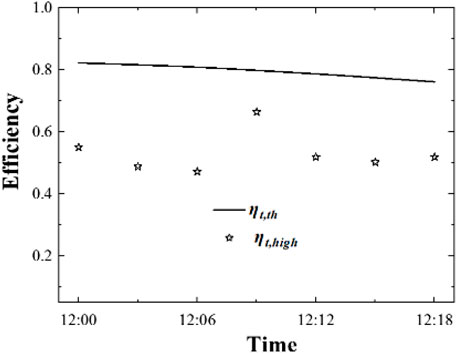
FIGURE 18. Photothermal conversion efficiency at the east end of the collector tubes.
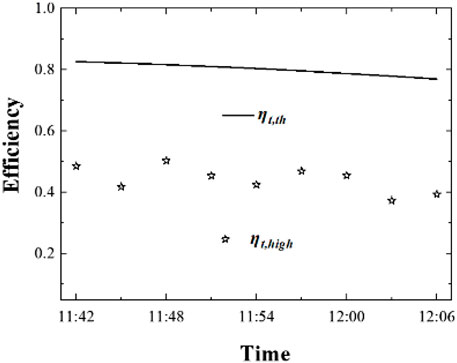
FIGURE 19. Photothermal conversion efficiency at the west end of the collector tubes.
As shown in Figures 18, 19, the average irradiation intensity of the two groups of experiments is basically the same. The photothermal conversion efficiency of the measuring point at the west end of the collector tube at high temperature is approximately 0.45, and the efficiency of the measuring point at the east end of the collector tube is approximately 0.53. Compared with the theoretical photothermal conversion efficiency is lower. There is no stop valve at the west end of the collector tube, and there is a heat conduction phenomenon between the temperature measuring point and the heat conduction oil in the loop pipe during the heat collection, so the photothermal conversion efficiency is lower than that at the east end of the collector tube. By comparing with Figures 15–17, it can be seen that as the temperature continues to increase, the photothermal conversion efficiency gradually decreases. The reason is that the transmitting power of the collector tube coating increases at high temperature and more energy is lost. In the application of photothermal power generation, the heat loss under high-temperature conditions should be fully considered.
In this paper, a new linear Fresnel reflection solar concentrating system is proposed, the characteristics of the concentrator are analyzed according to the specific structure of the concentrator, and two small experimental systems are established according to the design principle.
The experimental results of the flat focal plane reception system show that this type of concentrator can obtain the concentrator spot with uniform intensity distribution on the focal plane. Through testing the voltammetric characteristics of monocrystalline silicon cells under the condition of concentrating light, it has also been found to have high power generation efficiency. Therefore, this type of concentrator is applied to the field of photovoltaic power generation, which can save a lot of solar cell components. In the photothermal experiment, a double-tube heat collector is used. By analyzing the heat collection efficiency of the concentrator under the condition of placing two collector tubes in series, it can be obtained that the heat collection efficiency of the concentrator system can reach approximately 0.74 when the heat collection temperature is below 120°C. The heat collection efficiency of the system decreases with the increase in temperature, but the flow of heat conduction oil in the system loop has little effect on the heat collection efficiency. At the same heat collection temperature, the greater the radiant energy flow density, the higher the heat collection efficiency. In general, the linear Fresnel reflection solar concentrator has high heat collection efficiency. Through the high-temperature heat collection experiment, it can be seen that as the temperature continues to increase, the photothermal conversion efficiency gradually decreases. In practical applications, the length of the heat collecting area should be increased as much as possible, and the heat collecting time of heat-conducting oil in the heat collecting tube can be extended, and the temperature can quickly meet the requirements of industrial application.
It should be noted that the experiment presented in this paper is carried out under specific conditions. The experimental results may be slightly different under other different experimental conditions. For example, the measurement accuracy of direct radiation instruments, sensitivity of temperature sensors, and ambient temperature will have a certain impact on the experimental results. When the number of single-side glass mirrors is 15–20, the area utilization rate will not be too small while maintaining a high concentration ratio. Therefore, in the photovoltaic experiment and photothermal experiment platform in this paper, the number of single-side mirrors of the concentrator is not more than 20. In practical application, the experimental model can be referred to.
This type of solar concentrator uses smaller glass mirrors as a reflecting surface, compared with a large area of the parabolic trough reflection surface; its cost is relatively low; and installation is also more convenient. At the same time, the characteristics of concentrating uniformity can be directly applied to photovoltaic power generation, which is also a feature that other solar concentrators do not have. So, the linear Fresnel reflection solar concentrator has higher practical application.
The original contributions presented in the study are included in the article/Supplementary Material; further inquiries can be directed to the corresponding author.
QZ: data curation, methodology, project administration, software, writing–original draft, and writing–review and editing. SC: conceptualization, funding acquisition, investigation, and writing–review and editing. BY: software, validation, and writing–review and editing. LH: funding acquisition, supervision, and writing–review and editing.
The author(s) declare that no financial support was received for the research, authorship, and/or publication of this article. This work was supported by the University Introduced Talents and Doctor Starting Fund Project of Anhui Jianzhu University (Grant No. 2018QD55).
The authors declare that the research was conducted in the absence of any commercial or financial relationships that could be construed as a potential conflict of interest.
All claims expressed in this article are solely those of the authors and do not necessarily represent those of their affiliated organizations, or those of the publisher, the editors, and the reviewers. Any product that may be evaluated in this article, or claim that may be made by its manufacturer, is not guaranteed or endorsed by the publisher.
The Supplementary Material for this article can be found online at: https://www.frontiersin.org/articles/10.3389/fenrg.2023.1268687/full#supplementary-material
Alnajideen, M., and Gao, M. (2022). Hybrid photovoltaic-thermoelectric system using a novel spectral splitting solar concentrator. Energy Convers. Manag. 251, 114981. doi:10.1016/j.enconman.2021.114981
ASTM G 173-03 (2003). Standard tables for reference solar spectral irradiances[S]: direct normal and hemispherical on 37° tilted surface.
Beltagy, H. (2021). The effect of glass on the receiver and the use of two absorber tubes on optical performance of linear fresnel solar concentrators. Energy 224, 120111. doi:10.1016/j.energy.2021.120111
Coccia, G., Aquilanti, A., Tomassetti, S., Ishibashi, A., and Nicola, G. D. (2021). Design, manufacture and test of a low-cost solar cooker with high-performance light-concentrating lens. Sol. Energy 224, 1028–1039. doi:10.1016/j.solener.2021.06.025
Dai, J. M., and Liu, Y. (2008). Measurement and analysis of flux density distribution for spot focused by concentrator. Appl. Chem. 29 (6), 917–920.
Derindag, O. F., Maydybura, A., Kalra, A., Wong, W. K., and Chang, B. H. (2023). Carbon emissions and the rising effect of trade openness and foreign direct investment: evidence from a threshold regression model. Heliyon 9, 17448. doi:10.1016/j.heliyon.2023.e17448
Gupta, M., Dubey, A., Kumar, V., and Mehta, D. S. (2021). Experimental study of combined transparent solar panel and large Fresnel lens concentrator based hybrid PV/thermal sunlight harvesting system. Energy Sustain. Dev. 63, 33–40. doi:10.1016/j.esd.2021.05.008
Hassan, A., Chen, Q., Abbas, S., Lu, W., and Luo, Y. (2021). An experimental investigation on thermal and optical analysis of cylindrical and conical cavity copper tube receivers design for solar dish concentrator. Renew. Energy 179, 1849–1864. doi:10.1016/j.renene.2021.07.145
Hou, H., Gao, S., and Yang, Y. (2011). Thermodynamics analysis of mixed coal-fired power generation system aided by parabolic trough collective fields. Acta Energiae Solaris Sin. 32 (12), 1772–1776. doi:10.19912/j.0254-0096.2011.12.010
Hu, P., Zhang, Q., and Ze-Shao, C. (2011). A kind of solar concentrator with glass mirror fixed on a flat. Utility patent. Application No.: 201020130154.X. (Accessed January 26, 2011).
Jiang, S. (2009). Fundamental theory and ExperimentalStudy of reflective concentrating solar energy utilization. Hefei: University of Science and Technology of China.
Ju, X., Wang, Z., Flamant, G., and Zhao, W. (2012). Numerical analysis and optimization of a spectrum splitting concentration photovoltaic–thermoelectric hybrid system. Sol. Energy 86 (6), 1941–1954. doi:10.1016/j.solener.2012.02.024
Kalogirou, S. A. (2004). Solar thermal collectors and applications. Prog. Energy Combust. Sci. 30, 231–295. doi:10.1016/j.pecs.2004.02.001
Li, R., You, K., Cai, W., Wang, J., Liu, Y., and Yu, Y. (2023). Will the southward center of gravity migration of population, floor area, and building energy consumption facilitate building carbon emission reduction in China? Build. Environ. 242, 110576. doi:10.1016/j.buildenv.2023.110576
Liang, K., Zhang, H., Chen, H., Gao, D., and Liu, Y. (2021). Design and test of an annular fresnel solar concentrator to obtain a high-concentration solar energy flux. Energy 214, 118947. doi:10.1016/j.energy.2020.118947
Ma, X., Jin, R., Shen, L., Liu, S., and Zheng, H. (2020). Analysis on an optimal transmittance of Fresnel lens as solar concentrator. Sol. Energy 207, 22–31. doi:10.1016/j.solener.2020.06.071
Sagade, A. A., Samdarshi, S. K., Sagade, N. A., and Panja, P. S. (2021). Enabling open sun cooling method-based estimation of effective concentration factor ratio for concentrating type solar cookers. Sol. Energy 227, 568–576. doi:10.1016/j.solener.2021.09.035
Sharma, M. K., and Bhattacharya, J. (2020). A novel stationary concentrator to enhance solar intensity with absorber-only single axis tracking. Renew. Energy 154, 976–985. doi:10.1016/j.renene.2020.03.064
Shepovalova, O. V., Izmailov, A. Y., Lobachevsky, Y. P., Dorokhov, A. S., and Chirkov, S. V. (2021). Solar energy toroidal concentrators. Energy Rep. 7, 328–342. doi:10.1016/j.egyr.2021.07.117
Singh, P. L., Sarviya, R. M., and Bhagoria, J. L. (2010). Thermal performance of linear Fresnel reflecting solar concentrator with trapezoidal cavity absorbers. Appl. Energy 87, 541–550. doi:10.1016/j.apenergy.2009.08.019
Sun, S. (2009). Development and application of medium and high temperature straight through vacuum solar collector tube. Sol. Energy 10, 47–54.
Tsai, C.-Y. (2022). Design of free-form trough reflector for solar thermal concentrator system based on quadratic Bézier curves. Opt. Commun. 511, 128024. doi:10.1016/j.optcom.2022.128024
Wang, Q., Xu, G., Xu, X., and Huang, C. (2011). Preparation of Ag-Al2O3 solar selective absorbing coating. Acta Energiae Solaris Sin. 32 (12), 1748–1752. doi:10.19912/j.0254-0096.2011.12.006
Wang, W.-Q., Li, M.-J., Jiang, R., Hu, Y.-H., and He, Y. L. (2022). Receiver with light-trapping nanostructured coating: a possible way to achieve high-efficiency solar thermal conversion for the next generation concentrating solar power. Renew. Energy 185, 159–171. doi:10.1016/j.renene.2021.12.026
Xiao, J., Zheng, H., Jin, R., Shen, L., Wang, G., and Ma, X. (2021). Experimental investigation of a bubbling humidification-dehumidification desalination system directly heated by cylindrical Fresnel lens solar concentrator. Sol. Energy 220, 873–881. doi:10.1016/j.solener.2021.04.006
Xie, W. T., Dai, Y. J., and Wang, R. Z. (2011). Numerical and experimental analysis of a point focus solar collector using high concentration imaging PMMA fresnel lens. Energy Convers. Manag. 52, 2417–2426. doi:10.1016/j.enconman.2010.12.048
Xiong, Y., Kane Traore, M., Wu, T., Ma, C., and Zhang, Y. (2009). Trough solar energy concentrating and heat collecting technology. Sol. Energy 6, 21–26.
Xiong, Y., Wu, T., Ma, C., and Zhang, Y. (2010). Numerical study on thermal performance of Parabolic Trough solar concentrator. J. Eng. Thermophys. 31 (3), 495–498.
Xu, G., Wang, Y., and Rehman, H. (2023). The future trajectory of carbon emissions in the process of carbon neutrality in South Korea. J. Environ. Manag. 345, 118588. doi:10.1016/j.jenvman.2023.118588
Yao, Y., Sun, Z., Li, L., Cheng, T., Chen, D., Zhou, G., et al. (2023). CarbonVCA: a cadastral parcel-scale carbon emission forecasting framework for peak carbon emissions. Cities 138, 104354. doi:10.1016/j.cities.2023.104354
Zhang, Y., Zhang, W., Ye, Y., Li, K., Gong, X., and Liu, C. (2022a). CsPbBr3 nanocrystal-embedded glasses for luminescent solar concentrators. Sol. Energy Mater. Sol. Cells 238, 111619. doi:10.1016/j.solmat.2022.111619
Zhang, Y., Qiu, Y., Li, Q., and Henry, A. (2022b). Optical-thermal-mechanical characteristics of an ultra-high-temperature graphite receiver designed for concentrating solar power. Appl. Energy 307, 118228. doi:10.1016/j.apenergy.2021.118228
Keywords: linear Fresnel, reflection, solar, concentrator, power generation efficiency, photothermal conversion efficiency
Citation: Zhang Q, Chen S, Yuan B and Huang L (2023) Experimental study of a linear Fresnel reflection solar concentrating system. Front. Energy Res. 11:1268687. doi: 10.3389/fenrg.2023.1268687
Received: 28 July 2023; Accepted: 17 October 2023;
Published: 09 November 2023.
Edited by:
Anurag Roy, University of Exeter, United KingdomReviewed by:
Qilin Cai, Soochow University, ChinaCopyright © 2023 Zhang, Chen, Yuan and Huang. This is an open-access article distributed under the terms of the Creative Commons Attribution License (CC BY). The use, distribution or reproduction in other forums is permitted, provided the original author(s) and the copyright owner(s) are credited and that the original publication in this journal is cited, in accordance with accepted academic practice. No use, distribution or reproduction is permitted which does not comply with these terms.
*Correspondence: Qian Zhang, ZG91NjE2QDEyNi5jb20=
Disclaimer: All claims expressed in this article are solely those of the authors and do not necessarily represent those of their affiliated organizations, or those of the publisher, the editors and the reviewers. Any product that may be evaluated in this article or claim that may be made by its manufacturer is not guaranteed or endorsed by the publisher.
Research integrity at Frontiers
Learn more about the work of our research integrity team to safeguard the quality of each article we publish.