 Chang Xu
 Zhixiong Jiao
 Xingxing Han1*
 Jincheng Wang
95% of researchers rate our articles as excellent or good
Learn more about the work of our research integrity team to safeguard the quality of each article we publish.
Find out more
METHODS article
Front. Energy Res. , 09 November 2023
Sec. Wind Energy
Volume 11 - 2023 | https://doi.org/10.3389/fenrg.2023.1268291
Compared to nearshore wind farms, deepwater offshore wind farms have better wind resources and broader development space and will be the main trend of wind power development in the future. Due to the long distance from the shore, the investment and operation costs of the transmission system in a deepwater wind farm cluster are high and the electricity generated by the cluster is commonly transmitted by high-voltage direct current transmission technology to decrease power losses. For a given converter station, the comprehensive optimization of the layouts of the substations, AC export cables from the substation to the converter station, and cable arrays within each wind farm are complex and have not been well studied. This paper proposes a multi-level nested optimization strategy to minimize the total cost of the collection cables for a deepwater offshore wind farm cluster. The proposed method applies the Informed-RRT* method to optimize the layout of AC export cables while the cable arrays are arranged by Prim’s algorithm. During the optimization process, the gradient descent algorithm is used to optimize the positions of the substations, obtaining the transmission system scheme with the minimum cable investment. For a certain deepwater wind farm cluster, the total cable cost after optimization is reduced by 3.58%, which indicates the effectiveness of this method.
Offshore wind energy has the advantages of large reserves, high power density, stable wind speeds, and proximity to load centers. The offshore wind power of China has experienced rapid development in recent years, with an added capacity of 5.16 GW and a cumulative installed capacity of 30.51 GW in 2022 (Global Wind Energy Council, 2022). The exploitable potential of deepwater wind power in China is estimated to be approximately 1582 GW, which is much larger than that in nearshore areas (World Bank Group, 2020). Furthermore, the development of deepwater wind power faces fewer constraints and offers greater development space, making it suitable for large-scale concentrated development.
Compared to the widely used high-voltage alternating current (HVAC) transmission, high-voltage direct current (HVDC) transmission without reactive loss has significant technical and economic advantages, particularly for long-distance transmission in deepwater offshore wind farm clusters (Fischetti and Pisinger, 2018; Liu et al., 2020). The offshore wind farm cluster transmission system (OWFCTS) is illustrated in Figure 1 and Figure 2. The electricity generated by wind turbines is first boosted at the offshore substation, transmitted through high-voltage AC cables (AC export cables) to the offshore converter station, rectified into high-voltage direct current, and then, transmitted via high-voltage DC cables (DC export cables) to the onshore substation. Based on the experience of nearshore wind farms, the investment in the offshore wind farm transmission system (offshore substation + array cable lines + AC export cables) accounts for over 15% of the total wind farm investment (Yang et al., 2022). As a deepwater wind farm cluster has a longer distance from the shore, the proportion of investment in the transmission system will further increase. Therefore, optimizing the path of the transmission system can effectively reduce the investment cost of offshore wind power.
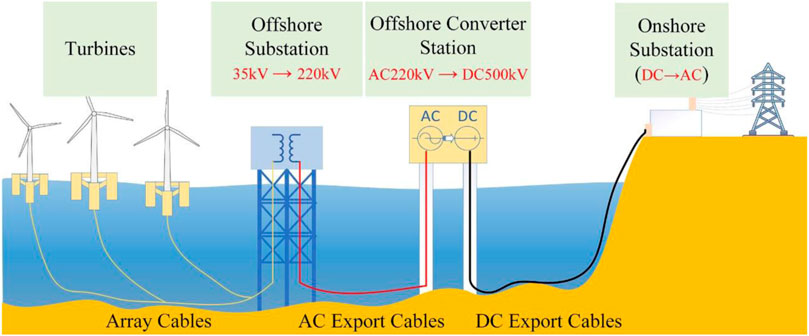
FIGURE 1. Schematic diagram of power conversion of the deepwater wind farm cluster.
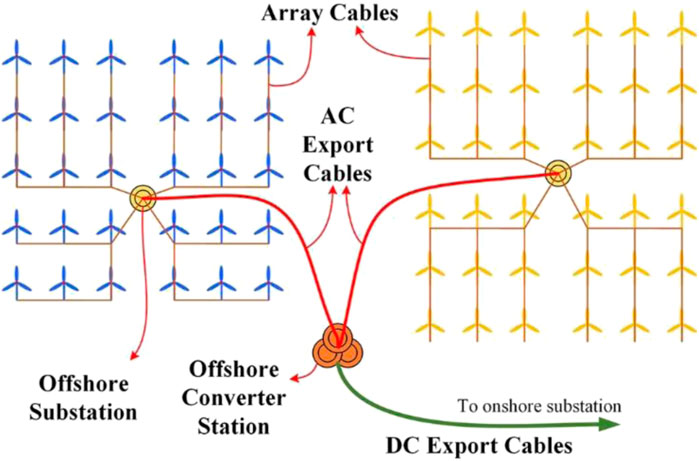
FIGURE 2. Schematic diagram of the offshore wind farm cluster’s transmission system.
The design of the transmission system for offshore wind farm cluster is an integrated optimization problem that can be divided into three layers: (1) optimization for the offshore substation location, (2) path optimization for the array cables in the wind farm, and (3) path optimization for the AC export cables connecting the substation and the converter station. Before optimizing the OWFCTS comprehensively, the planned capacity of the wind farm needs to be determined. Rui Wang et al. proposed an accurate current sharing and voltage regulation based on the distributed adaptive dynamic programming approach in a power grid with a wind farm, which could control the variable and achieve accurate current to protect the power grid (Wang et al., 2022). Wang Rui et al. proposed the guardian map theory based on the Kronecker sum regarding the impedance-based approach in polar coordinates, which guides the system obtaining wind farm planning and stabilization method research (Wang et al., 2020). In terms of the optimization of the offshore substation location, Won-Sik Moon et al. employed a genetic algorithm to optimize the location to minimize the overall cost (Moon et al., 2014). Peng Hou et al. used an exhaustive search method to find the optimal location for the substation (Hou et al., 2015). Je-Seok Shin et al. introduced a methodology to design an optimal cable layout of the inner grid as well as the location of the offshore substation (Shin and Kim, 2016). Mokhi et al. compared the effectiveness of particle swarm optimization and genetic algorithm in optimizing the substation location and found that the particle swarm optimization algorithm yielded faster optimal results but had the issue of uneven loop division in the collection lines (El Mokhi and Addaim, 2020). Yang et al. 2020 searched for the location with the minimum cost for the substation along a straight line between the centroid of the wind farm and the point with the minimum offshore distance. They found that the booster station location was primarily influenced by the price of AC export cables, where a higher cable price resulted in a closer offshore location for the substation. However, this research did not prove that the global optimum value could be obtained on this straight line (Yang et al., 2022). Regarding the optimization of the collection line path, it is common to divide the circuits using k-means clustering (Shin and Kim, 2016) or fuzzy C-means clustering (Zuo et al., 2019) and then connect the cables with the shortest path using the minimum spanning tree (MST) method. Cazzaro D et al. encoded the positions of the wind turbines and substations and used a heuristic algorithm to optimize the path of the collection lines (Cazzaro et al., 2020). Fischetti M and Ulku I transformed the topological structure of the wind farm collection lines into a mixed-integer linear programming (MILP) model for optimization and solution (Fischetti and Pisinger, 2018; Ulku and Alabas-Uslu, 2020). The HVDC transmission system, as compared to the HVAC transmission system, requires the inclusion of converter stations. The cost of cables exhibits an exponential relationship with transmission capacity (Lundberg et al., 2003). Hence, as the capacity of the offshore wind farm increases, the transmission system cost also experiences a significant increase. Typically, the locations of wind turbines and converter stations in a deepwater offshore wind farm cluster are selected first. By optimizing the locations of offshore substations and the length of transmission cables, the investment in the wind farm can be minimized. The deepwater offshore wind farm cluster with HVDC transmission systems is the future trend of offshore wind power. However, there is limited research focusing on the optimization of transmission systems. This paper proposes an integrated optimization method to optimize the path of the transmission system in a deepwater offshore wind farm cluster in three steps: array cable optimization, substation location optimization, and AC export cable path optimization. In particular, the array cables are independently optimized within the wind farm, whereas the AC export cables need to be cooperatively optimized across multiple wind farms to prevent cable cross, which could simplify the complexity associated with optimizing the wind farm’s transmission system. Finally, a validation case on the wind farm cluster in a certain sea area is presented.
In this paper, the locations of wind farm substations are adapted by a gradient descent algorithm in the direction of a decreasing transmission system cable cost gradient while an inner optimization of AC export cable paths and array cables is carried out. Figure 3 shows the algorithmic flow of this method. Initially, the position of the substation is randomly generated around the geometric center of the wind farm. Based on this position, we use the Informed-RRT* method (Gammell et al., 2014) described in Section 2.2 to optimize the AC export cable paths and Prim’s algorithm to optimize array cables, respectively. After each optimization step, the cost of all cables at that position is calculated and compared with the cable cost at the last position. If the cost decreases, the position is considered valid. Otherwise, we return to step 1. The optimization process for the substation position is called the gradient descent method, which is described in detail in Section 3.1. Prim’s algorithm was extensively studied, and this paper adopts the research results of the work of Shin et al. to optimize the array cables (Shin and Kim, 2016). Specifically, the k-means clustering method based on genetic algorithms is used for the feeder division, followed by the Prim method to generate the topology of the array cables.
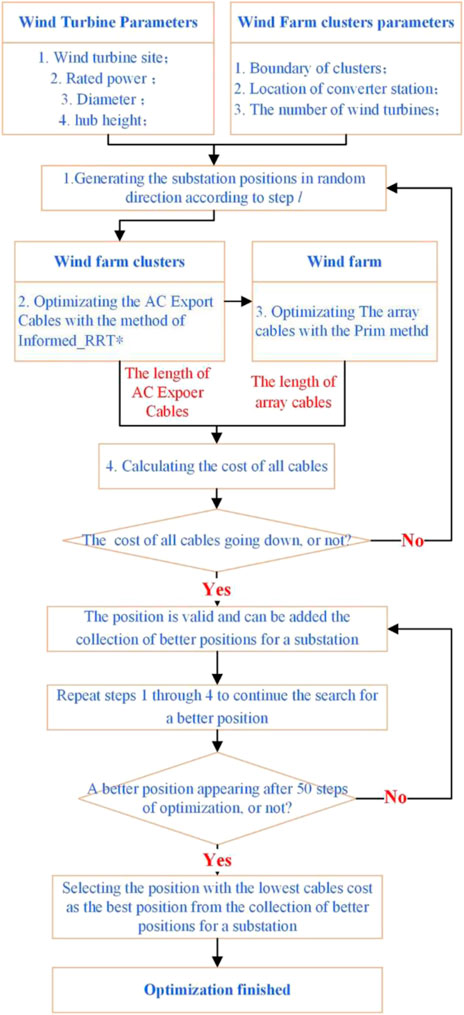
FIGURE 3. OWFCTS optimization technology route.
The topological structure of the array cables of the offshore wind farm cluster can be regarded as a directed graph. As a collection of wind farm array cables and AC export cables, the OWFCTS can be represented as follows:
where ECi is an AC export cable; G (V, A) is the set of array cables of the wind farm, which consist of several feeders g (V, A), where V represents the vertex on each feeder, V0 is the substation at the end of the feeder, and V1∼Vk stand for wind turbines; A is the set of the length of array cables; and Amn is the length of the cable from turbine m to turbine n.
The OWFCTS generally uses several types of cables for economic reasons. The price of cables P is shown in Eq. 5, and Cmn (Eq. 6) is the cost of the cable from turbine m to turbine n. Figure 4 represents the array cables of any feeder in a wind farm, and the topology is represented, as shown in Eq. 7. To express a clear representation of the distribution of the cable cost of the OWFCTS, this paper introduces the degree matrix D to represent the cost of each segment of the cable in the wind farm. The elements in the degree matrix D are related to the weight matrix W, where Di = Wi1+ Wi2+…+ Wij. The traces of the matrix tr(D) which is the sum of the absolute values of the diagonal elements of the matrix in Eq. 9 is the total cost of the cables of any feeders of the array cables. As shown in Eq. 10, the total cost of the array cables is the sum of the traces of the matrix of the individual feeder. As shown in Eq. 11, the total cable cost of the OWFCTS is the sum of the cable cost of the array cables of the wind farms and the cost of the AC export cables, where Costi (Gi (V, A)) is related to the cable section areas and the length of the array cables. The cable section areas are first selected via the maximum long-term operating current method in Section 2.3 and then checked by the voltage drop. The cable length is obtained by the optimization of the Prim method. Costi (ECi) is related to the path length of the AC export cables that is optimized by the Informed-RRT* method presented in Section 2.2.
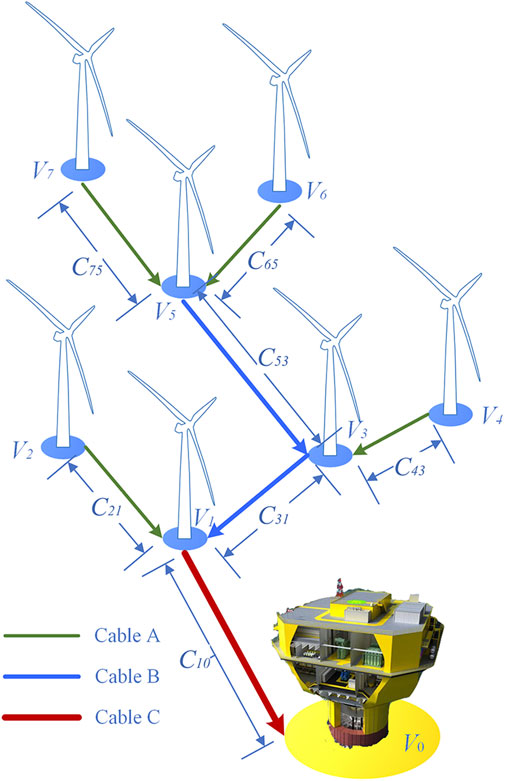
FIGURE 4. Schematic diagram of a feeder in the collection circuit of a wind farm.
Due to the long length and high cost of array cables, the method of maximum allowable continuous working current is applied to select economic cable section areas, which are then checked by the allowable voltage drop.
1) Maximum long-term operating current
As shown in Eq. 12, first, we calculate the maximum allowable continuous working current Ig of the wind turbines.
where N is the number of wind turbines in the feeder; Pe is the rated power (MW); UN is the rated voltage of cables (kV); and
where K is the comprehensive correction factor for different laying conditions. In the case of cable laying in offshore wind farms, K is given by
where K1 = 1.2 is correlated with soil thermal resistance in offshore wind farm cables; K2 is correlated with cable laying spacing; and Kθ is correlated with cable working environment temperature.
where θal is the maximum operating temperature of the cable (°C), which varies by the cable type; θ0 is the working environment temperature (°C); and θN = 15 °C is the reference ambient temperature corresponding to the rated load capacity in the offshore wind farm.
2) Voltage drop checking
According to [2], the cable voltage drop in the offshore wind farm array cables should not exceed 5% in each feeder. The percentage voltage drop during normal operation of the cable can be obtained from the following equation:
where L is the length of cables (km) and r and x are the resistance and reactance per unit length of the line (Ω/km), respectively.
The basic idea of the gradient descent algorithm is that the new substation is randomly generated on the circumference of a circle with the previous substation as the center until the cable cost decreases. Meanwhile, the searching step is dynamic due to the change in the cost to effectively find the optimal location. The algorithm also combines with a stochastic method to jump out of the local optimum. Based on the selected starting point, the gradient descent algorithm is used to optimize the location of the substation. The optimized starting point (x0, y0) is generally selected as the center of the wind turbine sites, as shown in the following equation:
The principle of substation location optimization by the gradient descent algorithm is shown in Figure 5 with the following steps:
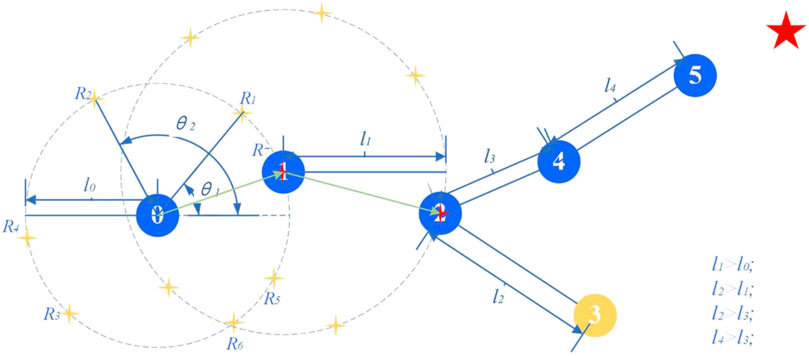
FIGURE 5. Schema of the gradient descent algorithm.
Step 1: Calculating the cable cost at the starting point: Taking (x0, y0) as the location of the substation, the Informed-RRT* method is used to optimize the AC export cable path, Prim’s algorithm is used to optimize the array cables, and then, the cable cost COST0 at the starting point (x0, y0) is calculated.
Step 2: first step of optimization: Taking (x0, y0) as the starting point, l0 as the initial step, and random azimuth θi as the direction, the random point Ri(xi, yi) is obtained. Then, taking Ri(xi, yi) as the boosting station, the Informed-RRT* method and Prim algorithm are used to optimize the AC export cable paths and the array cables, respectively, and the cost COST1 is calculated. If COST1<COST0, then the point is valid, and it is the starting point for the next step of random point generation; if COST1>COST0, the point is invalid, the azimuth θi is re-generated, and the aforementioned steps are repeated.
Step 3: The second step of optimization: Taking (x1, y1) as the starting point, random azimuth θi as the direction, and l1 as the step size, we obtain the random point Ri(xi, yi), where l1 = l0*k, k > 1. The value of k and the decline in the ΔCOST are related; the larger the ΔCOST, indicating a more substantial decline in the cost, the larger the k. Using the same method in step 2, we obtain the starting point of the next random point generation (x2, y2).
Step 4: Gradient descent algorithm optimization: Starting with this (x2, y2), the optimization process produces two scenarios.
Case 1: With (x2, y2) as the starting point and l2 = l1*k, k > 1 as the step, we obtain the random point Ri(xi, yi), and being able to find the point COSTi<COST2 is a good case to obtain (x3, y3).
Case 2: If the method of Case 1 is used to search for 10 points and still no (x3, y3) is found, then the step size is modified to l3` = l2*(1/k), k > 1, random points are generated, and the aforementioned steps are repeated to find (x3, y3).
Step 4 is repeated; if no superior position appears after 50 optimal steps, OWFCTS optimization is accomplished.
The RRT algorithm is a sampling-based path planning method; however, due to the randomness of its sampling, it resulted in the final generated path that is often only a feasible path rather than an optimized path. The Informed-RRT* algorithm improves on the RRT* method in three ways (Gammell et al., 2014): (1) the Informed-RRT* method first uses the RRT* method to find a feasible path, and second, it takes the starting point and the endpoint as the focus of the ellipse, forming an ellipse that envelopes the first path, and then, the random points generated in subsequent searches are only within the ellipse; (2) the Informed-RRT* method optimizes the path from the parent node to the new node after the new node is found; and (3) if the new node is randomly obtained to be on the side of the node start point of the already generated tree, the new node can be used to optimize the already generated tree and shorten the new node’s length of tree branches within the range. The Informed-RRT* method of searching the path is shown in Figure 6.
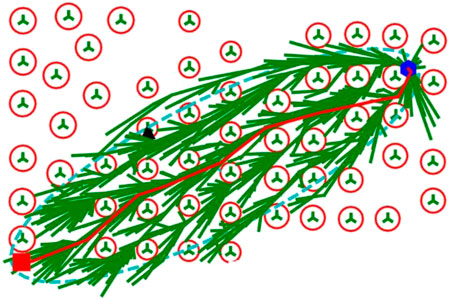
FIGURE 6. Schema of the Informed-RRT* method.
The main process of the Informed-RRT* algorithm is as follows:
Step 1: Taking the location of the substation as the starting point (xstart, ystart) of the randomized tree.
Step 2: Generating a random point (xrand, yrand) within the whole wind farm area, the random point has a certain probability of being the location of the converter station (xend, yend).
Step 3: Calculating the distance between each node in the random tree at this point and the generated random point (xrand, yrand) and finding the nearest node to this random point, denoted as (xnearest, ynearest).
Step 4: (xnearest, ynearest) is connected to (xrand, yrand), and then, it is determined whether this line segment intersects with an obstacle or a sensitive area; if it does not intersect, then this path is available; otherwise, we go back and re-select the random point (xrand, yrand).
Step 5: Optimizing the parent node of the new node (xnew, ynew): We search for the already generated nodes using a distance greater than the step size, and if there exists the point (x, y) such that the path from (x, y) to (xnew, ynew) is less than the path from (x, y) to (xnearest, ynearest) and then to (xnew, ynew), and there is no intersection with the obstacle yet, then (x, y) is selected as the parent node of the new node (xnew, ynew) to optimize the path.
Step 6: After the formation of a complete path through the aforementioned steps, the starting point and the endpoint serve as the vertices of the ellipse, generating an ellipse that encompasses the initial path, as shown in Figure 6, represented by the green line in the figure that is generated by the ellipse.
Step 7: continue to repeat steps 2 through 7, with the difference that the random points generated in step 2 are all within the ellipse. Optimization is continued until the number of optimizations reaches the set upper limit.
The obstacle to be avoided in the optimization is the wind turbine safety distance, which is defined as follows as shown by the red circle in Figure 6:
where H is the hub height of the wind turbine and D is the diameter.
The offshore wind farm cluster consists of three wind farms, with a total of 216 wind turbines and four types of turbines, whose total capacity is 1106.4 MW, as shown in Table 1. There is a converter station and three 220 kV offshore substations in the cluster. The layout of the turbines, substations, and converter stations in the wind farm cluster is shown in Figure 7. The blue dot in the figure represents the current location of the substation of the wind farm, which is close to the geometric center of the wind farm, and is also the starting point of the optimization. The wind farm uses 35 kV array cables to connect the wind turbines to the substation and then converges to the converter station through a 220 kV AC export cable. Due to the large capacity of the wind farm, this case selects nine types of 35 kV cables and three types of 220 kV cables, whose cost is based on the research of Lundberg et al. (2003) and calculated by the maximum capacity transmitted by the cable. The calculation method is shown in Eq. 19. The parameter selection is shown in Supplementary Table S1, and the parameter information and cost of each cable are shown in Table 2. In the optimization, the positions of the wind turbines and the converter station are fixed, and the positions of the substations in each wind farm are optimized in the direction of cable cost gradient descent. The optimization results are shown in Sections 3.1 and 3.2.
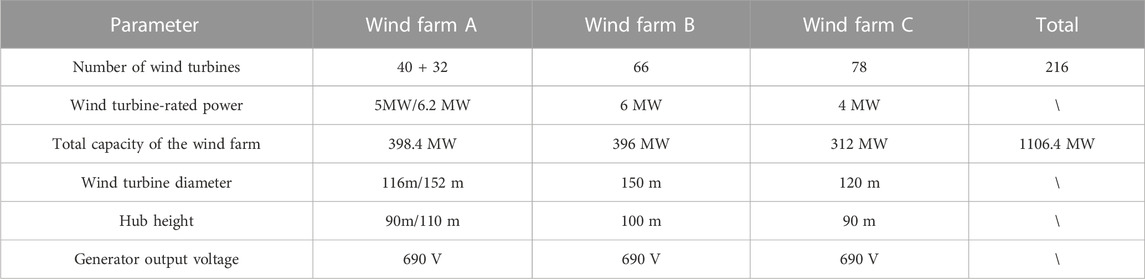
TABLE 1. Information about wind farms.
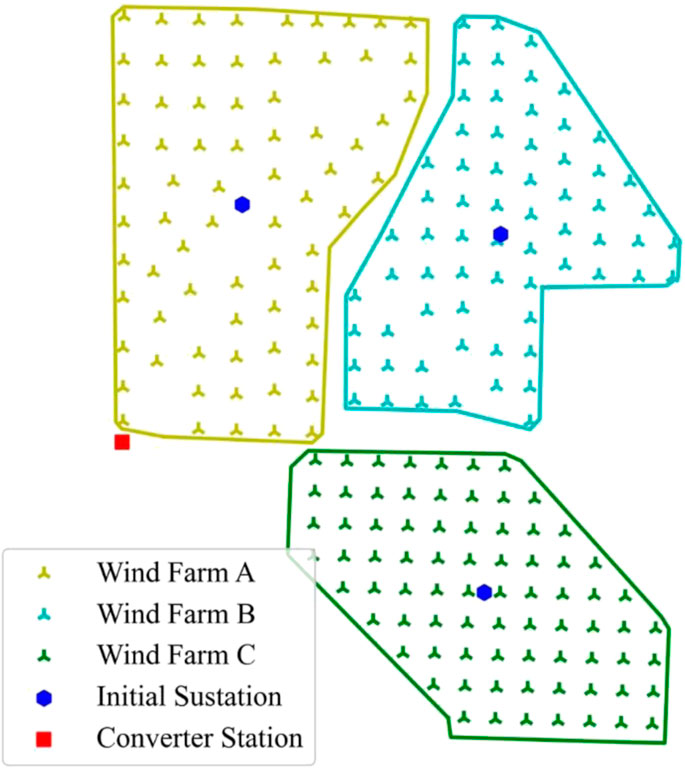
FIGURE 7. Distribution map of the main equipment of the wind farm cluster.
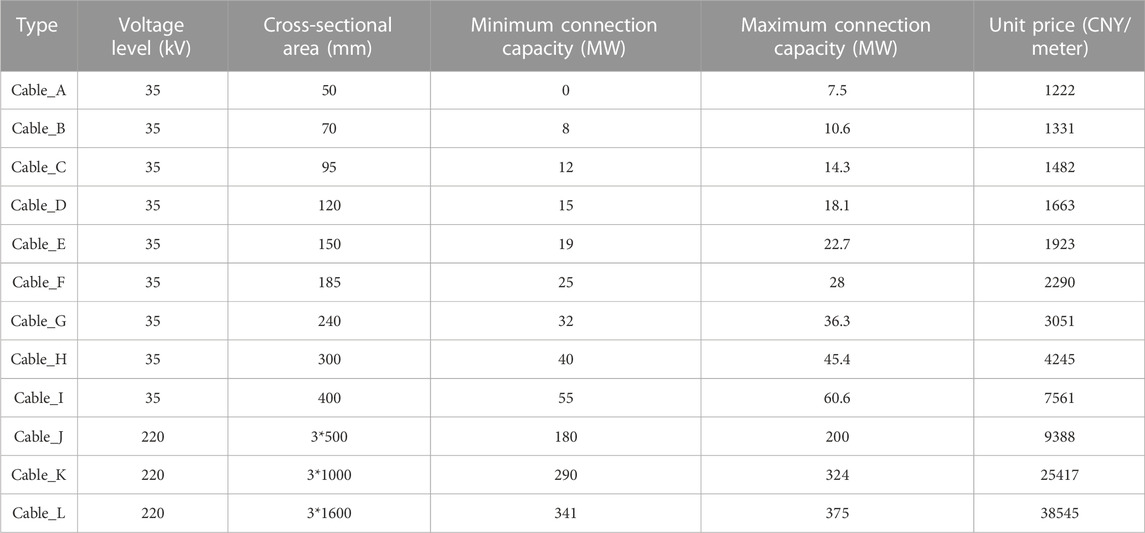
TABLE 2. Wind farm cable parameters.
By using the optimization method and parameter selection proposed in this paper, an integrated optimization of OWFCTS is carried out. Figure 8 shows the layout of the cables and the location of the substation in the wind farm cluster after optimization. The comparison of cable length and cable cost before and after optimization is shown in Table 3. After optimization, the total length of array cables in the wind farm cluster is reduced by 319.79 m, a decrease of 0.17%; the path length of AC export cables is reduced by 5640.66 m, a decrease of 13.82%; and the total cable cost after optimization is reduced by 3.58%. The significant reduction in AC export cables is the main reason for the decrease in the total cable cost. As shown in Figure 9, in the path optimization of the OWFCTS, the total cost of the cable decreases the fastest when the number of optimization steps is between 0 and 40 because the original location of the substation is not optimized, which leads to a large decrease in cable cost at the beginning of optimization. Between 40 and 180 steps, the gradient of cable cost decrease becomes smaller, and the optimization enters the bottleneck position. Between 180 and 200 steps, there is a small stepdown in cable cost, which is due to the use of random methods to jump out of the local optimum, and a relatively optimal substation location is found.
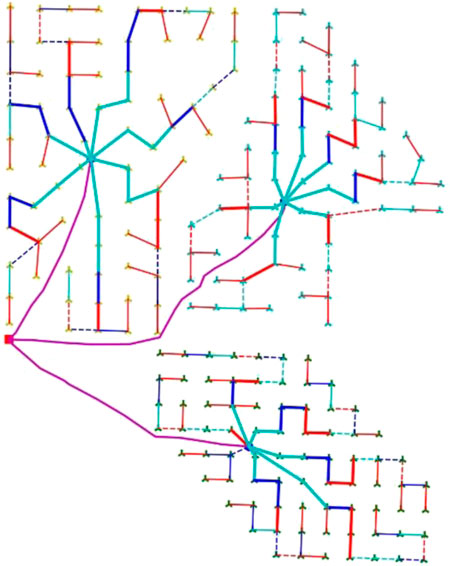
FIGURE 8. Array cable layout for the optimal substation.
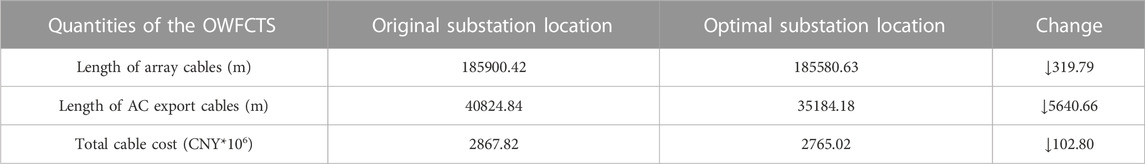
TABLE 3. Comparison of parameters before and after optimization of the OWFCTS.
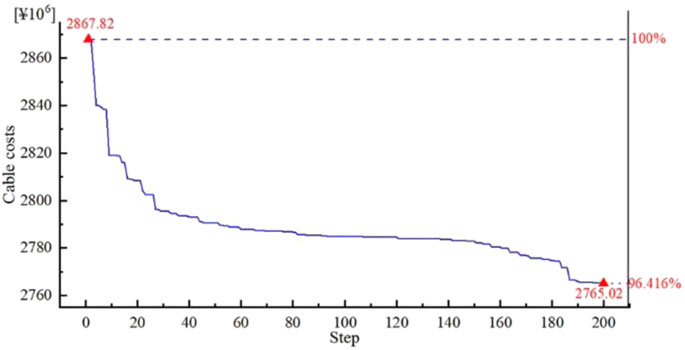
FIGURE 9. Variation curve of total cable investment with the number of optimization steps in the OWFCTS.
Wind farm A consists of 40 wind turbines with 5 MW and 32 wind turbines with 6.2 MW, with a total capacity of 398.4 MW. Cable J of the double feeders is chosen to transmit the electric energy of the substation to the converter station after cable selection calculation. The values of the related variables during the optimization process are shown in Table 4. At the original location of the wind farm, the path length of the AC export cables is 9727.49 m, the total length of the array cables is 68958.03 m, and the total cost of all cables is 940,476.9 thousand CNY. The optimization starts with an initial step length l0 of 200 m (the initial step length l0 is related to the size of the substation, generally taken as three times the longest side length of the substation). As shown in Supplementary Figure S1, during the 200 steps of optimization, there are 26 positions where the total cable cost is lower than the last position. After the optimization, the AC export cable path of the optimal substation location is as shown in Supplementary Figure S2, which is less affected by the turbine location, and the path is only reduced by 643.78 m after optimization. The array cables at the optimal location are shown in Supplementary Figure S3. Since the change in the substation location is small, the division of the array cable feeders is not affected. The only change is the cable between the substation and the turbine, and the path length is only reduced by 472.33 m. After optimization, the total cable cost of wind farm A decreased by 3,675.7 thousand CNY, a decrease of 0.13%.
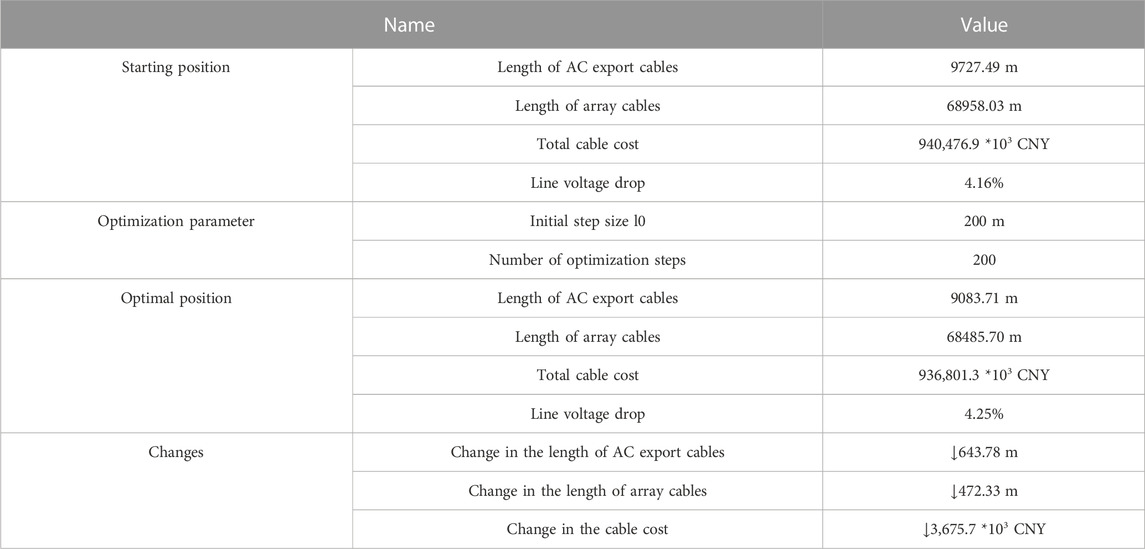
TABLE 4. Wind farm A optimization parameters.
Wind farm B consists of 66 wind turbines with 6 MW, with a total capacity of 396 MW. Cable J of the double feeders is chosen to transmit the electric energy of the substation to the converter station after cable selection calculation. The values of the related variables during the optimization process are shown in Table 5. At the original location of the wind farm, the path length of the AC export cables is 17067.37 m, the total length of the array cables is 58630.88 m, and the total cost of the cable is 1,017,775.5 thousand CNY. With an initial step length l0 of 200 m, 42 positions in the 200-step optimization process have a total cost of cable lower than the last position, and the optimal substation location is far from the initial position, as shown in Supplementary Figure S4. As shown in Supplementary Figure S5, the AC export cable path of wind farm B is complicated and needs to avoid the wind turbines and not pass through the area of wind farm A. Therefore, the complexity of the search process increases by adopting the Informed-RRT* method. The optimal substation location and the AC export cable paths change significantly after optimization, with length decreased by 2985.86 m, a decrease of 17.5%. The array cables at the optimal substation location are shown in Supplementary Figure S6, where the optimal location is two turbine units away from the initial position, and the feeder division of the array cables will change accordingly, with length reduced by 890.99 m after the optimization. Due to the significant decrease in the length of the AC export cable path and the array cables after the optimization, the total cost of the cable decreased by 62,305.1 thousand CNY, a decrease of 6.12% for wind farm B.
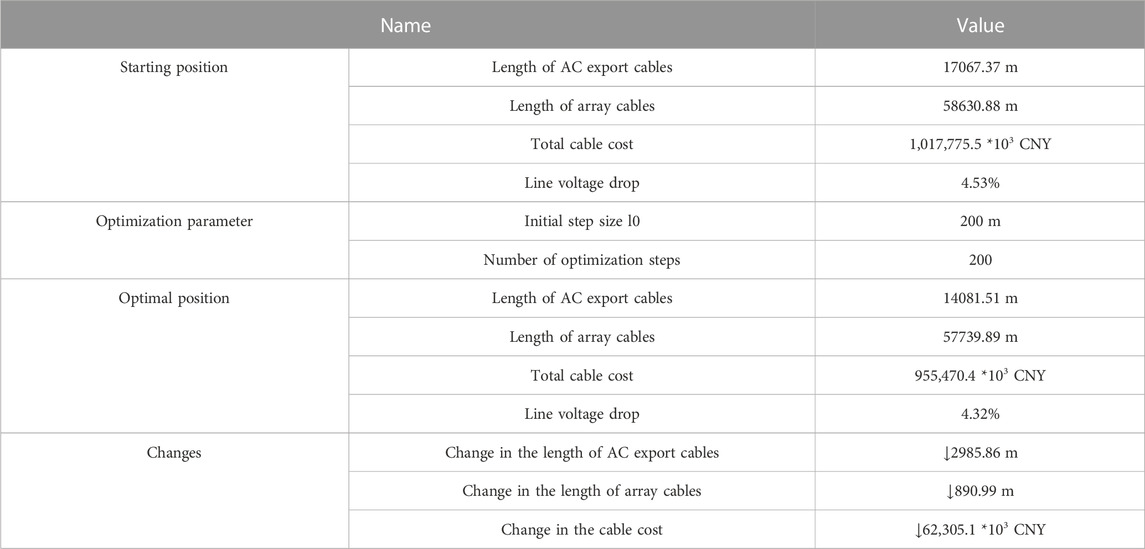
TABLE 5. Wind farm B optimization parameters.
Wind farm C consists of 78 wind turbines with 4 MW, with a total capacity of 312 MW. Cable K is chosen to transmit the electric energy of the substation to the converter station after the cable selection calculation. The values of the related variables during the optimization process are shown in Table 6. At the starting position, the length of the AC export cable and the array cables are 14029.98 m and 58311.51 m, respectively, and the total cost of the cable is 909,565.9 thousand CNY. Due to the smaller capacity of wind farm C, the size of the substation used is also smaller, with an initial step length l0 of 180 m for optimization. As shown in Supplementary Figure S7, in the 200-step optimization process, 35 positions have a total cost of cable lower than the last position, and the optimal location is far from the initial position. The path of the AC export cable at the optimal location is shown in Supplementary Figure S8, where the substation moves in the direction of the converter station during the optimization process, with the length reduced by 2011.01 m, a decrease of 14.3%. The array cables at the optimal location are shown in Supplementary Figure S9. The situation of wind farm C is special; after optimizing for the total cost of the cable, the length of the array cables at the optimal location increases by 1043.53 m compared with the initial position. However, considering the decrease in the total cost of the AC export cable, the total cost of the cable for the entire wind farm is reduced by 36,821.5 thousand CNY. This case also illustrates that the length of the AC export cable has a significant impact on the total cost of the cable.
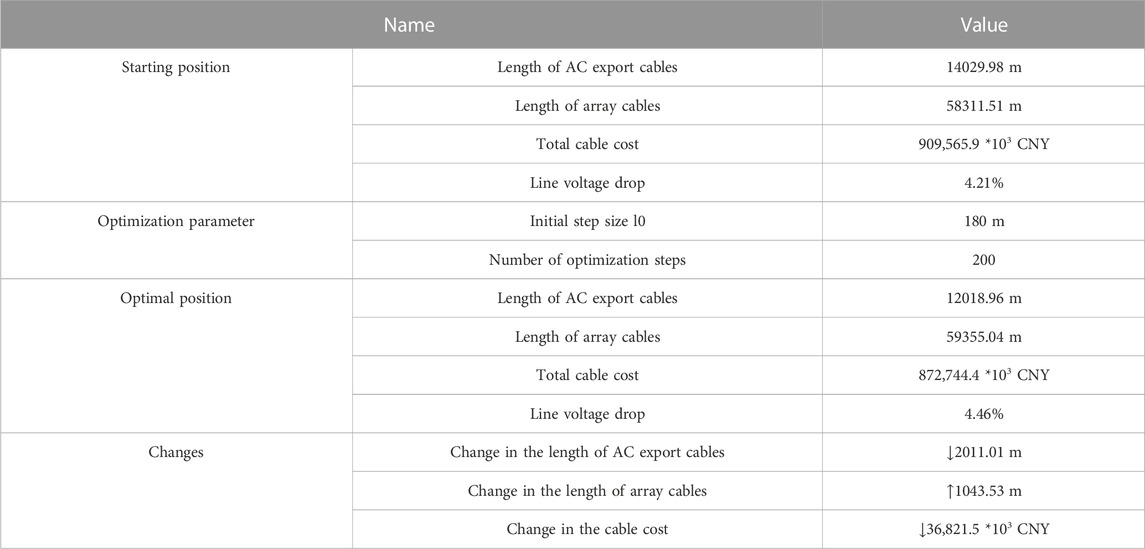
TABLE 6. Wind farm C optimization parameters.
This paper proposes an integrated optimization method to optimize the path of the OWFCTS, focusing on the optimization of the location of the substation and the optimization of the path of the AC export cables. The research results of this paper are as follows:
1) The gradient descent method is applied in the optimization of the location of the substation, which is always optimized in the direction of the gradient descent of the cable cost in the optimization, and at the same time, to avoid the local optimum, the stochastic method is used to jump out of the local optimum when a better value cannot be found. The case of the OWFCTS shows that the method can reduce the cable cost of a large-scale wind farm cluster by 3.58% relative to the starting position, which can effectively improve the economy of wind farm cluster construction.
2) Improving the Informed-RRT* method to optimize the AC export cable path in the OWFCTS, which can identify the wind turbine position and other sensitive areas and avoid them during the optimization process. The case proves that the method can effectively optimize the AC export cable path and find the optimal path, and the optimization of the AC export cable path reaches 13.82% compared with the optimized starting position.
The path integration optimization method of the OWFCTS proposed in this paper can provide technical support and a reference basis for the optimization of the transmission system of the same type of wind farm cluster.
The original contributions presented in the study are included in the article/Supplementary Material; further inquiries can be directed to the corresponding author.
CX: conceptualization and writing–review and editing. ZJ: methodology, validation, writing–original draft, and writing–review and editing. XH: funding acquisition, methodology, and writing–review and editing. YH: visualization and writing–original draft. JW: visualization and writing–original draft. HZ: visualization and writing–review and editing. WS: writing–review and editing.
The authors declare financial support was received for the research, authorship, and/or publication of this article. This work was supported by the National Natural Science Foundation of China (grant number 52106238), “the Fundamental Research Funds for the Central Universities” (grant number B230201051), and the Jiangsu Province Policy Guidance Program (International Science and Technology Cooperation/Hong Kong, Macao, and Taiwan Science and Technology Cooperation) (grant number BZ2021019).
The authors would also like to thank their tutors, CX and XH, for their valuable guidance throughout their studies. They provided the tools needed to choose the right direction and successfully complete the dissertation.
The authors declare that the research was conducted in the absence of any commercial or financial relationships that could be construed as a potential conflict of interest.
All claims expressed in this article are solely those of the authors and do not necessarily represent those of their affiliated organizations, or those of the publisher, the editors, and the reviewers. Any product that may be evaluated in this article, or claim that may be made by its manufacturer, is not guaranteed or endorsed by the publisher.
The Supplementary Material for this article can be found online at: https://www.frontiersin.org/articles/10.3389/fenrg.2023.1268291/full#supplementary-material
Cazzaro, D., Fischetti, M., and Fischetti, M. (2020). Heuristic algorithms for the wind farm cable routing problem. Appl. Energy 278, 115617. doi:10.1016/j.apenergy.2020.115617
El Mokhi, C., and Addaim, A. (2020). “Optimal substation location of a wind farm using different metaheuristic algorithms,” in Proceedings of the 2020 IEEE 6th International Conference on Optimization and Applications (ICOA), Beni Mellal, Morocco, April 2020 (IEEE), 1–6. doi:10.1109/ICOA49421.2020.9094469
Fischetti, M., and Pisinger, D. (2018). Optimizing wind farm cable routing considering power losses. Eur. J. Operational Res. 270 (3), 917–930. doi:10.1016/j.ejor.2017.07.061
Gammell, J. D., Srinivasa, S. S., and Barfoot, T. D. (2014). “Informed RRT: optimal sampling-based path planning focused via direct sampling of an admissible ellipsoidal heuristic,” in Proceedings of the 2014 IEEE/RSJ international conference on intelligent robots and systems, Chicago, IL, USA, September 2014 (IEEE), 2997–3004. doi:10.1109/IROS.2014.6942976
Hou, P., Hu, W., and Chen, Z. (2015). “Offshore substation locating in wind farms based on prim algorithm,” in Proceedings of the 2015 IEEE Power and Energy Society General Meeting, Denver, CO, USA, July 2015 (IEEE), 1–5. doi:10.1109/PESGM.2015.7286206
Liu, W., Li, Q., Wang, X., Zhang, F., Li, L., and Yan, H. (2020). Application status and prospect of VSC-HVDC technology for large-scale offshore wind farms. Electr. Power 53 (7), 55–70.
Lundberg, S. (2003). Performance comparison of wind park configurations. Göteborg, Sweden: Department of Electric Power Engineering, Power Electronics and Wind Energy.
Moon, W. S., Kim, J. C., Jo, A., and Won, J. N. (2014). “Grid optimization for offshore wind farm layout and substation location,” in Proceedings of the 2014 IEEE Conference and Expo Transportation Electrification Asia-Pacific (ITEC Asia-Pacific), Beijing, September 2014 (IEEE), 1–6. doi:10.1109/ITEC-AP.2014.6941124
Shin, J. S., and Kim, J. O. (2016). Optimal design for offshore wind farm considering inner grid layout and offshore substation location. IEEE Trans. Power Syst. 32 (3), 2041–2048. doi:10.1109/TPWRS.2016.2593501
Ulku, I., and Alabas-Uslu, C. (2020). Optimization of cable layout designs for large offshore wind farms. Int. J. Energy Res. 44 (8), 6297–6312. doi:10.1002/er.5336
Wang, R., Ma, D., Li, M. J., Sun, Q., Zhang, H., and Wang, P. (2022). Accurate current sharing and voltage regulation in hybrid wind/solar systems: an adaptive dynamic programming approach. IEEE Trans. Consumer Electron. 68 (3), 261–272. doi:10.1109/TCE.2022.3181105
Wang, R., Sun, Q., Ma, D., and Hu, X. (2020). Line impedance cooperative stability region identification method for grid-tied inverters under weak grids. IEEE Trans. Smart Grid 11 (4), 2856–2866. doi:10.1109/TSG.2020.2970174
World Bank Group (2020). Technical-Potential-for-Offshore-Wind-in-China-Map. Avaiable at: https://www.esmap.org/esmap_offshorewind_techpotential_analysis_maps (Accessed July 25, 2023).
Yang, B., Liu, B., Zhou, H., Wang, J., Yao, W., Wu, S., et al. (2022). A critical survey of technologies of large offshore wind farm integration: summary, advances, and perspectives. Prot. Control Mod. Power Syst. 7 (1), 17. doi:10.1186/s41601-022-00239-w
Yang, Y., Tang, X., and Xin, Y. (2020). Research on optimal site selection for offshore wind farms substation. Electr. Power 53 (7), 24–28+71.
Keywords: deepwater, wind farm cluster, transmission system, the gradient descent algorithm, Informed-RRT* method
Citation: Xu C, Jiao Z, Han X, Huang Y, Wang J, Zhang H and Shen WZ (2023) Comprehensive layout optimization of the transmission system in a deepwater wind farm cluster. Front. Energy Res. 11:1268291. doi: 10.3389/fenrg.2023.1268291
Received: 27 July 2023; Accepted: 17 October 2023;
Published: 09 November 2023.
Edited by:
Rui Wang, Northeastern University, ChinaReviewed by:
Adriano Chaves Lisboa, Solutions on demand, BrazilCopyright © 2023 Xu, Jiao, Han, Huang, Wang, Zhang and Shen. This is an open-access article distributed under the terms of the Creative Commons Attribution License (CC BY). The use, distribution or reproduction in other forums is permitted, provided the original author(s) and the copyright owner(s) are credited and that the original publication in this journal is cited, in accordance with accepted academic practice. No use, distribution or reproduction is permitted which does not comply with these terms.
*Correspondence: Xingxing Han, aGFueHhAaGh1LmVkdS5jbg==
Disclaimer: All claims expressed in this article are solely those of the authors and do not necessarily represent those of their affiliated organizations, or those of the publisher, the editors and the reviewers. Any product that may be evaluated in this article or claim that may be made by its manufacturer is not guaranteed or endorsed by the publisher.
Research integrity at Frontiers
Learn more about the work of our research integrity team to safeguard the quality of each article we publish.