
95% of researchers rate our articles as excellent or good
Learn more about the work of our research integrity team to safeguard the quality of each article we publish.
Find out more
ORIGINAL RESEARCH article
Front. Energy Res. , 16 November 2023
Sec. Solar Energy
Volume 11 - 2023 | https://doi.org/10.3389/fenrg.2023.1267947
 Muhammad Rameez Javed1
 Muhammad Imtiaz Hussain2
 Mudassar Usman1Furqan Asghar3†Muhammad Shahid1
 Waseem Amjad3Gwi Hyun Lee4*
 Aashir Waleed1*†
The recent trend of renewable energy has positioned solar cells as an excellent choice for energy production in today’s world. However, the performance of silicon photovoltaic (PV) panels can be influenced by various environmental factors such as humidity, light, rusting, temperature fluctuations and rain, etc. This study aims to investigate the potential impact of high voltage power transmission lines (HVTL) on the performance of solar cells at different distances from two high voltage levels (220 and 500 KV). In fact, HVTLs generate electromagnetic (EM) waves which may affect the power production and photocurrent density of solar cells. To analyze this impact, a real-time experimental setup of PV panel is developed (using both monocrystalline and polycrystalline solar cells), located in the vicinity of 220 and 500 KV HVTLs. In order to conduct this study systematically, the impact of HVTL on solar panel is being measured by varying the distance between the HVTL and the solar panels. However, it is important to understand that the obtained experimental values alone are insufficient for comprehensive verification under various conditions. To address this limitation, an Artificial Neural Network (ANN) is employed to generate HVTL impact curves for PV panels (particularly of voltage and current values) which are impractical to obtain experimentally. The inclusion of ANN approach enhances the understanding of the HVTL impact on solar cell performance across a wide range of conditions. Overall, this work presents the impact study of HVTL on two different types of solar cells at different distances from HVTL for two HV levels (i.e., 220 and 500 KV) and the comparison study of HVTL impact on both monocrystalline and polycrystalline solar cells.
The recent geo-economic conditions have argued the world to replace conventional energy resources with clean and green energy sources such as wind, solar, ocean power, bio energy and many others. Among these options, solar energy production is particularly attractive and popular due to its availability, simplicity, low maintenance cost, and long lifespan (Waleed et al., 2019; Hu, 2023; Osman et al., 2023; Usman et al., 2023). At the country level, people are encouraged to construct and implement grid-connected and standalone photovoltaic (PV) systems to meet their energy needs in order to reduce the dependency on conventional energy resources.
In addition to that, the recent technological advancements in solar energy have revolutionized the era of renewable energy and researchers are employing various materials in PV panels to further enhance the performance of the solar panels (Waleed and Fan, 2017; Pescetelli et al., 2022; Vimala et al., 2023). Moreover, the evolutions in PV systems control such as maximum power point tracking (MPPT), thermal management of panels and inclusion of AI technologies are further enhancing the performance of solar energy (Javed et al., 2019; 2020; Bollipo et al., 2021; Abdallah et al., 2022). Overall, this may be deduced from the above stated that all these developments have encouraged the adoption and utilization of solar energy among the public.
Apart from the benefits, the PV performance can be impacted by environmental and surrounding factors (Maghami et al., 2016; Elshazly et al., 2021; Kaewpraek et al., 2021; Dawood et al., 2023). For instance, in (Daher et al., 2018; Dhimish, 2020), researchers investigated the effect of seasonal temperature variations on PV modules. The study concluded that solar irregularities caused by climate change can affect the efficiency of PV modules and temperature changes due to solar irradiation have a great impact on degradation of solar cell (Magare et al., 2022). Later, some authors (Das, 2019; Giyantara et al., 2021; Ekinci et al., 2022; Vengatesh Ramamurthi and Rajan Samuel Nadar, 2022) have focused primarily on environmental aspects, such as the effect of partial shading, rusting, angle of incidence for PV modules and dust on panels, yielding various conclusions/theories.
Furthermore, the performance of solar cells may also be impacted by magnetic fields surrounding the solar panels. For instance, in (Zerbo et al., 2012; 2017), researchers examined the impact of the magnetic field on PV cells and found through experimentation that the electromagnetic (EM) waves transmitted or received by Amplitude Modulated and Frequency Modulated radio antennas have a negligible effect on the behavior of the PV panel. However, the electric field generated by these communication systems does have a strong influence on the electronic parameters of the solar cell. The investigation in (Fathabadi, 2018a) explored the influence of magnetic field and doping (density, materials) on the J-V characteristics of solar cell while considering shunt and series connected resistances. The results of the study indicated that an increase in magnetic field strength resulted in higher shunt, series, and short-circuited current values across all levels of doping. Few more studies have also described the possible impact of magnetic fields on the performance degradation of PV panels (Combari et al., 2017; Sourabié et al., 2017; Ndeto et al., 2020; Panmuang and Photong, 2021; Wu et al., 2023). Previous studies investigated the effect of constant magnetic field to measure the minority charge carrier mobilization in hetero-junction bipolar transistor. The relationship between magnetic field intensity, mobilization of electrons and change in current caused by magnetic field is established based on magneto-transport theory. The results suggested that there is a relation in magnetic field and base current. In the work (Zoungrana et al., 2012), researchers proposed a method to measure all recombinational parameters of bi-facial solar cell-based PV module under constant magnetic field applied parallel to PN junction surface. The monochromatic light is used for illumination of Bi-facial cell and continuity equation is used to express the photonic current and other associated recombinational parameters. The researchers obtained all recombinational parameters by investigating the effect of magnetic field on short circuited photonic current. The authors in (Sourabié et al., 2017) presented a theoretical representation stating that the inclination angle (ɵ) of the magnetic field affects the output of polycrystalline SI PV cells. Their research concluded that the PV cell output increases as the inclination angle (ɵ) increases from 0 to 900. The result expressed that increase in MF increase the induced photonic current in organic material and decrease the photonic current in solar cells.
This is worth mentioning that previously reported works are more concerned about the impact study of environmental factors and magnetic fields on the performance of solar cells; however, the very least attention has been given to HVTL impact on solar panels. A few works in literature have tried to observe the HVTL effect on the solar cells (Fathabadi, 2018b; Raza et al., 2019) and presented the performance degradation of panels with HVTL. For instance, the study by (Fathabadi, 2018b) concludes that the high voltage power transmission lines generate Electromagnetic Waves (EM), which consist of an electric field resulting from the voltage of the transmission lines. This electric field does not affect the power production of PV panels located near the transmission lines. However, the EM waves also have a magnetic field caused by the current in the transmission lines, and this magnetic field significantly impacts the power production of PV panels situated near high-voltage (HV) transmission lines.
This work is aimed at finding the impact of high voltage power transmission lines on the solar cells (monocrystalline and polycrystalline type) performance by varying the distance between HVTL and solar panels. The collected experimental data provides insights into the effects of HVTLs on both types of solar cell, enabling a comparison between monocrystalline and polycrystalline technologies. This study further examines the influence of the electric field and magnetic field by HVTL on energy production of different PV panels under two different high voltage levels (500 and 220 KV) of transmission lines, utilizing real-time experimental values. Nonetheless, relying solely on these experimental values for comprehensive verification across diverse conditions is inadequate. To handle this challenge, this work employs an Artificial Neural Network (ANN) to acquire complete time-dependent profiles of photovoltaic (PV) panels, especially for voltage and current values that are impractical to obtain experimentally.
To convert light energy into electrical energy, the devices used are called solar or PV cells. Figure 1A shows the basic construction of PV cell with connected load, whereas Figure 1B represents the ideal PV equivalent model. It is important to understand the basics of PV cells in order to explain this work theoretically. The conversion of light energy from the Sun into electrical energy is achieved through photovoltaic generation, which relies on the photovoltaic effect. Commercially two categories of PV cells are available in the market: thin film devices and silicon crystalline material-based devices. The crystalline based PV cell category is further divided into two types: mono and multi crystalline material. Both above-mentioned technologies are considered more reliable and efficient to use for commercial purposes. Although the manufacturing cost of single crystalline material is high as compared to multi-crystalline material, but the researchers and market trends show that the efficiency of single crystal-based material is high as compared to multi-crystal-based system (Saive, 2021).
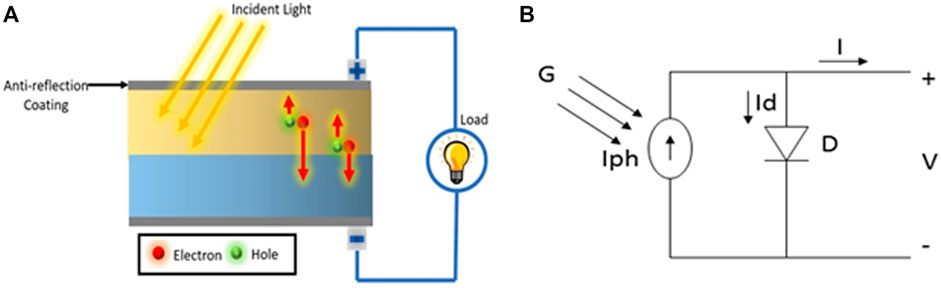
FIGURE 1. (A) The basic configuration of a typical Photovoltaic cell. (B) The figure presents an Ideal PV model.
The mathematical equation for ideal diode model is written as:
In this equation.
•
• q is charge of electron equal to 1.602*
• K is constant equal to 1.380 x
• T: Temperature (Kalvin)
• a is constant varies from one to two
•
So, the Shockley equation or diode current equation with thermal voltage term can be written as
The practical model of a PV cell is explained in Figure 2A and the mathematical equation of current flow toward the load (by considering the photonic current and series, shunt resistance) is provided below in Equation 3. Whereas Figure 2B shows the generic equivalent circuit of Photovoltaic cell with N number of cells connected in series (Solar cell array design handbook, 1982).
• Irradiance level
• Spectrum of light
• Cell characteristics/Quality of material
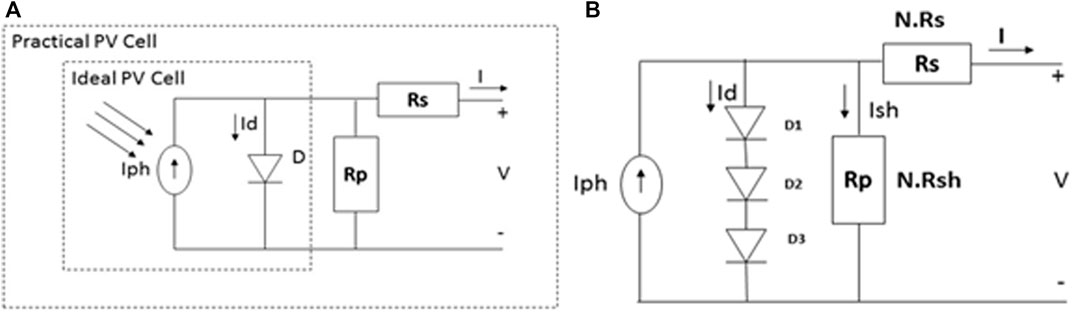
FIGURE 2. (A) The figure presents the practical PV cell model. (B) Figure presents the generic equivalent circuit of Photovoltaic cell with N number of cells connected in series (PV Array).
The short-circuited current of the PV cell is a direct measurement of the photon current, and the change of temperature has no significant impact on the value of
Taking
The open circuit voltages exhibit a strong dependence on temperature, as indicated by Eq. 6, and the relationship between the open circuit voltages and temperature is inversely proportional (Al-naser et al., 2013).
Figure 3 presents the schematic diagram of the experimental setup as established in this work to understand the impact of EM waves from HVTL on the PV cells. The image also presents the real time image of the experimental setup, which is composed of an adjustable height assembly of solar panel placed in the vicinity of HVTL. In this study, the two different types of PV panels (monocrystalline and polycrystalline) are being used because mostly commercial PV installations contain these two types only. However, monocrystalline solar plates are considered more efficient because they are a single source of silicon crystal. To create the unique cell shape, square silicon wafers are used to produce mono panels, with their corners trimmed off. The rating of monocrystalline solar panel used in this experiment is given below in Table 1.
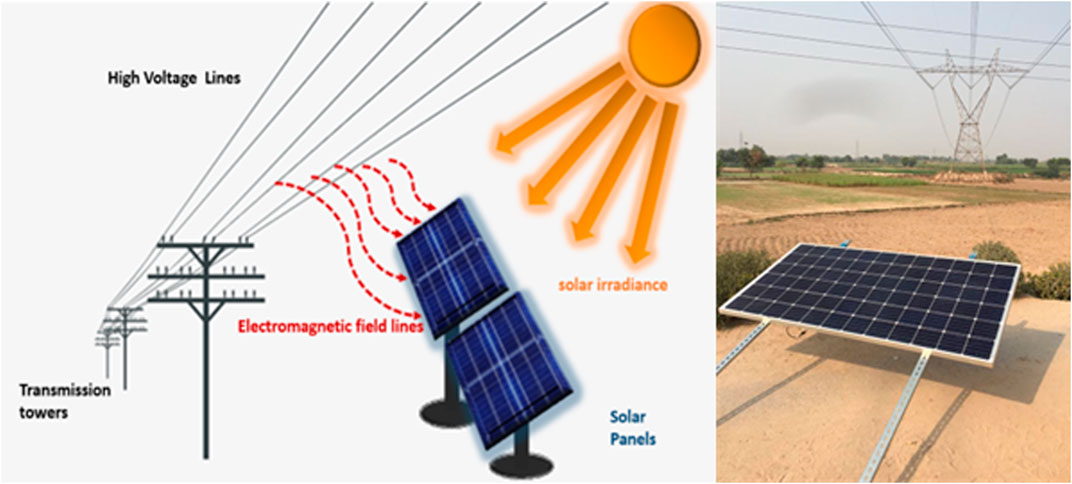
FIGURE 3. The schematic and real-time diagram depicting the experimental setup as developed in this work to perform the HV impact study.
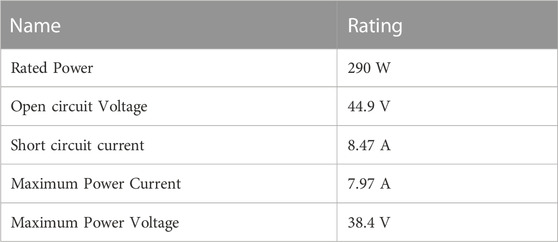
TABLE 1. Properties of monocrystalline PV panel.
In addition to that, the properties of polycrystalline panel used in the experiment are provided below in Table 2. Moreover, both different types of PV panels have been studied under the impact of two various HVTL levels, i.e., 220 and 500 KV.

TABLE 2. Properties of polycrystalline PV panel.
To investigate the effect of electromagnetic field (developed by HVTL), Mono crystalline and poly crystalline panels are fixed together by adjustable supporting structure (to vary the distance between panels and HVTL). Initially the experimentation is performed for 500 KV and later for 220 KV. Under 500 KV, the values of electromagnetic fields are observed by electromagnetic radiation meter and field strength is altered by moving the panels upwards/downwards (the distance is varied between 0 and 130 ft). Electromagnetic radiation meters are accurate devices which are globally used for the precise measurement of electromagnetic (EM) waves, electric and magnetic fields associated with these EM waves. Moreover, this may measure electromagnetic fields which are being emitted from high voltage transmission lines, electrical wiring, and equipment, etc. It is worth mentioning that, at the center of transmission line, the value of electromagnetic field is maximum and is less on the sides of HVTL. Therefore, in this work, the maximum value of electromagnetic field available at center of HVTL has been chosen for further studies. It is further observed that the magnetic field (MF) strength starts reducing if we move the panel away from the HVTL and increases on moving closer to HVTL.
In this experiment, five DC loads of 100 W are connected in series with the PV panels and values of current, voltage and power are being recorded simultaneously. An ammeter is connected in series and a voltmeter in parallel across the loads to measure the current and voltage values and to calculate the power. The measurements are being taken simultaneously along with variations in the experimental setup (distance change of both types of solar panels from the HVTL).
Later, the same experimental setup is being tested under the 220 KV HVTL and the same experiment is replicated by varying the distance from the transmission line in increments of 20 feet. However, it is observed during the experiment, the practical measurements obtained from photovoltaic (PV) panel (by varying distances from the main transmission lines) have certain limitations. For instance, due to the dependency on sunlight irradiance, it is challenging to capture values at 0 V or discrete voltage levels in this experimental setup. Therefore, this significant challenge is being handled by utilizing an Artificial Neural Network (ANN), which allows for the generation of a complete Power vs. voltage curve for the PV panels. An ANN function is like the human brain and consists of three layers: the input layer, hidden layer, and output layer. The input layer serves as a receptor for commands or a database, while the hidden layer evaluates the data. The output layer acts as a neuron transmitter. The processing in the hidden layer occurs through iterations known as epochs, and there can be any number of hidden layers. The ANN can operate using feedforward and feed backward methods, but in this case, the feedforward method is employed. In this work, the ANN takes the experimental data as input and generates the impact plots for the conditions which are not possible to attain through experimental setup.
This section presents experimental results taken at field level of 220 KV and 500 KV transmission lines with two different types of PV panels. In this proposed configuration, both monocrystalline and polycrystalline photovoltaic (PV) panels have been employed to understand the HVTL impact on both types. The panels are positioned beneath 220 KV and 500 KV transmission lines, at varying distances ranging from 0 m to 130 feet, with intervals of 20–30 feet. The voltage and power readings are recorded at each interval, ensuring consistent weather conditions. The corresponding power and voltage values for different distances are presented in the tables (Tables 3–6) and figures (Figures 4, 5) as provided below. Tables 3,4 present the variations of voltage, current and power as obtained from the PV panels of monocrystalline and polycrystalline respectively, placed under 220 KV HVTL. The tables also provide the values of magnetic and electric fields, calculated by the electromagnetic detector at different distances between HVTL and PV panels. It is evident from the data that electromagnetic fields strength increases on moving closer to HVTL and decreases on moving away from the HVTL. The measured results enlisted in Tables 3,4 have been depicted graphically in Figure 4. This can be easily observed from Figure 4 that PV output power of both types of panels drop on moving the panels closer to the HVTL and increases on moving away from the HVTL under standard test conditions (STC). However, the drop of power is more noticeable in polycrystalline PV panels as compared to monocrystalline due to their least efficiency as compared to monocrystalline panels. In fact, the impact of HVTL on solar panels leads to a decrease in power production and this can be explained in two ways. Firstly, it reduces the photocurrent density, resulting in a decrease in the power output of PV panels. Secondly, it diminishes the incident light energy absorbed by PV cells, particularly the partially circularly polarized light (PCPL).
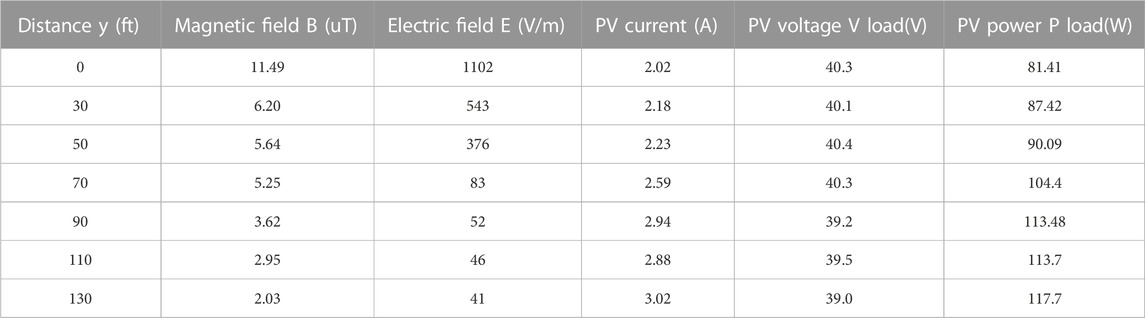
TABLE 3. Monocrystalline PV parameters at different distances under 220 KV HVTL.
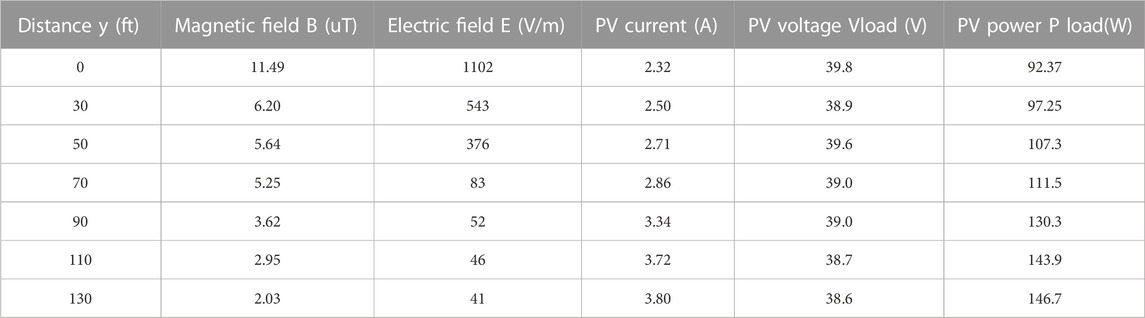
TABLE 4. Polycrystalline PV parameters at different distances under 220 KV HVTL.
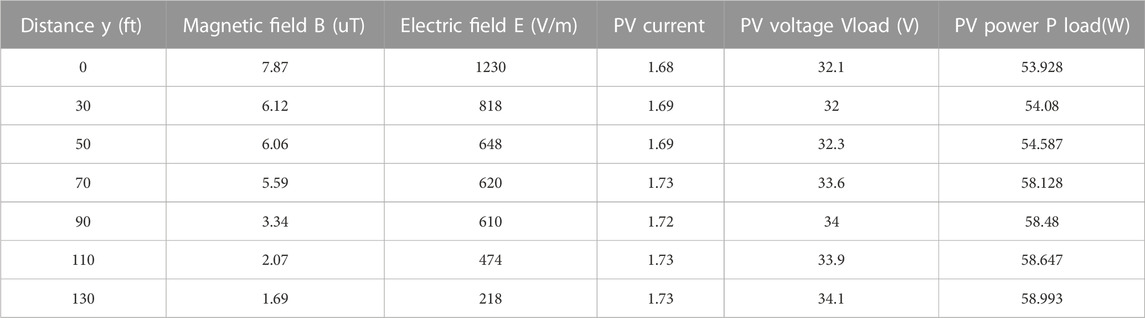
TABLE 5. Monocrystalline PV parameters at different distances under 500 KV HVTL.
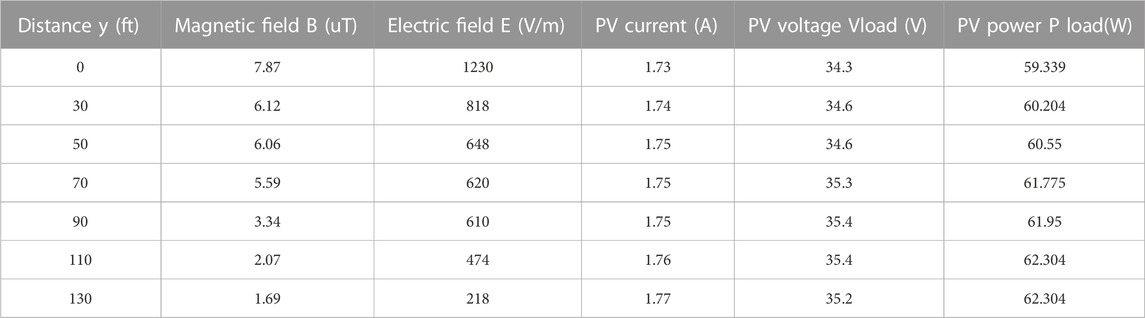
TABLE 6. Polycrystalline PV parameters at different distances under 500 KV HVTL.
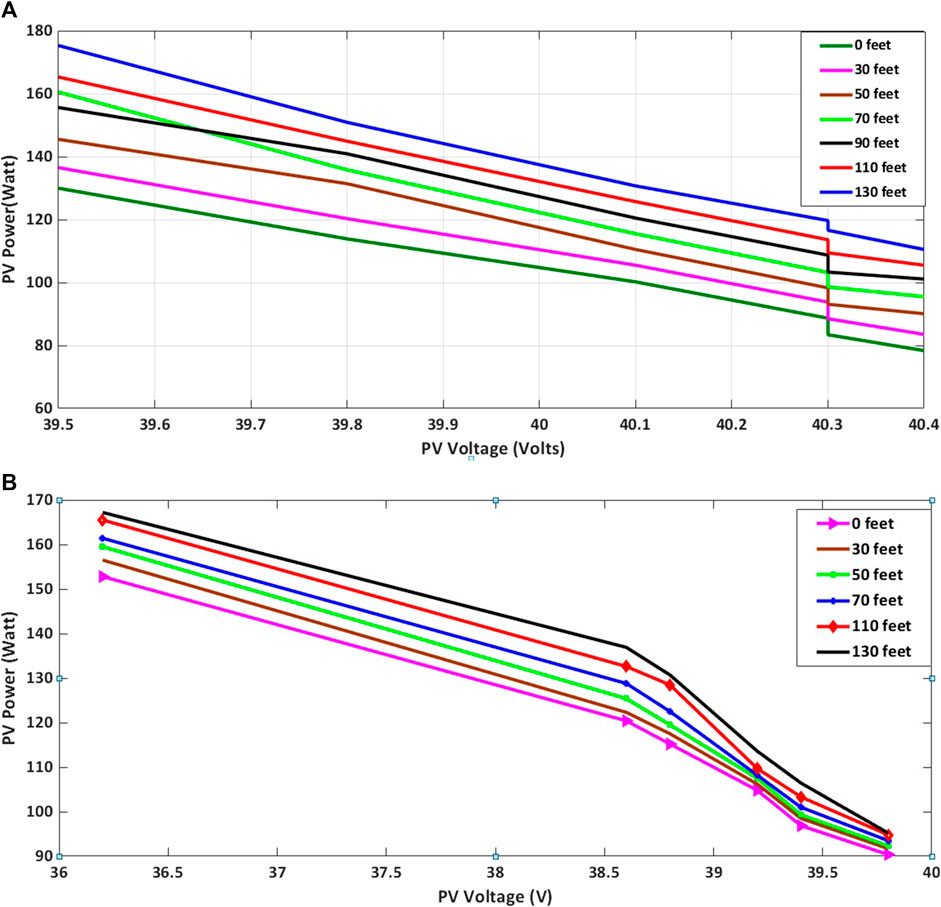
FIGURE 4. The image provides (A) the experimental PV Power as calculated for monocrystalline PV panel placed under 220 KV HVTL for different distance levels. (B) The experimental PV Power as calculated for polycrystalline PV panel placed under 220 KV HVTL for different distance levels.
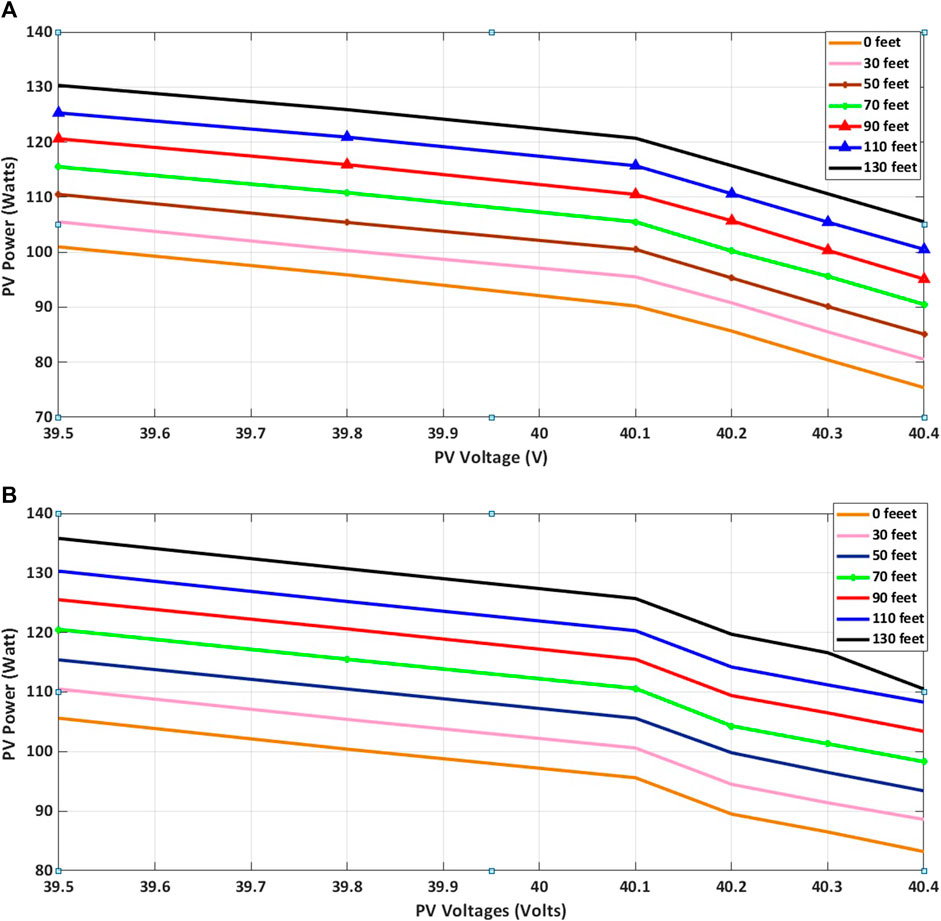
FIGURE 5. The image provides (A) the experimental PV Power as calculated for monocrystalline PV panel placed under 500 KV HVTL for different distance levels. (B) The experimental PV Power as calculated for polycrystalline PV panel placed under 500 KV HVTL for different distance levels.
After that, the PV parametric studies have been repeated for both types of PV panels under 500 KV HTL. The corresponding results have been tabulated in Tables 5, 6. The increase in HVTL level increases the electromagnetic field strength and thus decreases the power more drastically as compared to 220 KV transmission line. The corresponding results have been plotted and displayed in Figure 5 for different distance levels. Moreover, the decay of output power is more rapid in polycrystalline as compared to monocrystalline on moving the panels closer to transmission lines. Moreover, it was observed that in the electromagnetic field developed by HVTL, the magnetic field shows noticeable impact on the generated power from PV panels and the generated power reduces on making PV panel closer to the HVTL due to increase in magnetic field strength. Whereas the electric field generated by HVTL shows no noticeable impact on the performance of PV (Fathabadi, 2018b).
However, it is worth mentioning that the obtained experimental data has certain limitations (for instance, PV power values can be obtained only against a limited voltage range) and cannot provide the complete analysis picture for the extended conditions. Thus, there is dire need to use the obtained experimental data to get broader look of HVTL impact on PV panels via artificial intelligent techniques such as: artificial neural network (ANN). It is also worth noting that to handle the mentioned issue, artificial intelligence technique “artificial neural network using feed forward fitting” is being used in this work. The feedforward architecture of neural network consists of three layers; including input layers, hidden layers, and output layer. The number of inputs and outputs can be arranged according to problem statement. In hidden layers, each neuron has weighted inputs and bias from previous layers, as given in Equation 7. Where
The main Simulink model for ANN is provided in Figure 6. It contains four inputs and one output; whereas the hidden layer of ANN has 80 neurons, which have been used to train the data. The experimental data (enlisted in Tables 3–6) received in experimentation is being used as input to train the model in ANN.
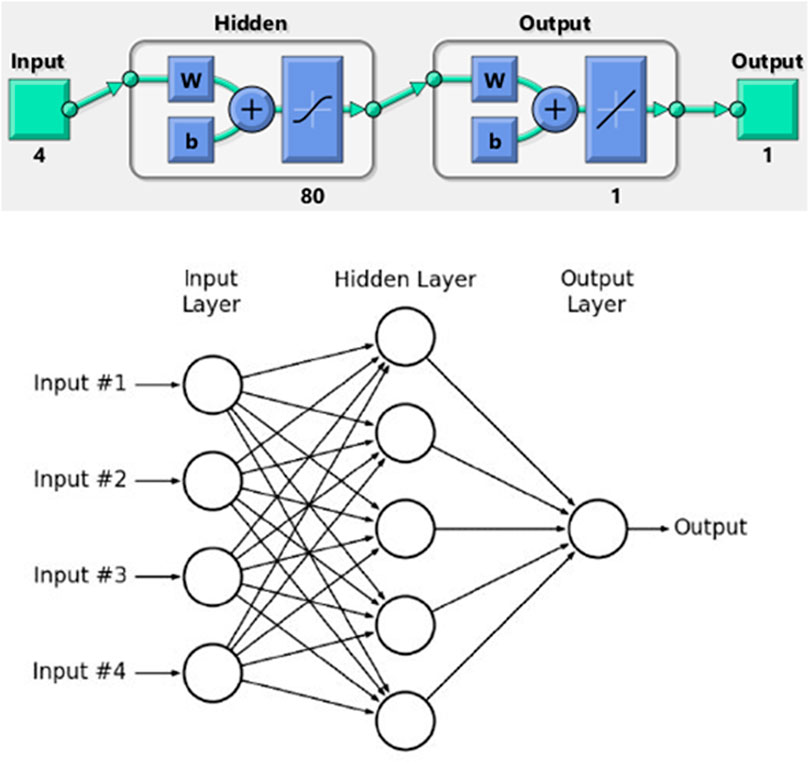
FIGURE 6. The Simulink model of ANN explaining layers in neural network.
The testing, target and training of data is provided in Figure 7A, where the dot circles represent data and solid line represents fit line. If the data remains on the line, it represents higher accuracy and if the data is below line, it shows errors in the training. Furthermore, the performance function of ANN is Mean Square Error (MSE). In order to train this network, more than a thousand samples are taken and the corresponding error histogram for this case is provided in Figure 7B. The zero error is equal to zero and other data near to zero represents very few errors in the system.
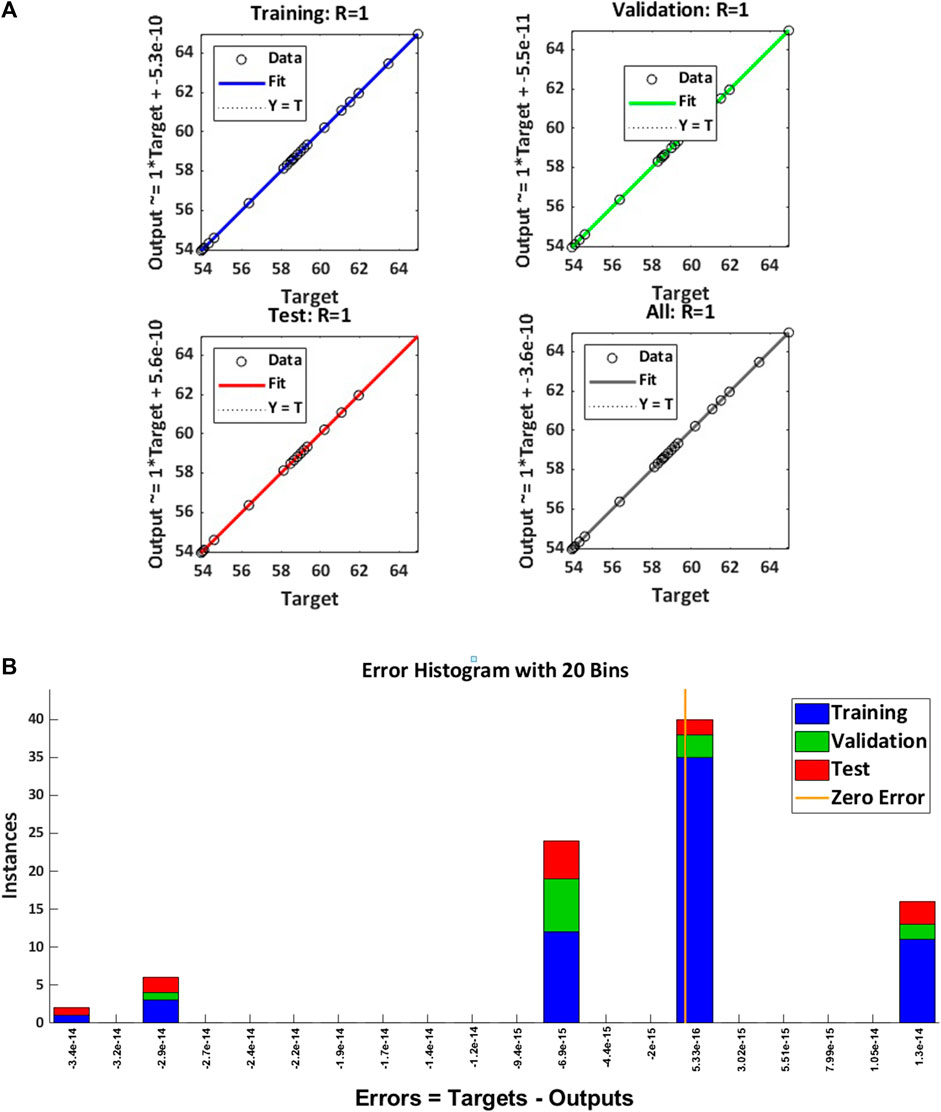
FIGURE 7. (A) Artificial Neural Network: Training, testing and target value of data. (B) The error Histogram with 20 Bins.
The experimental results outlined in Figures 4, 5 have been utilized with an Artificial Neural Network to extract the complete waveform of a PV panel to analyze the impact of HVTL at extended range. Due to the limited data range for ANN in this case, a deep learning approach with multiple layers has been employed to achieve accuracy. The error histogram and training data results demonstrate that the data has been effectively trained, resulting in accurate outcomes compared to alternative methods. Figure 8A illustrates the complete waveform of a monocrystalline PV panel at different distance levels (0–130 feet) under the impact of 220 KV lines using ANN. The experimental findings in Figures 4, 5 indicated a limited output range, while the full range (0–45 V) has been obtained using an artificial neural network (ANN). The graphs in figure demonstrate the accurate tracking of the entire curve, with higher output power observed at greater distances from HV lines and lower output power values closer to HV lines. Figure 8B represents the complete PV panel waveform for polycrystalline solar cell under the impact of 220 KV HVTL using ANN technology. The decay trend of PV output power in case of polycrystalline is like monocrystalline, i.e., decrease in power on moving the panel closer to HVTL. However, the curves at different distances show that the effect of HV lines is higher for polycrystalline panels as compared to monocrystalline panels.
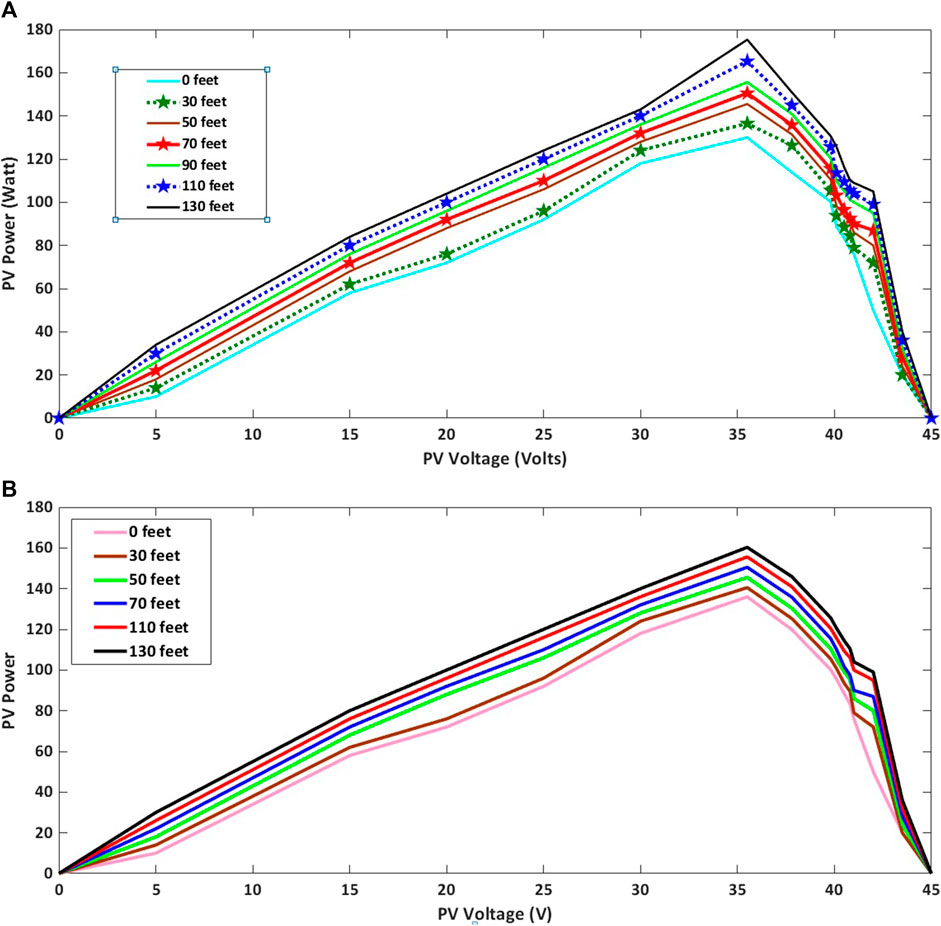
FIGURE 8. (A) The relation curve of PV voltage and power at different distances from 220 KV lines for monocrystalline by applying ANN. (B) The relation curve of PV voltage and power at different distances from 220 KV lines for polycrystalline by applying ANN.
Figure 9A depicts the effect of 500 KV lines on monocrystalline panel through Power-Voltage curve of panel using ANN at different distances. The curves show that the effect of 500 KV lines is higher on monocrystalline panel as compared to 220 KV lines due to increase in electromagnetic field strength. Figure 9B expresses the impact of 500 KV lines on the extended range of polycrystalline panels using an Artificial Neural Network (ANN). The ANN, based on deep learning, precisely models the entire voltage spectrum and calculates the impact of HVTL at different distance levels. The obtained results as visualized through curves, indicate that as the distance increases between PV panel and HVTL, the output power increases. On the other hand, when the solar panel moves closer to the HV lines, the output power decreases. The results trend obtained through ANN method is like the results as received through experimental setup. The experimental findings further indicate that the HVTL impact on the open circuited voltage and power of solar panels is greater at the 500 KV level as compared to the 220 KV level. This is attributed to the presence of a stronger magnetic field intensity surrounding the solar module. Additionally, the choice of material also plays a role and monocrystalline materials are less impacted by HVTL as compared to polycrystalline materials under both 220 KV and 500 KV voltage levels.
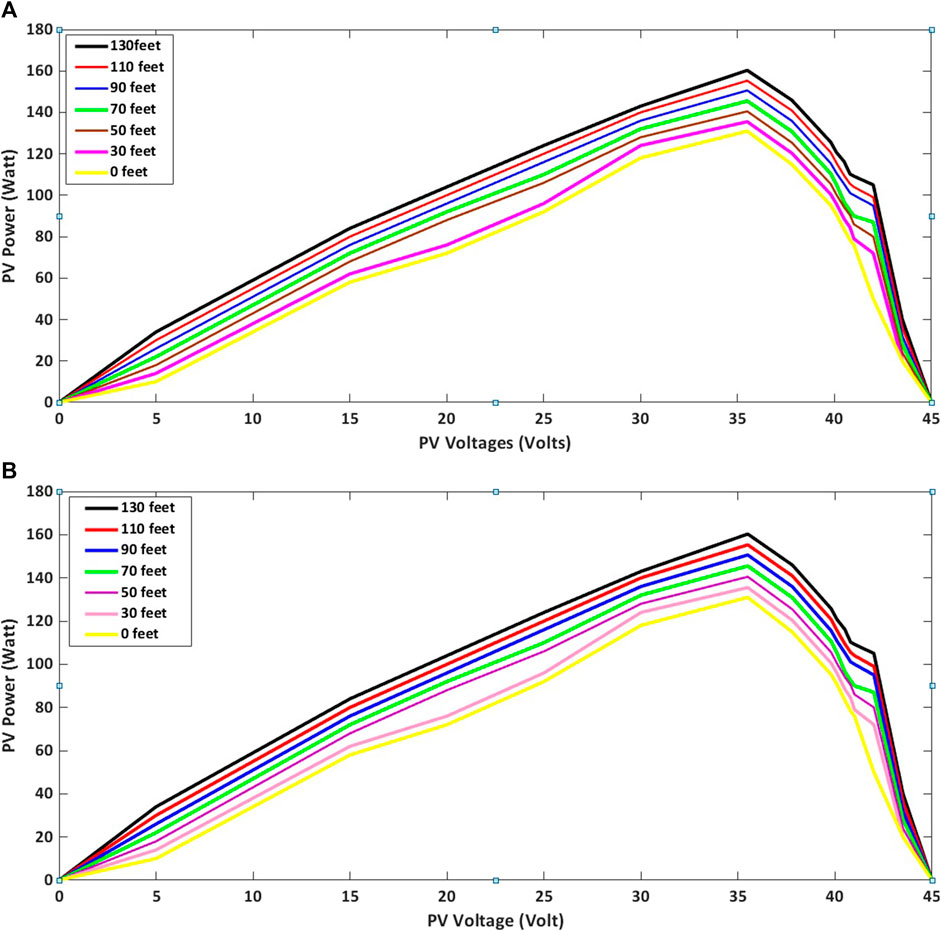
FIGURE 9. (A) PV voltage and Power at different distances from 500 KV lines for monocrystalline material by applying ANN (B) PV voltage and Power at different distances from 500 KV lines for polycrystalline material by applying ANN.
This comprehensive study contributes to our understanding of how HVTLs can influence the performance of solar cells, providing valuable information for the development and implementation of solar energy systems in the presence of high voltage power transmission lines. The solar energy has become a popular candidate in the recent world due to its outstanding advantages. However, it has been observed that solar production performance may get impacted with various environmental factors and thus there is utmost need to explore the possible effect of these factors. This research work focuses on investigating the impact of high voltage power transmission lines (HVTL) on solar cells, specifically at two voltage levels: 220 and 500 KV. Additionally, it also presents a comparative analysis of the HVTL impact on both monocrystalline and polycrystalline solar cells at different distance levels between HVTL and solar panels. The study aims to understand how the presence of HVTLs affects the performance of solar cells, considering factors such as power production and photocurrent density. To achieve this, an experimental setup is established, incorporating both monocrystalline and polycrystalline solar cells and is placed in the proximity of 220 and 500 KV HVTLs. The obtained results show that the electromagnetic fields generated by HVTL reduce the output power of solar panels and deteriorates their performance. It is further noticed that the impact of HVTL on solar panels gets stronger on moving the panels closer to the HVTL due to increase in electromagnetic strength of HVTL. Moreover, the 500 KV HVTL impacts more the solar panels as compared to 220 KV HVTL due to stronger EM waves generated by 500 KV. This study is also evaluated by varying the material of panels and concludes that the monocrystalline panels are less affected by HVTL in comparison to polycrystalline due to their higher solar efficiency with reference to polycrystalline panels.
The original contributions presented in the study are included in the article/supplementary material, further inquiries can be directed to the corresponding authors.
MJ: Data curation, Formal Analysis, Methodology, Validation, Visualization, Writing–original draft. MH: Software, Validation, Visualization, Writing–review and editing. MU: Investigation, Methodology, Writing–review and editing, Formal Analysis. FA: Investigation, Writing–review and editing, Methodology. MS: Data curation, Writing–original draft, Methodology. WA: Investigation, Writing–review and editing, Project administration. GL: Formal Analysis, Project administration, Writing–review and editing, Resources. AW: Conceptualization, Formal Analysis, Investigation, Project administration, Supervision, Validation, Writing–review and editing.
This work was supported by the National Research Foundation of Korea (NRF) grant funded by the Korea government (MSIT) (No. 2022R1F1A1062793); Korea Institute of Planning and Evaluation for Technology in Food, Agriculture and Forestry (IPET) through Technology Commercialization Support Program, funded by Ministry of Agriculture, Food and Rural Affairs (MAFRA) (No. 821048-3).
The authors acknowledge the support of the Department of Energy Systems Engineering, University of Agriculture, Faisalabad and Department of Electrical, Electronics and Telecommunication Engineering, University of Engineering and Technology, Faisalabad Campus for providing the research and testing facility.
The authors declare that the research was conducted in the absence of any commercial or financial relationships that could be construed as a potential conflict of interest.
All claims expressed in this article are solely those of the authors and do not necessarily represent those of their affiliated organizations, or those of the publisher, the editors and the reviewers. Any product that may be evaluated in this article, or claim that may be made by its manufacturer, is not guaranteed or endorsed by the publisher.
Abdallah, A., Opoku, R., Sekyere, C. K. K., Boahen, S., Amoabeng, K. O., Uba, F., et al. (2022). Experimental investigation of thermal management techniques for improving the efficiencies and levelized cost of energy of solar PV modules. Case Stud. Therm. Eng. 35, 102133. doi:10.1016/j.csite.2022.102133
Al-naser, Q. A. H., Al-barghoothi, N. M. A., and Al-ali, N. A. S. (2013). The effect of temperature variations on solar cell efficiency. Int. J. Eng. Bus. Enterp. Appl. (IJEBEA).
Arce-Medina, E., and Paz-Paredes, J. I. (2009). Artificial neural network modeling techniques applied to the hydrodesulfurization process. Math. Comput. Model 49, 207–214. doi:10.1016/j.mcm.2008.05.010
Bollipo, R. B., Mikkili, S., and Bonthagorla, P. K. (2021). Hybrid, optimal, intelligent and classical PV MPPT techniques: a review. CSEE J. Power Energy Syst. 7. doi:10.17775/CSEEJPES.2019.02720
Combari, D. U., Zerbo, I., Zoungrana, M., Ramde, E. W., and Bathiebo, D. J. (2017). Modelling study of magnetic field effect on the performance of a silicon photovoltaic module. Energy Power Eng. 09 09, 419–429. doi:10.4236/epe.2017.98028
Daher, D. H., Gaillard, L., Amara, M., and Ménézo, C. (2018). Impact of tropical desert maritime climate on the performance of a PV grid-connected power plant. Renew. Energy 125, 729–737. doi:10.1016/j.renene.2018.03.013
Das, M. R. (2019). Effect of different environmental factors on performance of solar panel. Int. J. Innovative Technol. Explor. Eng. 8, 15–18. doi:10.35940/ijitee.J9889.0981119
Dawood, T. A., Barwari, R. R. I., and Akroot, A. (2023). Solar energy and factors affecting the efficiency and performance of panels in erbil/kurdistan. Int. J. Heat Technol. 41, 304–312. doi:10.18280/ijht.410203
Dhimish, M. (2020). Thermal impact on the performance ratio of photovoltaic systems: a case study of 8000 photovoltaic installations. Case Stud. Therm. Eng. 21, 100693. doi:10.1016/j.csite.2020.100693
Ekinci, F., Yavuzdeğer, A., Nazlıgül, H., Esenboğa, B., Doğru Mert, B., and Demirdelen, T. (2022). Experimental investigation on solar PV panel dust cleaning with solution method. Sol. Energy 237, 1–10. doi:10.1016/j.solener.2022.03.066
Elshazly, E., El-Rehim, A. A., and El-Mahallawi, I. (2021). Comparison of dust and high-temperature effects on mono and poly photovoltaic panels. IOP Conf. Ser. Mater Sci. Eng. 1172, 012019. doi:10.1088/1757-899x/1172/1/012019
Fathabadi, H. (2018a). Effect of external AC electric and magnetic fields on the power production of a silicon solar cell. IEEE J. Photovolt. 8, 1408–1412. doi:10.1109/JPHOTOV.2018.2860946
Fathabadi, H. (2018b). Impact of high-voltage power transmission lines on photovoltaic power production. Sol. Energy 163, 78–83. doi:10.1016/j.solener.2018.01.048
Giyantara, A., Wisyahyadi, , Rizqullah, R. B., and Kusuma Priyanto, Y. T. (2021). “Analysis of partial shading effect on solar panel power output,” in Journal of Physics: Conference Series, Coimbatore, India, 25-26 March 2021. doi:10.1088/1742-6596/1726/1/012022
Hu, Z. (2023). Towards solar extractivism? A political ecology understanding of the solar energy and agriculture boom in rural China. Energy Res. Soc. Sci. 98, 102988. doi:10.1016/j.erss.2023.102988
Javed, M. R., Waleed, A., Riaz, M. T., Virk, U. S., Ahmad, S., Daniel, K., et al. (2019). “A comparative study of maximum power point tracking techniques for solar systems,” in 2019 22nd International Multitopic Conference (INMIC) (IEEE), Islamabad, Pakistan, 29-30 November 2019, 1–6.
Javed, M. R., Waleed, A., Virk, U. S., and ul Hassan, S. Z. (2020). “Comparison of the adaptive neural-fuzzy interface system (ANFIS) based solar maximum power point tracking (MPPT) with other solar MPPT methods,” in 2020 IEEE 23rd international multitopic conference (INMIC) (IEEE), Bahawalpur, Pakistan, 5-7 November 2020, 1–5.
Kaewpraek, C., Ali, L., Rahman, M. A., Shakeri, M., Chowdhury, M. S., Jamal, M. S., et al. (2021). The effect of plants on the energy output of green roof photovoltaic systems in tropical climates. Sustain. Switz. 13, 4505. doi:10.3390/su13084505
Magare, D. B., Nichinte, A. S., and Vyawahare, V. A. (2022). Estimation of module temperature effects on seasonal performance variation of different photovoltaic Technology modules. Appl. Sol. Energy (English Transl. Geliotekhnika) 58, 226–237. doi:10.3103/S0003701X22020116
Maghami, M. R., Hizam, H., Gomes, C., Radzi, M. A., Rezadad, M. I., and Hajighorbani, S. (2016). Power loss due to soiling on solar panel: a review. Renew. Sustain. Energy Rev. 59, 1307–1316. doi:10.1016/j.rser.2016.01.044
Ndeto, M. P., Wekesa, D. W., Kinyua, R., and Njoka, F. (2020). Investigation into the effects of the earth’s magnetic field on the conversion efficiency of solar cells. Renew. Energy 159, 184–194. doi:10.1016/j.renene.2020.05.143
Osman, A. I., Chen, L., Yang, M., Msigwa, G., Farghali, M., Fawzy, S., et al. (2023). Cost, environmental impact, and resilience of renewable energy under a changing climate: a review. Environ. Chem. Lett. 21, 741–764. doi:10.1007/s10311-022-01532-8
Panmuang, P., and Photong, C. (2021). Effects of intensity of magnetic field generated by neodymium permanent magnet sheets on electrical characteristics of monocrystalline silicon solar cell. Indonesian J. Electr. Eng. Comput. Sci. 21, 18. doi:10.11591/ijeecs.v21.i1.pp18-27
Pescetelli, S., Agresti, A., Viskadouros, G., Razza, S., Rogdakis, K., Kalogerakis, I., et al. (2022). Integration of two-dimensional materials-based perovskite solar panels into a stand-alone solar farm. Nat. Energy 7, 597–607. doi:10.1038/s41560-022-01035-4
Raza, H. A., Riaz, M. T., Idrees, M., Afzal, M. M., Hashmi, W. S., and Asif, M. W. (2019). “Analysis the effect of 500kv high-voltage power transmission line on the output efficiency of solar-panels,” in 1st International Conference on Electrical, Communication and Computer Engineering, ICECCE 2019, Swat, Pakistan, 24-25 July 2019. doi:10.1109/ICECCE47252.2019.8940803
Saive, R. (2021). Light trapping in thin silicon solar cells: a review on fundamentals and technologies. Prog. Photovoltaics Res. Appl. 29, 1125–1137. doi:10.1002/pip.3440
Sourabié, I., Zerbo, I., Zoungrana, M., Combari, D. U., and Bathiebo, D. J. (2017). Effect of incidence angle of magnetic field on the performance of a polycrystalline silicon solar cell under multispectral illumination. Smart Grid Renew. Energy 08, 325–335. doi:10.4236/sgre.2017.810021
Usman, M., Asghar, F., Javed, M. R., Virk, U. S., Jamal, M. Y., and Waleed, A. (2023). An efficient controller design of a PV integrated single inductor multiple output DC–DC converter for dynamic voltage and low power applications. Sci. Prog. 106, 368504231201792. doi:10.1177/00368504231201792
Vengatesh Ramamurthi, P., and Rajan Samuel Nadar, E. (2022). IoT-based energy monitoring and controlling of an optimum inclination angle of the solar panels. IETE J. Res. 68, 3108–3118. doi:10.1080/03772063.2020.1754301
Vimala, M., Ramadas, G., Perarasi, M., Manokar, A. M., and Sathyamurthy, R. (2023). A review of different types of solar cell materials employed in bifacial solar photovoltaic panel. Energies (Basel) 16, 3605. doi:10.3390/en16083605
Waleed, A., and Fan, Z. (2017). Fabrication of stable organometallic halide perovskite NWs based optoelectronic devices. Sci. Bull. (Beijing) 62, 645–647. doi:10.1016/j.scib.2017.04.012
Waleed, A., Riaz, M. T., Muneer, M. F., Ahmad, M. A., Mughal, A., Zafar, M. A., et al. (2019). “Solar (PV) water irrigation system with wireless control,” in RAEE 2019 - International Symposium on Recent Advances in Electrical Engineering, Islamabad, Pakistan, 28-29 August 2019. doi:10.1109/RAEE.2019.8886970
Wu, D., Shen, L., Zhang, D., Zhu, T., Zheng, J., and Gong, X. (2023). Effect of external magnetic field on bulk heterojunction polymer solar cells. Macromol. Rapid Commun. 44, e2100933. doi:10.1002/marc.202100933
Zerbo, I., Saria, M., Zoungrana, M., Ouedraogo, A., and Bathiebo, D. (2017). Effect of incidence angle varying from 0 rad to π/2 rad and intensity of radio waves on the performance of a silicon solar cell. Adv. Sci. Technol. Res. J. 11, 68–75. doi:10.12913/22998624/80090
Zerbo, I., Zoungrana, M., Seré, A. D., and Zougmoré, F. (2012). “Silicon solar cell under electromagnetic wave in steady state: effect of the telecommunication source’s power of radiation,” in IOP Conference Series: Materials Science and Engineering. doi:10.1088/1757-899X/29/1/012019
Keywords: transmission lines, electromagnetic waves, high voltage, photovoltaics, artificial neural network-ANN
Citation: Javed MR, Hussain MI, Usman M, Asghar F, Shahid M, Amjad W, Lee GH and Waleed A (2023) Experimental study on impact of high voltage power transmission lines on silicon photovoltaics using artificial neural network. Front. Energy Res. 11:1267947. doi: 10.3389/fenrg.2023.1267947
Received: 27 July 2023; Accepted: 06 November 2023;
Published: 16 November 2023.
Edited by:
Leonardo Micheli, Sapienza University of Rome, ItalyReviewed by:
Omveer Singh, Gautam Buddha University, IndiaCopyright © 2023 Javed, Hussain, Usman, Asghar, Shahid, Amjad, Lee and Waleed. This is an open-access article distributed under the terms of the Creative Commons Attribution License (CC BY). The use, distribution or reproduction in other forums is permitted, provided the original author(s) and the copyright owner(s) are credited and that the original publication in this journal is cited, in accordance with accepted academic practice. No use, distribution or reproduction is permitted which does not comply with these terms.
*Correspondence: Gwi Hyun Lee, Z2hsZWVAa2FuZ3dvbi5hYy5rcg==; Aashir Waleed, YWFzaGlyLndhbGlkQHVldC5lZHUucGs=
†ORCID: Furqan Asghar, orcid.org/0000-0002-6159-2236; Aashir Waleed, orcid.org/0000-0002-6929-8373
Disclaimer: All claims expressed in this article are solely those of the authors and do not necessarily represent those of their affiliated organizations, or those of the publisher, the editors and the reviewers. Any product that may be evaluated in this article or claim that may be made by its manufacturer is not guaranteed or endorsed by the publisher.
Research integrity at Frontiers
Learn more about the work of our research integrity team to safeguard the quality of each article we publish.