 Yubao Wang1,2,3,4,5*
 Rongyu Cao
 Da Luo
94% of researchers rate our articles as excellent or good
Learn more about the work of our research integrity team to safeguard the quality of each article we publish.
Find out more
METHODS article
Front. Energy Res. , 05 December 2023
Sec. Sustainable Energy Systems
Volume 11 - 2023 | https://doi.org/10.3389/fenrg.2023.1265924
This article is part of the Research Topic Modeling Practice and Mechanism Design of Green Energy Systems towards Sustainable Development View all 18 articles
Carbon trading mechanisms and the development of integrated energy systems are important ways to realize the “carbon peaking and carbon neutrality” goal, and the problem of benefit distribution is of paramount importance to achieving the goal. The article innovatively takes the supply side of the provincial integrated energy system as the entry point, considers the economic value of carbon, and focuses on the rational allocation of each subject obtained by comparing different methods. The paper mainly uses the Shapley value of the cooperative game and the kernel method to establish the initial allocation to the main actors, and subsequently, it considers the introduction of the risk level, resource input, environmental pollution, technological innovation, and profit of the main actors to modify the result of the benefit allocation. This paper takes the power generation data of the Xinjiang region as an example, and the results show that 1) thermal power still has the most weight among all power generation modes and obtains 522.83, 503.48, and 406.30 billion yuan under the initial, nucleolus, and modified allocation methods, respectively, and receives the most revenue. 2) Considering that the multi-factor allocation method pays more attention to the allocation of fairness, compared with the initial allocation, thermal power gains decreased by 22.29%, while wind and solar power gains were improved by 17.87% and 60.90%, respectively. The result could be a stronger push for the development and transformation of power energy. 3) The feasibility of this game as a convex game should be verified, the improvement method should be demonstrated through examples, and the results should be compared with reality. Finally, policy recommendations are proposed, which will be useful for realizing the “carbon peaking and carbon neutrality” goal and the synergistic development of integrated energy systems.
In recent decades, due to the needs of human production and life leading to large-scale emissions of greenhouse gases, thus creating a serious climate situation, the development of a low-carbon environment has currently become the priority of world countries that are in search of a new development model out of necessity. In the context of the transition to low-carbon economy (AK-BHD M., 2021), developed countries and relevant international organizations, mainly the United States and Japan, have proposed to strive to achieve net-zero carbon dioxide emissions by 2050 and have formulated relevant strategic measures. In September 2020, China also proposed the goal of achieving carbon neutrality by 2060 (Mallapaty S., 2020). On 21 October 2022, China proposed that due to its own advantages in energy resources, it will gradually promote the realization of the “carbon peaking and carbon neutrality” goal and adhere to the planned and step-by-step goal of achieving carbon peaking. In promoting the transformation of the energy structure, it will adhere to the principle of building up before breaking down and strive not to affect people’s livelihoods and the economy.
In this context, the “14th Five-Year Plan” for energy development emphasizes the need to continue to promote the positive and orderly development of international energy services and to promote the “intelligent and green enhancement of energy utilization scenarios.” The integrated energy system (IES) is an integrated system of energy production, supply, and distribution formed by the integrated optimization of the “production, distribution, use, and storage” of all types of energy in planning, operation, and trading. It was first studied in Europe as an emergency measure in the 1950s (Xie and Wang, 1984; Capuder and Mancarella, 2014; Liu B et al., 2021). The further development of regional integrated energy systems means that the overall energy utilization efficiency and operational economy of the system can be effectively improved through the complementary coupling between multiple energy sources (Peng et al., 2017). Theoretically, the essence of integrated energy systems is not a completely new concept, and the essence of promoting the development of integrated energy systems is the coupling of cleaner energy with traditional gas, kerosene, and other energy power sources. The share of non-fossil energy consumption is approximately 15% in recent years, and the share of end-use electricity will account for only 25%, of which the share of non-fossil energy in the last 10 years is shown in Figure 1. Although the international community and organizations have made significant progress in clean energy in recent years, the realization of the goal of carbon neutrality requires the accelerated integration of the entire economic and social system to transform and upgrade to low-carbon development, which will lead to a profound change in the energy system. In this regard, China, being the largest carbon-emitting country, faces enormous challenges and implementation difficulties.
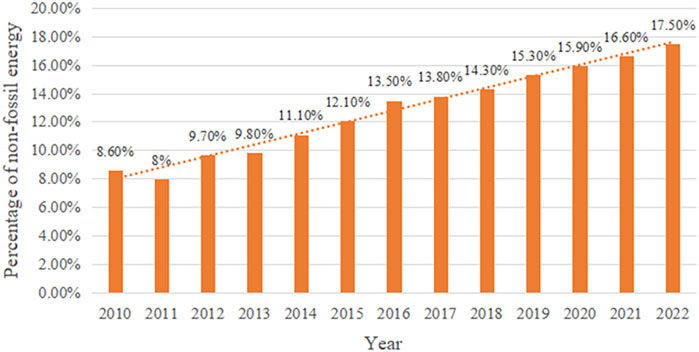
FIGURE 1. Percentage of non-fossil energy consumption in China in the last 10 years.
The western region is China’s traditional energy base, with approximately 70% of China’s coal, oil, and natural gas reserves in the northwestern region. The study of energy development in the west is an important strategy for China’s development. Xinjiang is a vast area, accounting for approximately one-sixth of China’s land area, and is extremely rich in fossil and renewable energy resources, with the potential to take the lead in achieving carbon neutrality. The total amount of coal in Xinjiang is expected to reach 2.19 trillion tons, accounting for approximately 40 percent of China’s total amount of coal and ranking first in the country. Xinjiang is also rich in renewable energy resources. The theoretical wind energy reserves (10-m-high layer) amount to 872 million kilowatts, accounting for approximately 20.8% of China’s total wind energy reserves and ranking second in China. The annual solar irradiance of Xinjiang is 5.5–6.6 million kilojoules per square meter, and the annual sunshine hours are 2,550–3,500 h, ranking second in China in terms of total resources. However, due to the low level of economic development, the distribution ratio of clean energy to traditional fossil energy is not balanced. The total energy consumption in Xinjiang has been on the rise since the “13th Five-Year Plan.” In the power industry, the installed thermal power capacity of Xinjiang in 2020 increased to 63.37 million kilowatts, with an annual thermal power generation capacity of 325.76 billion kW hours, accounting for 58.9% of the installed capacity and 80.8% of the power generation capacity in Xinjiang, respectively (data source Xinjiang Statistical Yearbook 2021). Thermal power is the absolute main source of power in Xinjiang, both in terms of installed capacity and power generation, which will also lead to excessive energy consumption and pollution in the Xinjiang region (as shown in Table 1, energy consumption in Xinjiang’s Electricity Industry, data source Xinjiang Statistical Yearbook 2001, 2012, 2020, 2021), thus not conducive to achieving the “carbon peaking and carbon neutrality” goal for the entire Xinjiang region.
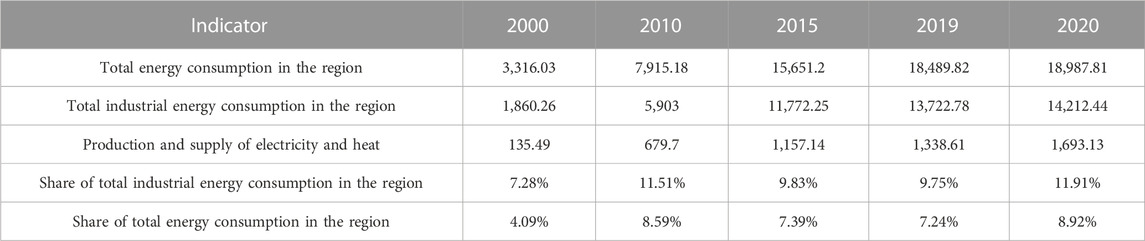
TABLE 1. Energy consumption in Xinjiang’s power industry (unit: ten thousand tons of standard coal).
Since the energy consumption of the power industry plays an important role in industrial and regional development, the development of the current integrated energy systems in the region cannot be separated from the coupling of traditional energy generation and clean new energy power. Therefore, the distribution of benefits between thermal, wind, and photovoltaic power generation in the region studied in this paper has become a crucial issue in the current environment. Therefore, it is necessary to analyze the distribution of benefits among the three power generation subjects within the framework of regional integrated energy systems and identify ways to optimize the path of benefit distribution to accelerate progress in clean and low-carbon power energy in Xinjiang.
Based on the aforementioned ideas, Section 1 mainly describes the research background, purpose, and significance of this paper, pointing out that this paper focuses on the problem to be solved. Section 2 compares, analyzes, and summarizes the related literature at home and abroad, understands their research ideas and methods, summarizes insights gained from them, and points out the differences between this paper and the previous research. Section 3 constructs the theoretical model, establishes the revenue calculation system and benefit distribution mechanism, and clarifies the revenue sources of different subjects. Section 4 analyzes specific examples using the Shapley value, kernel method, and improved Shapley value for calculation, and the results are compared and verified. Section 5 provides the main conclusions and recommendations and summarizes the findings of the whole study. It also outlines the need for the development of more detailed regional and cross-regional integrated energy systems to enhance the planning program and build a more perfect distribution mechanism, providing crucial insights for decision-making.
Any product is the result of multiple factors of production, and each factor of production involved in the production of a good product makes its own contribution to the outcome and therefore deserves a share of the outcome (Raad E et al., 1999). In the case of energy activities, this means that the benefits generated are distributed and that the interests of the various actors in the cooperation are reasonably distributed in order to stimulate more people to build IES through cooperation.
An IES is a system formed by the combination of several independent individuals, and each subject in the system has a different mode of operation and generates mutual cooperation within the system in order to obtain revenue. In determining the subjects of IES, each scholar studies a different number of subjects. Some scholars have discussed the optimal operation of a regional integrated energy system (RIES) from the perspective of game theory, with users as followers and energy sales companies as leaders, and analyzed the mutual relationship between the two (Luo F et al., 2017). Analyzing the demand-side response strategy from the user’s side, the supply and demand sides are considered the two main actors involved in setting prices in the energy market (Paudel A et al., 2018). The aforementioned scholars and other research subjects are two-sided; the analysis is mainly based on game theory in the cooperative game to analyze the relationship between users and the supply side. The focus of the study on the two-party subjects is characterized by a clear relationship, but the limited number of subjects may lead to an analysis that lacks depth.
Among these, using game theory to allocate the capacity of the IES, in which wind power, photovoltaic, and energy storage devices are different subjects, allows for the optimization of the interests of these different subjects while guaranteeing the operation of the system (Liu X et al., 2018). Synergistic optimization is achieved via a multi-layer, multi-zone optimization approach that simultaneously optimizes the energy interactions between the three main bodies of the industrial park, residential area, and commercial area (Guo L et al., 2013). Through the use of the cooperative revenue approach, the benefits of six areas, namely, combined cooling, heating, and power (CCHP) cogeneration units, ground-source heat pumps (HPs), electric refrigeration (ER) units, electrochemical energy storage (EES) devices, wind turbines (WTs), and photovoltaics (PVs), are rationally distributed based on optimizing operating costs and carbon emissions (WANG et al., 2022a). At present, most scholars researching the distribution of the main body of the study focus on cases involving three or more parties, with most studies centered on the system of a machine or energy-using party. In contrast, research on the power generation side of energy supply is relatively limited. The article selects thermal, wind, and solar power as the research subjects for benefit allocation in the provincial power generation mode, establishes a reasonable benefit-sharing mechanism, and realizes the win–win development of multiple subjects.
Game theory is a classical theory of balancing the interests between different subjects, which mainly studies the decision-making behavior of multiple subjects with mutual influence and interaction. In the traditional monopoly power market, the power generation company usually holds sole pricing authority and lacks an effective competitive mechanism (Diao et al., 2001). Currently, there have been domestic and foreign scholars who have introduced the game theory method into the study of the distribution of benefits of the system in order to coordinate the distribution of competitive cooperation between energy supply, capacity, and energy use in the regional integrated energy system. Scholars use different allocation methods according to the relationship between different research subjects. Based on the Stackelberg game to determine the Nash equilibrium, a game model for grid construction considering the demand response is developed to optimize the overall economic efficiency of the system (Tang R et al., 2019). In exploring the distribution of benefits, a methodology for sharing the benefits of electricity substitution is proposed by utilizing a combination of kernel and Shapley values. Chen X. et al. (2019)analyzed and quantified the value of electricity substitution in reducing production costs, operation costs, and pollution emissions. The dominant-subordinate game in game theory is mainly applicable when the allocating agents have upward and downward relationships, and it is not applicable for this paper.
The Shapley value approach is the most popular of all cooperative game approaches, with the advantage of highlighting marginal contributions and maintaining the stability of the overall coalition. However, these factors alone are not sufficient, and a small number of scholars have used it more convincingly in conjunction with the kernel approach. A methodology for profit distribution is proposed and validated using an improved non-dominated sorting genetic algorithm based on the improved Shapley value method combined with the kernel method (Wang et al., 2022b). In terms of cooperation and gaming, a methodology for shared alternative electrical energy gains is proposed using kernel and Shapley values. The value of electrical energy substitution in reducing production costs, operation costs, and pollution emissions was analyzed and quantified (Chen F. et al., 2019).
Furthermore, several scholars have used a modified Shapley method based on the initial allocation to make the outcome more equitable; however, the method of improvement varies slightly from scholar to scholar. A cooperative revenue model is proposed that considers the stochastic nature of PV output and incorporates risk control; it analyzes cooperative transactions between existing consumers and community IES (Ma L et al., 2018). A different regional alliance and a way of gaming and optimization are discussed through a benefit distribution approach with different RIESs as the gaming subjects (Cong et al., 2019). In the improved Shapley model species, the physical cloud center of gravity method is utilized for redistribution, and relevant indicators such as service quality, total input, and risk are proposed so as to ensure the fairness and impartiality of the charging pile benefit distribution (Wang D. et al., 2023). In order to achieve the goal of IES reliability enhancement, a theoretical framework system is proposed using the indicator of risk reduction, with fairness as the basic criterion, and it involves the incorporation of the probability of failure events as the weight factors, which are then multiplied by the result (Cao M et al., 2022). In the cooperative operation involving hydropower plants at different levels, the principles of compensation and fairness should be consistently applied to ensure the distribution of benefits of hydropower plants at all levels. The coefficient of variation method is applied to the Shapley value model under multiple subjects using different weights of individuals as the index system (Wang L et al., 2021). Amidst the free energy market, a methodology is proposed to guide consumers by calculating the extent of the losses in the distributed generation distribution system (DS). The weighting factors presented contain the average of the marginal contributions of the different subjects (Singh V et al., 2023).
Scholars at home and abroad have established IES efficiency evaluation models from different perspectives and at different levels to verify the effectiveness and good distribution of the system operation so as to correctly evaluate the overall efficiency of the IES operation. These include analytic hierarchy process (AHP) methods, entropy weighting methods, gray correlation methods, multi-attribute decision-making methods, intelligent algorithms, and various combinations of methods. For example, a study has taken the electric-thermal coupled multi-coupled energy system as the research object, selected the benefit evaluation indexes from the perspective of technical and economic evaluation, elaborated the meaning, calculation formula, application scenarios, and limitations of each evaluation index, and established a basically complete system of benefit evaluation indexes (Biezma and San Cristobal, 2006). Based on a detailed combination of existing research results, the evaluation index information of the multi-energy system is analyzed from multiple perspectives. A corresponding comprehensive evaluation method is then used to reflect the level of benefits provided by the multi-energy system compared to the traditional energy system, and appropriate measures are put forward (Mancarella, 2014). In the construction of evaluation indicators, a combination of subjective and objective weights was utilized, employing analytic hierarchy process (AHP) and technique for order preference by similarity to ideal solution (TOPSIS), and finally, an assessment and ranking of the impact factors of IES were conducted to evaluate barriers and strategies for building resilient energy systems (Xu K et al., 2022). The further development of IES was analyzed and evaluated from a holistic perspective, and five indicators and evaluation criteria related to economic, environmental, and energy use efficiency were established and modeled (Zhou J et al., 2019). When exploring the indicators of the evaluation method, we start by considering the relevant impact indicators of technology, economy, environment, and society. Through the use of correlation analysis, the subjective and objective weights affecting the effectiveness of the model were derived, and the relevant weight coefficients were obtained by combining the maximum entropy principle with the minimum weighted total distance to the ideal solution. Finally, the optimal solution was determined based on the gray correlation method (Yang, K et al., 2018).
The emissions trading method based on Coase’s property rights theorem is an effective means of environmental regulation, while the carbon trading mechanism originates from emissions trading, which is a system that regulates the international carbon trading market. Scholars have studied the optimal use of different loads in the micro-integrated energy system while introducing the carbon trading mechanism, which not only brings economic benefits but also promotes the further optimization of the environment, allowing for their synergistic development.
In RIES, a new low-carbon optimization and regulation model is proposed by introducing small nuclear power units and carbon trading mechanisms into it, and a validation analysis is conducted based on the structural data of North China, which concludes that it has good economic and low-carbon environmental effects (Li Y et al., 2022). A model for CCHP and carbon capture devices is discussed, and its optimal dispatchability is improved by applying aspects such as the demand-side response. The results indicate that the invocation of carbon trading and demand response is essential to reduce the amount of load used and carbon emissions, which is important for ecological and regional development (Yang P et al., 2023). In achieving the reduction of carbon emissions, due to the uncertainty of the scale of wind power usage and the stochastic nature of carbon emissions, this paper proposes a new economic dispatch method that addresses the reduction of economic uncertainty while increasing revenue generation (Jin J et al., 2019). In terms of improving the solution efficiency, an optimization model based on Anderson’s acceleration with alternating direction method of multipliers (AA-ADMM) is proposed (Wang Y. et al., 2023). In the context of trading carbon emissions and renewable energy mix in China, a cost optimization model is proposed and applied to an integrated wind-power–photovoltaic cogeneration power dispatch system in Xinjiang, and finally, real-life cases in the northern and southern regions of China are compared. The analysis of the results shows that carbon emissions trading in the application of renewable energy installations can effectively increase the proportion of renewable energy installations and achieve the goal of reducing carbon emissions (Tan Q et al., 2021).
In summary, current research by both domestic and foreign scholars focuses on the operation and dispatch optimization of IES, and with the establishment of carbon neutral objectives, the combination of research with IES optimization under the “carbon peaking and carbon neutrality” framework is deepening. However, there are still many research points that have not been covered yet, and this paper contributes in the following ways:
1) This paper considers the main body of IES benefit distribution from the macro-level, and the target of distribution is not the micro-machine or the energy user but the thermal power, wind power, and photoelectricity of energy supply. 2) Through carbon trading, the value of the environment is quantified so that carbon trading and IES are synergistically linked and then allocated to the main actors. The combination of these two mechanisms can theoretically provide us with the maximum realization of a low-carbon economy. 3) Game theory is increasingly being used in IES, with different authors using different game methods for different subjects. The article innovatively uses the Shapley value, kernel method, and improved Shapley value to allocate the subjects, comparing the allocation results to arrive at a fairer, more reasonable, and more reliable benefit allocation result. The obtained results are verified using the calculation cases’ results. The shortcoming of the article is that it only considers the game between the three parties. Currently, in some areas, nuclear power has become the main component of power generation, and therefore, the three-party game is incomplete and requires a deeper four-party or five-party game in order to get a fairer and more reasonable distribution.
IES is a multi-level, complex coupled system of multiple energy inputs, conversions, and outputs, which includes a variety of energy coupling devices. At present, the vast majority of terminals are still in a single way for the use of equipment, unable to achieve multi-energy coupling, but also not conducive to economic efficiency and emission reduction efforts. With the promotion of IES in parks, so that multiple operating entities share information with each other and form a cooperative alliance, energy can be staggered and graded within a park, the efficiency of equipment is significantly enhanced, and the economic and environmental effects are immediate. The benefits of cooperative power supply. The internal energy flow diagram of a regional IES is shown in Figure 2. The external power conduction diagram of the integrated regional energy system is shown in Figure 3.
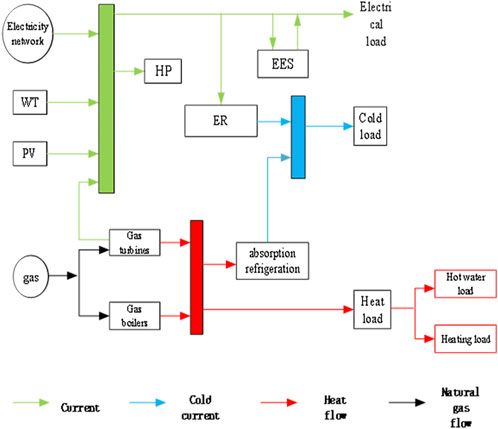
FIGURE 2. Energy flows within an integrated regional energy system.
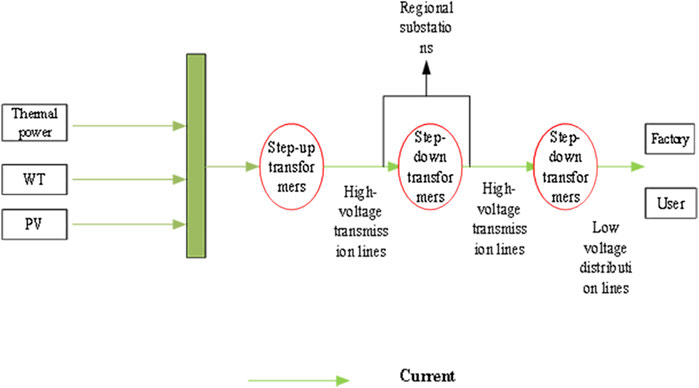
FIGURE 3. External power transmission of the integrated regional energy system.
This paper deals with three modes of power generation: thermal, wind, and solar, with the total return calculated as follows:
where
Cooperative games, the symmetry of non-cooperative games, are a type of game. Cooperative games emphasize collective rationality, efficiency, fairness, and equity. Maximizing the collective interest is called “collective rationality.” The Shapley value method is used to solve the problem of distributing members’ benefits in cooperative games, which distributes benefits to each member based on the average of the marginal benefits created by that member for participation in the coalition. This method satisfies four properties: symmetry, validity, redundancy, and additivity. The Shapley value method of benefit allocation is calculated as
Where member i has
The aforementioned Shapley value method only considers the single marginal benefit contribution of each subject to the cooperative alliance, completely ignoring the other contributions made by the subjects during the entire operation of the alliance. So, a single influencing factor is far from sufficient. According to the development trend of China’s policy and in alignment with the scholars’ efforts to improve the Shapley value and other research analyses, five aspects of multidimensional considerations should be incorporated: the level of risk, resource inputs, environmental pollution, technological innovation, and the profit factor. The level of risk includes both external and internal risks, and risk factors cannot be ignored in any indicator system, as different risks have a significant impact on the results, as shown in Table 2. Resource inputs include both tangible and intangible resources, which are explicit or invisible costs to the subject before they generate benefits and should be taken into account when allocating them. Environmental factors have become indispensable indicators, and we should consider other pollution alongside that causes carbon emissions. Technology innovation is also an important indicator, in the case of electricity, in terms of the controllability and stability of power generation and the technical treatment of surplus power. The marginal contribution is considered in the improved methodology, but it is important to consider not only the profit side of the equation but also the degree of contribution and growth rate.

TABLE 2. Evaluation system indicators.
The specific calculation steps are as follows: first, five experts and scholars in the field of energy and electricity were invited to score the primary and secondary indicators that affect different subjects related to each other in the regional energy system, and the primary indicator fuzzy matrix and secondary indicator fuzzy matrix were derived by two-by-two comparison, and the ratio of the degree of influence of element
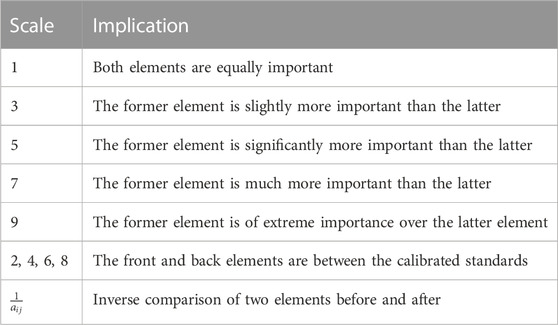
TABLE 3. Scale of 1–9.
Next, the weights were calculated and checked for consistency.
First, the approximate value of the eigenvectors of the judgment matrix is found based on the root method.
Finally, a logical consistency test of expert preferences is required for scoring the results of different experts. If the consistency test is not met, it means that there is a conflict in the experts’ judgment on the relative importance of the indicators.
The entropy weighting method is an objective determination method that utilizes the amount of information entropy contained in an indicator to determine the weight of the indicator. As the name suggests, the information entropy can be used to estimate the degree of discretization of the indicator; the lower the entropy value, the higher the degree of discretization of the indicator, and the greater the influence of the indicator on the overall assessment. The specific calculation steps are as follows:
First, the factors are normalized according to the number of each option.
Positive indicators:
Negative indicators:
Next, the entropy value of the
Then, the weights of each indicator are calculated:
The final weights of each indicator are obtained and can be ranked according to their magnitude to determine their level of importance in the decision.
For real-life problems, the use of only subjective or objective weighting methods can result in a certain lack of information, which can affect the final assessment results. The AHP method relies on the evaluator’s experience, is generally not affected by the values of the attributes, and is more stable; however, due to its strong subjectivity, it may overlook some laws within the data. The entropy weighting method can directly reflect the data of the sample as well as the distribution pattern, ensuring the absolute objectivity of the weights, but it does not include the connection of each indicator in the sample and is less stable, which may lead to the situation that the weighting results are contrary to the actual situation and cannot directly reflect the importance of the indicators. In this study, the two methods are combined for the weighting assignment. The formula is as follows:
where
The nucleolus method is known as the “solution” to the game, and for a cooperative game
The magnitude of
where
where
In this paper, the participants refer to the distribution of benefits received by thermal, wind, and photovoltaic power; the distribution of benefits received in the kernel method shall be the proceeds of the other collaborations of the union plus the proceeds generated when operating separately, as in the following equation:
Xinjiang is a traditional energy base and a new energy-rich region in China, and it is one of the best regions for the realization of an integrated regional energy system. In this paper, the three types of electricity generation in Xinjiang in 2020 are used as a case study and the benefits of the synergistic generation are analyzed. The Xinjiang region’s electricity generation in 2020 is taken from the Statistical Yearbook. Data source Xinjiang Statistical Yearbook 2013, 2015, 2021. The share of hydroelectric power generation in the Xinjiang region from 2015 to 2020 is shown in Figure 4. As the share of hydroelectric power generation is not high and does not match the characteristics of Xinjiang’s resource development and as it can be seen from the figure that the total amount of hydroelectric power has not changed significantly in recent years, the allocation of hydroelectric power generation is not considered in this study. The share of hydroelectric power generation in the Xinjiang region from 2010 to 2020 is shown in Figure 4. As the proportion of hydropower generation is not high and does not meet the characteristics of the development of resources in Xinjiang. Therefore, this study does not consider the allocation of hydropower generation. The data used in this paper are the most recently available data in the public domain, and the 2020 data are highly representative and not affected by other factors such as epidemics.
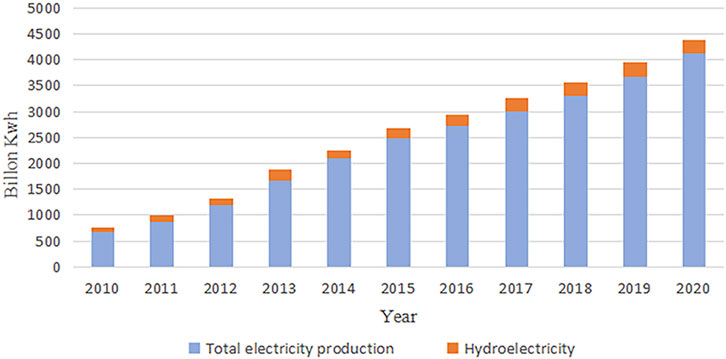
FIGURE 4. Percentage of hydropower in the Xinjiang region during 2010–2020.
The subsidy for wind power is approximately RMB 0.03/kWh, and for photovoltaic power, it is approximately RMB 0.05/kWh. The national price for carbon trading rights in 2020 is taken as an average of approximately RMB 45/ton, and the carbon emission factor for electricity is approximately 565 g CO2 per kWh. The data are shown in Table 4 (Costs and subsidies vary by region, data from Xinjiang Statistical Yearbook, Notice of the National Development and Reform Commission on Matters Relating to the Policy on Feed-in Tariffs for Photovoltaic Power Generation in 2020, IRENA, 2023).
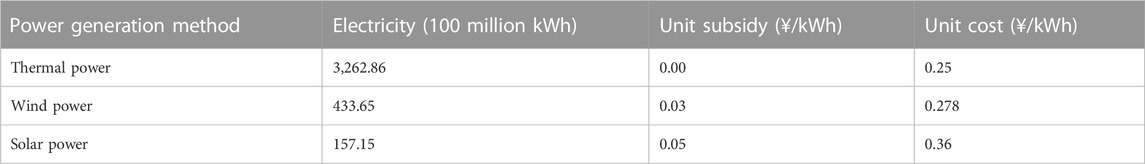
TABLE 4. Xinjiang 2020 power generation table.
It is first necessary to calculate the revenue generated by each generation method when working in isolation (all the following calculations are in 100 million of Chinese Yuan: thermal power, wind power and solar power are numbered 1, 2 and 3 respectively. c(1) = 358.90, c(2) = 59.99, c(3) = 11.85. When both approaches form an alliance operation, c(1,2) = 541.63, c(1,3) = 422.25, c(2,3) = 100.88. When all generation methods cooperate, c(1,2,3) = 864.47. Based on the aforementioned information, the Shapley value method was used to calculate the distribution of benefits that each generation method would receive for the operation of the entire union as follows:
According to the comprehensive subjective and objective assignment method described previously, five experts were invited to score the five primary indicators, risk level, resource input, environmental pollution, technological innovation, and profit factor, and 10 secondary indicators, such as external risk and physical resources, the degree of mutual influence, and fuzzy evaluation, to establish 1,065 sub-nodes based on the scoring results, after arithmetic averaging, according to the aforementioned formulas (3) and (4). The average summation was divided, and the results of each indicator are denoted as CR = CI/RI = 0.0

TABLE 5. Impact weights for each factor.
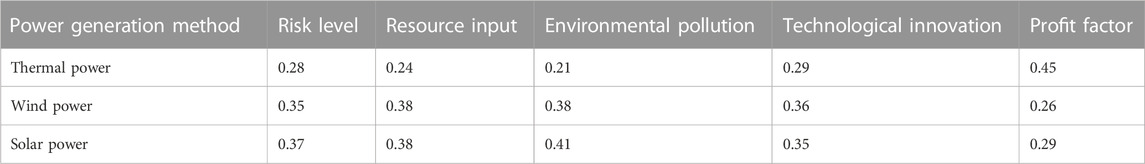
TABLE 6. Elements of the standardized risk assessment matrix.
Calculation of the objective weighting factor using the entropy weighting method according to equations 5 and 8 resulted in
Based on the analysis of the underlying data in Section 4.1, it is clear that the payoff is maximized when the three-party electric field is cooperatively allied and that it is not only much greater than the payoff generated when operating alone but also greater than the sum of the individual payoffs of the two-party alliance and the other party. The aforementioned characteristics are typical of a three-party cooperative game problem, and we can use the nucleolus method for allocation. The additional gains arising from coalition cooperation can be calculated using Equation 11, which yields Eq. 14.
where
The optimal solution was obtained using the optimization solution toolbox CVX in MATLAB solution software:
The values obtained using the initial Shapley value, nucleolus, and modified Shapley value methods of allocation are compared, as shown in Figure 5 and Table 7.
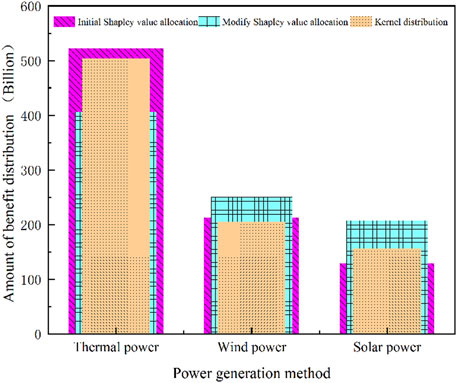
FIGURE 5. Comparison of the results of the three benefit allocations.
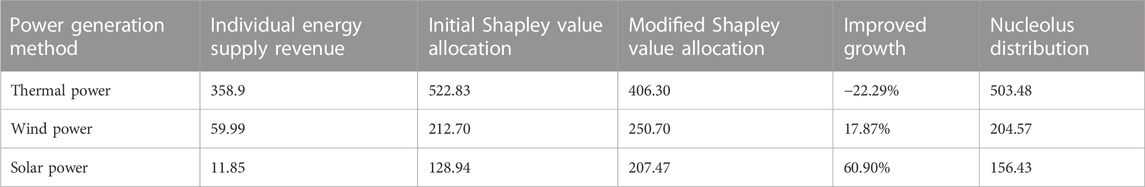
TABLE 7. Results of the three benefit allocations (100 million CNY).
We find that the initial Shapley value method and nucleolus allocation both provided similar results, and in the following paragraph, we will verify whether this benefit allocation is a convex game problem using the data from the nucleolus allocation as an example.
Based on the aforementioned equations, it can be verified that the benefit allocation problem solved in this paper is a convex cooperative game problem, and it is for this reason that the initial Shapley values are similar to the nucleolus allocation results. All three of these allocations satisfy the overall distributional rationality. In other words, the total benefits are the same as the total revenue, which satisfies the individual benefit rationality and the cooperative alliance benefit rationality, proving that the alliance cooperation is effective and relatively stable.
Figure 6, Figure 7, and Figure 8 represent the share of revenue of each power generation subject under the initial, improved, and kernel allocation methods, respectively. As can be seen from the figure, no matter which allocation method is used, thermal power obtains the largest proportion of revenue, and the proportion in the initial allocation even reaches 60%. This is because the Xinjiang region is actively promoting the share of new energy generation, but the current dominance of thermal power generation has not changed. The major advantage of thermal power, compared to the other two new energy generation sources, is its stable power supply, which can be used at any time. This is why in our efforts to promote power reform, thermal power is not completely abandoned. Instead, we focus on technological innovation and transformation based on the maturity of thermal power technology. This approach aims to improve the efficiency of thermal power generation and minimize environmental pollution. The biggest change in the improved Shapley value is solar power generation, with a 10% increase in revenue share. Due to the geography of Xinjiang, most of the area has sufficient light hours, which meets the basic requirements of solar power generation and results in less pollution in the environment. However, at the same time, there are some shortcomings to solar power, including the high capital requirements for construction and uncertainty and weather-related risks associated with its power generation. On the one hand, we should actively build the solar power industry and make full use of the geographical advantages of Xinjiang. On the other hand, we should also acknowledge the problem of its instability. Wind power has increased its share of revenue after improved methods, and the advantages and disadvantages of wind power and photovoltaic power are similar.
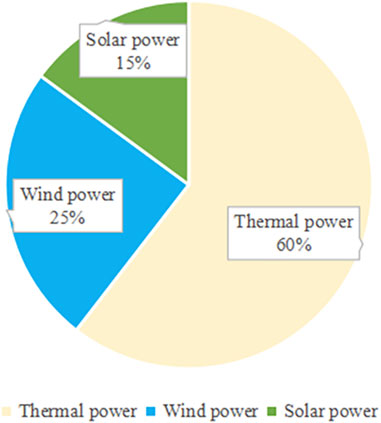
FIGURE 6. Initial Shapley value distribution.
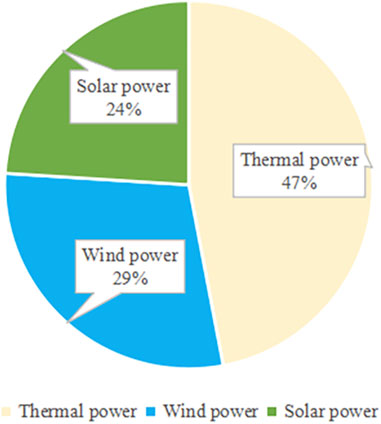
FIGURE 7. Modified Shapley value distribution.
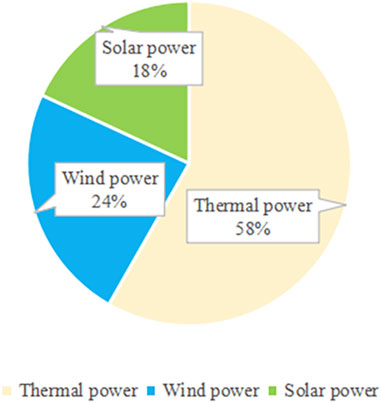
FIGURE 8. Nucleolus distribution.
In this paper, we have used the “carbon peaking and carbon neutrality” goal to allocate the electricity revenue in the Xinjiang region in three different ways. Using the improved Shapley value method is more to provide a fairer and more reasonable solution for our allocation and contribute to the synergistic development of the integrated regional energy system under the “carbon peaking and carbon neutrality” goal. The findings of this paper are as follows:
(1) At this stage, the importance of thermal power generation in the Xinjiang region remains unchanged. Among the three different allocation results, thermal power receives the highest benefit, which is also related to the proportion of total power generation accounted for by thermal power generation. At present, the thermal power generation technology in Xinjiang is relatively mature; therefore, this paper argues that the next development direction is to maximize the efficiency of power generation and the secondary use of surplus power.
(2) In particular, adding environmental and risk factors and considering environmental factors are in line with the requirements of China’s sustainable development. Electricity is closely related to people’s lives, and the stability of power generation is a problem we need to consider, which is also one of the reasons why new energy power generation technology cannot completely replace thermal power generation for the time being.
(3) The significant increase in gain in the improved Shapley value is solar power generation. So when we promote the development of the new energy generation industry in the future, we should pay more attention to the development according to local conditions so that we can better utilize our own advantages and improve the efficiency of resource use.
In order to better promote the development of a regional or even cross-integrated regional energy system and achieve the “carbon peaking and carbon neutrality” goal of Xinjiang’s power-related industries, the following policy recommendations are further proposed:
(1) The Xinjiang region should vigorously develop high-efficiency power generation and energy-saving and consumption-reducing technologies for coal power units. This includes increasing the introduction, promotion, and large-scale commercial application of advanced ultra-supercritical power generation technologies and supercritical circulating fluidized bed technologies. Additionally, there should be focus on the development of deep peaking and flexible power generation technologies for coal power units, leading to the transformation and upgrading of coal power units in the Xinjiang region. At the same time, the proportion of renewable energy generation will be increased to achieve energy structure transformation, accelerate the technological innovation of energy saving and consumption reduction of coal power units, deeply explore the peaking potential of coal power units, comprehensively improve the operational flexibility of coal power units, and support the transformation to an energy system based on renewable energy. Combining coal-fired power generation with solar energy can save energy, reduce pollution, achieve joint development of coal-fired units and renewable energy generation, and vigorously develop coupled coal-fired power generation technology with biomass and solid waste. Partial replacement of fuel can reduce carbon emissions from coal-fired power units, and comprehensive use of biomass, solid waste, and other resources can improve the flexibility of power generation from coupled units. The Xinjiang region should develop and utilize energy resources efficiently, cleanly prioritize the development of renewable energy, reasonably develop fossil energy resources and distributed energy resources according to local conditions, accelerate the pace of energy transformation, optimize the transformation of the energy structure, and vigorously develop CCUS technology to support the clean and low-carbon development of electricity.
(2) We should promote research, development, and breakthroughs in key technologies for China’s IES and accelerate the development of provincial-level action roadmaps for the power sector geared toward achieving the “carbon peaking and carbon neutrality” goal. We should promote the establishment of China’s IES in cross-regional, intra-regional, and key energy-using industries to facilitate sustainable and synergistic regional development and low-carbon and green industrial transformation. This will contribute to the construction of a clean and low-carbon, secure, and efficient energy security system and facilitate the transformation of energy supply and demand structures in China. At the same time, the development of relevant policies according to local conditions is needed not only to encourage the relatively high level of economic development of the provinces for industrial transformation and green upgrading but also to strongly support the level of economic development in not-so-high but resource-rich provinces, make full use of their own advantages, and accelerate the promotion of clean electricity reform.
(3) We should actively promote the development of the carbon trading mechanism and leverage the economic incentives of the carbon trading mechanism. As an important policy tool for achieving carbon neutrality in China, the carbon trading mechanism still has problems such as insufficient connection with the overall climate policy objectives and inactive market players. We need to strengthen the disclosure of climate information to the public and consider prioritizing the inclusion of renewable energy and industries not covered by the carbon market in the carbon trading system so that the carbon price level in China can increase steadily.
(4) We need to promote synergistic mechanisms for IES driven by carbon neutrality targets. In light of the rapid changes in the energy system, economy, and society driven by the carbon neutrality target, the status, role, and form of IES in national sustainable development will be re-conceptualized. By integrating carbon neutrality targets, regional and sectoral synergistic development, and IES construction, the carbon neutrality target dimension is added to the existing conceptual understanding, theoretical approaches, and optimization models, and a satisfactory combination of planning and layout, engineering, and governance and management measures is sought. At the same time, from the perspective of the carbon neutrality target, we will re-examine the multi-energy complementarity in the processes of clean production and circular economy and reconstruct the corresponding low-carbon industrial system.
The original contributions presented in the study are included in the article/Supplementary Material; further inquiries can be directed to the corresponding author.
YW: formal analysis, funding acquisition, writing–original draft,and writing–review and editing. RC: formal analysis, writing–original draft, and writing–review and editing. DL: formal analysis and writing–review and editing. PL:formal analysis and writing–review and editing. XC: writing–review and editing.
The author(s) declare that financial support was received for the research, authorship, and/or publication of this article. This research was supported by the Key Project of National Social Science Fund of China (22AJY006), the Major Project of National Social Science Fund of China (21&ZD133), the Natural Science Foundation of Xinjiang Uygur Autonomous Region (2022D01C665), the Fundamental Research Funds for the Autonomous Region Universities (XJEDU 2022P023), and the Interdisciplinary Team Construction Project of Xinjiang University (2022JPY004).
The authors declare that the research was conducted in the absence of any commercial or financial relationships that could be construed as a potential conflict of interest.
The handling editor JL declared a shared affiliation with authors at the time of the review.
All claims expressed in this article are solely those of the authors and do not necessarily represent those of their affiliated organizations, or those of the publisher, the editors, and the reviewers. Any product that may be evaluated in this article, or claim that may be made by its manufacturer, is not guaranteed or endorsed by the publisher.
Ak-Bhd, M. (2021). WMO greenhouse gas bulletin. Geneva, Switzerland: World Meteorological Organization.
Biezma, M. V., and San Cristobal, J. R. (2006). Investment criteria for the selection of cogeneration plants—a state of the art review. Appl. Therm. Eng. 26 (5-6), 583–588. doi:10.1016/j.applthermaleng.2005.07.006
Cao, M., Shao, C., Hu, B., Xie, K., Zhou, J., Leng, H., et al. (2022). Reliability tracing of the integrated energy system using the improved shapley value. Energy 260, 124997. doi:10.1016/j.energy.2022.124997
Capuder, T., and Mancarella, P. (2014). Techno-economic and environmental modelling and optimization of flexible distributed multi-generation options. Energy 71, 516–533. doi:10.1016/j.energy.2014.04.097
Chen, F., Liang, H., Gao, Y., Yang, Y., and Chen, Y. (2019a). Research on double-layer optimal scheduling model of integrated energy park based on non-cooperative game. Energies 12 (16), 3164. doi:10.3390/en12163164
Chen, X., Yu, Q., Xie, Y., and Jun, Y. K. (2019b). A cooperative game-theoretic-based method for sharing the benefits of electric energy substitution. Electr. Power Autom. Equip. 39 (03), 30–35+44. doi:10.1109/EI2.2018.8582266
Cong, H., Wang, X., and Jiang, C. (2019). Robust coalitional game theoretic optimisation for cooperative energy hubs with correlated wind power. IET Renew. Power Gener. 13 (13), 2391–2399. doi:10.1049/iet-rpg.2018.6232
Diao, Q., Lin, J., Ni, Y., and Chen, S. S. (2001). Game theory and its application in the electricity market. Automation Electr. Power Syst. 25 (1), 13–18. doi:10.3321/j.issn:1000-1026.2001.01.005
Guo, L., Liu, W., Cai, J., Hong, B., and Wang, C. (2013). A two-stage optimal planning and design method for combined cooling, heat and power microgrid system. Energy Convers. Manag. 74, 433–445. doi:10.1016/j.enconman.2013.06.051
IRENA (2023). Renewable power generation costs in 2022 (Abu Dhabi, International Renewable Energy Agency https://mc-cd8320d4-36a1-40ac-83cc-3389-cdn-endpoint.azureedge.net/-/media/Files/IRENA/Agency/Publication/2023/Aug/IRENA_Renewable_power_generation_costs_in_2022.pdf?rev=cccb713bf8294cc5bec3f870e1fa15c2.
Jin, J., Zhou, P., Li, C., Guo, X., and Zhang, M. (2019). Low-carbon power dispatch with wind power based on carbon trading mechanism. Energy 170, 250–260. doi:10.1016/j.energy.2018.12.126
Li, Y., Bu, F., Gao, J., and Li, G. (2022). Optimal dispatch of low-carbon integrated energy system considering nuclear heating and carbon trading. J. Clean. Prod. 378, 134540. doi:10.1016/j.jclepro.2022.134540
Liu, B., Zhang, Y. Q., Ma, L. W., Li, Z., Zhao, Q., Chen, S. Y., et al. (2021). Technical scheme design and optimization study of source-end base integrated energy system in Northwest China. Proc. CSEE (02), 568–580. doi:10.13334/j.0258-8013.pcsee.201001
Liu, X., Gao, B., Zhu, Z., and Tang, Y. (2018). Non-cooperative and cooperative optimisation of battery energy storage system for energy management in multi-microgrid. IET Generation, Transm. Distribution 12 (10), 2369–2377. doi:10.1049/iet-gtd.2017.0401
Luo, F., Ranzi, G., Wang, X., and Dong, Z. Y. (2017). Social information filtering-based electricity retail plan recommender system for smart grid end users. IEEE Trans. Smart Grid 10 (1), 95–104. doi:10.1109/TSG.2017.2732346
Ma, L., Liu, N., Zhang, J., and Wang, L. (2018). Real-time rolling horizon energy management for the energy-hub-coordinated prosumer community from a cooperative perspective. IEEE Trans. Power Syst. 34 (2), 1227–1242. doi:10.1109/TPWRS.2018.2877236
Mallapaty, S. (2020). How China could be carbon neutral by mid-century. Nature 586 (7830), 482–483. doi:10.1038/d41586-020-02927-9
Mancarella, P. (2014). MES (multi-energy systems): an overview of concepts and evaluation models. Energy 65, 1–17. doi:10.1016/j.energy.2013.10.041
Paudel, A., Chaudhari, K., Long, C., and Gooi, H. B. (2018). Peer-to-peer energy trading in a prosumer-based community microgrid: a game-theoretic model. IEEE Trans. Industrial Electron. 66 (8), 6087–6097. doi:10.1109/TIE.2018.2874578
Peng, K., Zhang, C., Xu, B., Chen, Y., and Zhao, X. (2017). Status and prospect of pilot projects of integrated energy system with multi-energy collaboration. Electr. Power Autom. Equip. 37 (6), 3–10. doi:10.16081/j.issn.1006-6047.2017.06.001
Raad, E., Ryan, R., and Sinkey, J. F. (1999). Leverage, ownership structure, and returns to shareholders of target and bidding firms. Q. J. Bus. Econ., 37–53.
Singh, V. P., Ahmad, A., and Jagtap, K. M. (2023). Weighted shapley value: a cooperative game theory for loss allocation in distribution systems. Front. Energy Res. 11, 1129846. doi:10.3389/fenrg.2023.1129846
Tan, Q., Ding, Y., Zheng, J., Dai, M., and Zhang, Y. (2021). The effects of carbon emissions trading and renewable portfolio standards on the integrated wind–photovoltaic–thermal power-dispatching system: real case studies in China. Energy 222, 119927. doi:10.1016/j.energy.2021.119927
Tang, R., Wang, S., and Li, H. (2019). Game theory based interactive demand side management responding to dynamic pricing in price-based demand response of smart grids. Appl. Energy 250, 118–130. doi:10.1016/j.apenergy.2019.04.177
Wang, D., Li, J., and Liu, Y. (2023a). Evaluating barriers and strategies to green energy innovations for sustainable development: developing resilient energy systems. Front. Energy Res. 11, 1201692. doi:10.3389/fenrg.2023.1201692
Wang, L., Li, Y., Wang, Y., Guo, J., Xia, Q., Tu, Y., et al. (2021). Compensation benefits allocation and stability evaluation of cascade hydropower stations based on Variation Coefficient-Shapley Value Method. J. Hydrology 599, 126277. doi:10.1016/j.jhydrol.2021.126277
Wang, Y., Liu, Z., Cai, C., Xue, L., Ma, Y., Shen, H., et al. (2022a). Research on the optimization method of integrated energy system operation with multi-subject game. Energy 245, 123305. doi:10.1016/j.energy.2022.123305
Wang, Y., Zhao, Z., and Baležentis, T. (2023b). Benefit distribution in shared private charging pile projects based on modified Shapley value. Energy 263, 125720. doi:10.1016/j.energy.2022.125720
Wang, Y., Liu, Z., Xue, L., Cai, C., and Liu, L. (2022b). A multi-body game-based approach to optimization of integrated energy system operation. Control Theory Appl. 39 (03), 499–508.
Xie, T., and Wang, H. (1984). The complementarity of multiple energy sources according to local conditions. Renewable Energy, 30.
Xu, K., Liu, Z., and Sun, W. (2022). Optimal operation of park-level integrated energy system based on multi-agent cooperative game. Front. Energy Res. 10, 970344. doi:10.3389/fenrg.2022.970344
Yang, K., Ding, Y., Zhu, N., Yang, F., and Wang, Q. (2018). Multi-criteria integrated evaluation of distributed energy system for community energy planning based on improved grey incidence approach: a case study in Tianjin. Appl. energy 229, 352–363. doi:10.1016/j.apenergy.2018.08.016
Yang, P., Jiang, H., Liu, C., Kang, L., and Wang, C. (2023). Coordinated optimization scheduling operation of integrated energy system considering demand response and carbon trading mechanism. Int. J. Electr. Power & Energy Syst. 147, 108902. doi:10.1016/j.ijepes.2022.108902
Keywords: integrated energy system, modified Shapley value method, cooperative games, multi-dimensional index system, nucleolus method
Citation: Wang Y, Cao R, Luo D, Li P and Cheng X (2023) Benefit distribution of integrated regional energy systems under carbon trading mechanisms based on improved Shapley value methods. Front. Energy Res. 11:1265924. doi: 10.3389/fenrg.2023.1265924
Received: 24 July 2023; Accepted: 23 October 2023;
Published: 05 December 2023.
Edited by:
Jianli Zhou, Xinjiang University, ChinaReviewed by:
Shenbo Yang, Beijing University of Technology, ChinaCopyright © 2023 Wang, Cao, Luo, Li and Cheng. This is an open-access article distributed under the terms of the Creative Commons Attribution License (CC BY). The use, distribution or reproduction in other forums is permitted, provided the original author(s) and the copyright owner(s) are credited and that the original publication in this journal is cited, in accordance with accepted academic practice. No use, distribution or reproduction is permitted which does not comply with these terms.
*Correspondence: Yubao Wang, d3liYW9AeGp0dS5lZHUuY24=
Disclaimer: All claims expressed in this article are solely those of the authors and do not necessarily represent those of their affiliated organizations, or those of the publisher, the editors and the reviewers. Any product that may be evaluated in this article or claim that may be made by its manufacturer is not guaranteed or endorsed by the publisher.
Research integrity at Frontiers
Learn more about the work of our research integrity team to safeguard the quality of each article we publish.