 Jinsong Li1
 You Zhou
95% of researchers rate our articles as excellent or good
Learn more about the work of our research integrity team to safeguard the quality of each article we publish.
Find out more
ORIGINAL RESEARCH article
Front. Energy Res. , 12 September 2023
Sec. Sustainable Energy Systems
Volume 11 - 2023 | https://doi.org/10.3389/fenrg.2023.1265516
This article is part of the Research Topic Smart Energy System for Carbon Reduction and Energy Saving: Planning, Operation and Equipments View all 42 articles
Facing towards the Carbon Neutrality goal by 2060, renewable energy sources are boosted in China in the past decade. Either these renewables or power systems are sensitive and vulnerable to natural disasters, such as wildfire and typhoon. In this paper, a fire spot identification algorithm is proposed for wildfire disaster occurred in transmission line corridors based on Fengyun-3E (FY-3E). It mitigates the effect of large observation of solar zenith angle, as well as changes of satellite views, on the infrared channel detection. And cloud information under complex atmospheric conditions is analyzed to extract the cloud pixel fire spot, which decreases false ratio of fire-spot alerts. According to the analysis of hybrid pixel linear spectrums, the fire-spot detection sensitivity of FY-3E is four times as that of geostationary meteorological satellites. The effectiveness of the proposed algorithm was confirmed by an application in the Shanxi province power grid of State Grid in China. It shows that and the FY-3E has a superiority in wildfire monitoring for power system in terms of fire detection sensitivity, spatial range accuracy, and positioning accuracy. Compared to geostationary meteorological satellites, the fire locating accuracy of FY-3E is increased by more than one-fold. This research can assist the operation and maintenance departments of transmission lines to rapidly detect wildfire, thereby reducing the damage of wildfires on the power grid.
Reducing carbon missions and achieving “Carbon Neutrality” requires the developing and utilizing of renewables such as wind power and solar energy on a large scale. In China, the renewable energies are generally oriented in Northwest and offshore regions, the transmission of them requires long-distance transmission lines in areas with dense vegetation, such as forests and grasslands (Anagnostatos et al., 2011; Wang, 2022). In this case, wildfires caused by lightning or industrial and agricultural activities reduce the insulation of overhead transmission line greatly, which induces tripping failures to affect the reliability of power system (Fonseca et al., 1990; El-Zohri et al., 2013; You et al., 2013; Wang et al., 2016). It is necessary to monitor wildfires in transmission corridors and mitigate the threats of wildfire to transmission line operations timely and accurately.
Currently, wildfires in transmission corridors are the primarily monitored by manned patrols, aircraft cruise, visible and infrared image devices, and meteorological satellites (Su et al., 2019). As a vital tool, meteorological satellites offers an inexpensive monitoring capacity of wide area with a high observation frequency (Liang et al., 2020; Zhou et al., 2020). The meteorological satellites can be divided into two types based on their orbits: Polar-orbiting Meteorological Satellites (PMSs) and Geosynchronous Meteorological Satellites (GMSs). The National Oceanic and Atmospheric Administration (NOAA), National Polar-orbiting Operational Environmental Satellite System Preparatory Project (NPP), and Fengyun-3 series (FY-3C, FY-3D) are the commonly used polar-orbiting meteorological satellites. Himawari-8 (H8) and Geo-Kompsat-2A (GK-2A) are examples of geostationary meteorological satellites (Frost and Annegarn, 2007; Blackett, 2015; Zhang et al., 2017; Lu et al., 2018; Chen et al., 2019; Su et al., 2019). The basic performance of these meteorological satellites is compared in Table 1.

TABLE 1. Basic performance of meteorological satellites.
Although the GMSs have an extremely high temporal resolution, there are still lots of missing small fires in transmission line corridors due to the weaker spatial resolution and limited detecting sensitivity. PMSs provide a global wildfire observation by scanning the Earth twice daily with a constant local solar time (Chen et al., 2022b). Besides, the distance between PMSs and Earth are only one-fifth as that of GMSs, causing a higher spatial resolution of PMSs. Artificial fire tests show that the smallest fire area that EOS/MODIS and FY-3D/MERSI-II can identify is approximately 100 m2 (Giglio, 2010; Zheng et al., 2020). However, the transit durations of the PMSs are primarily concentrated in the hours of 9:00–11:00 and 13:00–16:00 in China (Hillger et al., 2013; Yu and Wu, 2016), whereas wildfires often happen at the dusk hours (16:00–19:00), as shown in Figure 1 that the frequency of wildfire during dusk is second only to the afternoon hours in China. The lack of transit monitoring by PMSs might results in missed alerts of wildfires.
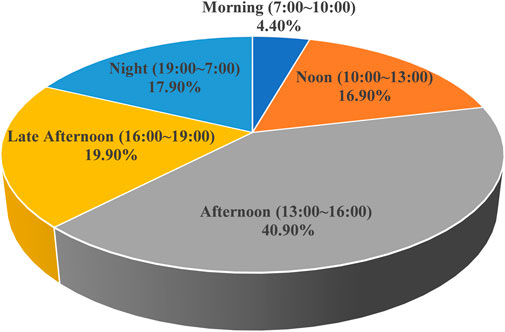
FIGURE 1. Daily statistics of wildfires in China from 2019 to 2021.
Fengyun-3E (FY-3E) has been in operation since March 2022. It is the first operational meteorological satellite to pass over the territory of China during the dawn-dusk hours. Compared to the previous Fengyun series, the detection performance of FY-3E is significantly enhanced by the installation of Medium Resolution Spectral Imager-LL (MERSI-LL) on FY-3E, providing a novel way for monitoring wildfire occurrence at dusk. The National Satellite Meteorological Centre has conducted extensive research on wildfire identification algorithms based on the satellite data of Fengyun-3 series (Shengli and Cheng, 2010; Shan et al., 2021; Chen et al., 2022a). However, differences in spectrometer and monitoring time prevented traditional wildfire identification algorithms from being applied to the FY-3E.
This work proposes a wildfire identification algorithm of the FY-3E/MERSI-LL considering infrared radiation corrections and complex atmospheric conditions of dawn–dusk hours. The impacts of mid-infrared channels of the FY-3E/MERSI-LL, H8/AHI, and GK-2A/AMI on the identification sensitivity of fire spot are compared by using a hybrid pixel linear decomposition method. FY-3E was applied for the monitoring and early warning of wildfires in transmission line corridors for the first time. Engineering practice confirms the effectiveness of the proposed algorithm. And the superiority of FY-3E over H8 and GK-2A PMSs is also compared by engineering application.
FY-3E is the first operational dawn–dusk orbit PMS independently created by China. It was launched at 7:28 p.m. on 5 July 2021 from the Jiuquan Satellite Launch Centre and put into service in March 2022. The launch weight of FY-3E is 2.3t. And its design life is 8 years. The satellite’s orbit has an inclination of 98.75° and a nominal altitude of approximately 836 km. It passes over the ground in China twice a day at 5:30 a.m. and 5:30 p.m. Beijing time. FY-3E is equipped with the newly developed MERSI-LL with seven observation bands which includes a Day Night Band and six thermal infrared bands. The primary technical specifications of MERSI-LL bands are listed in Table 2 (Dong et al., 2022; Xie et al., 2022; Zhang et al., 2022). Two of the infrared split-window bands have a spatial resolution of 250 m, and the remaining bands are of 1000 m resolution. Compared to the H8 and GK-2A GMSs, which are being used extensively for wildfire monitoring in China, FY-3E has an enhanced resolution of the thermal infrared bands.
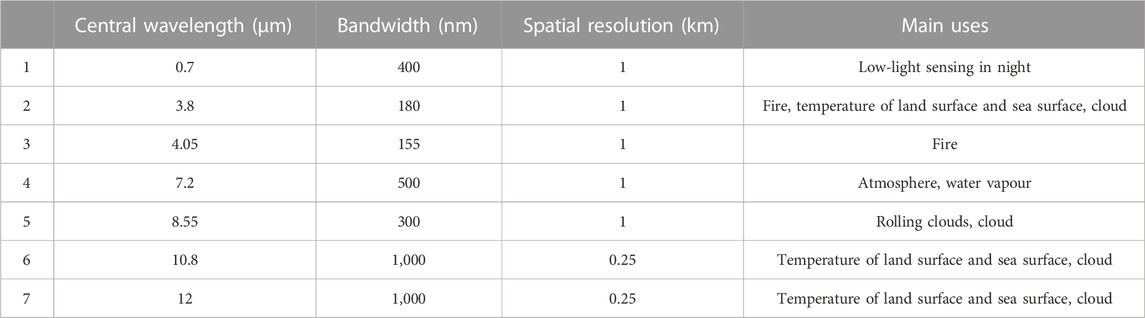
TABLE 2. Major parameters of MERSI-LL bands of FY-3E.
Based on Wien’s displacement law, the black-body radiation curves for peak at different wavelengths that are inversely proportional to the temperatures. The surface radiation at room temperature (approximately 290 K) has a peak wavelength in the 11-μm. And the temperature of forest and grassland wildfire is generally higher than 750 K, the peak wavelength of its spectral radiance is shifted in the short-wave direction closing to the 4-μm mid-infrared band. Therefore, it can detect wildfire in time by comparing the difference between the burning and non-burning radiations in 11-μm and 4-μm bands (Martín et al., 1999; Roy et al., 2013; Wooster et al., 2021; Fan et al., 2022).
The FY-3E/MERSI-LL has a 3.8-μm mid-infrared band with a resolution of 1 km, and 10.8-μm and 12-μm far-infrared bands with resolutions of 250 m. Even with a higher resolution, a pixel of the far infrared bands covers an area with approximately 62,500 m2, which is larger than general forest and grassland fires. Therefore, a pixel covering a wildfire can be considered as a hybrid pixel. According to the linear decomposition method for hybrid pixel, the radiant energy of a hybrid pixel is a linear combination of the radiant energy of the objects. That is, the weighted average of the radiant energy of each object as a proportion of the area.
where Lt is the radiant energy of the hybrid pixel; t is the equivalent blackbody temperature corresponding to the irradiance; ΔSi is the area of the ith subregion in the pixel; LTi is the radiant energy of the ith subregion (in W•m-2•sr−1•μm-1); Ti is the temperature of the ith subregion; and S is the total area of the pixel.
When a wildfire occurred in a region, the temperature and radiant energy of the wildfire region are several hundred times greater than those of other regions. The radiant energy of an pixel containing the wildfire spot can be analyzed by following equation (Dozier, 1981):
where Limix is the radiant energy of the ith bands for the fire spot pixel; P represents the ratio of the wildfire area to the whole pixel area; Lft and Lbg are the radiant energies of the wildfire and the non-fire areas (the background around the wildfire), respectively; Tft and Tbg are the temperatures of the wildfire pixel and background, respectively; λi is the central wavelength of the ith band for the wildfire pixel; C1 = 1.91043 × 10⁸ W μm4 m-2 sr−1, and C2 = 1.438768 × 104 μm K.
The primary criterion for identifying a wildfire is based on whether the brightness temperature of the detected pixel is significantly greater than that of the surrounding pixels. The difference in brightness temperature between the hybrid pixel of the ith band ΔTi, can be expressed as
where Timix is the brightness temperature of the hybrid pixel, and Tbg is the brightness temperature of the background pixels,
Assuming a background temperature of 290 K, a wildfire temperature of 800 K, and the fire area is converted into the wildfire proportion of the pixel, the relationship between the brightness temperature increment of the hybrid pixel in the 3.8-μm and 10.8-μm thermal infrared bands and the area of wildfire region is plotted in Figure 2. The brightness temperature increment of the 3.8-μm and 10.8-μm bands steadily increase as the area of wildfire region. And the difference between two bands also increase. Even a small area of wildfire could increase the brightness temperature of mid-infrared channel considerably. Owing to the high sensitivity of brightness temperature for the mid-infrared band to the wildfire, the brightness temperature differences between the wildfire pixel and the surrounding background pixels in the 3.8-μm channel and 10.8-μm bands can be used to identify the wildfire on the surface of Earth.
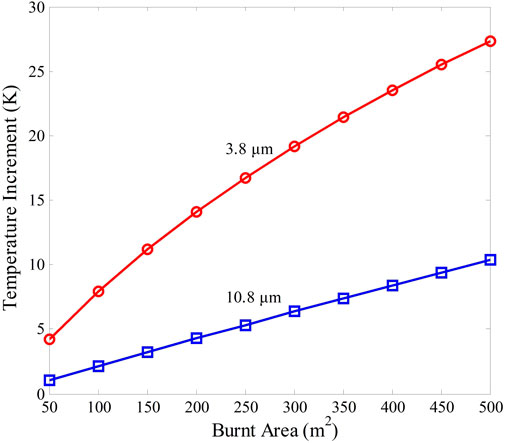
FIGURE 2. Brightness temperature increment of the hybrid pixel for the 3.8-μm and 10.8-μm bands with different fire areas.
The wildfire detection sensitivity of FY-3E with the GMSs H8 and GK-2A was compared by using Eq 3, as shown in Figure 3. It should be notice that the resolution of 3.8-μm mid-infrared band of FY-3E is 1 km whereas those of H8 and GK-2A are 2 km. When the area of wildfire is 80 m2, the area ratio of the wildfire is 0.008% of the whole pixel of the FY-3E whose resolution of the mid-infrared band is 1-km. In this situation, the mid-infrared channel of FY-3E has a brightness temperature increment of approximately 7 K, which exceeds the general identification threshold (6 K). However, brightness temperature increment of the H8 and GK-2A is only 1.8 K. It does not reach the identification threshold until the wildfire area increase to 300 m2. The sensitivity of mid-infrared band of the FY-3E is approximately four times as that of the H8 and GK-2A.
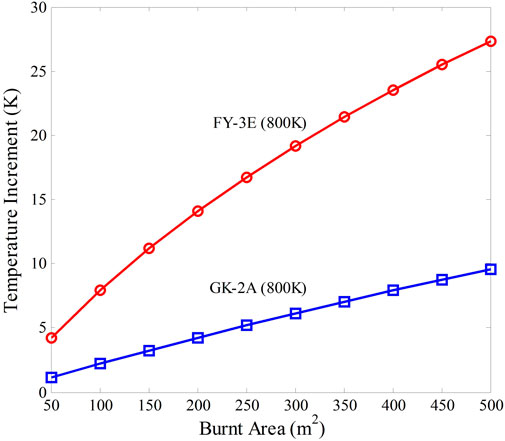
FIGURE 3. Brightness temperature increment for of FY-3E and H8 and GK-2A in the mid-infrared bands.
In this study, based on the wildfire identification principles of EOS/MODIS and FY-3D/MERSI-II (Chen et al., 2022a), an wildfire identification algorithm is proposed for FY-3E. The algorithm comprehensively considers the atmospheric conditions during dawn–dusk hours and the instrument characteristics of FY-3E/MERSI-LL. The influence of large solar zenith angle observation conditions and satellite viewing angles on infrared channel detection data is corrected. And the cloud information as well as the wildfire spot under complex atmospheric conditions are extracted. The flowchart of wildfire identification algorithm of FY-3E is shown as Figure 4.
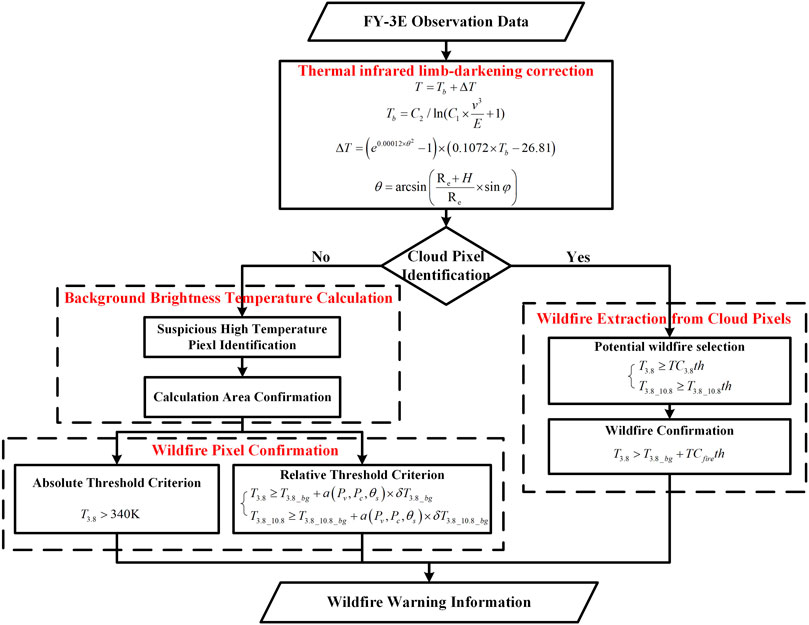
FIGURE 4. Flowchart of FY-3E-based wildfire identification.
Precise acquisition of brightness temperature data in the mid-infrared and far-infrared bands is essential for wildfire identification. Figure 5 shows the normalized radiation curves of Earth emission and solar blackbody reflection. In the figure, λ represents the wavelength of radiation, T is the absolute temperature, B (λ, T) is the Planck function for λ and T, and R is the reflectance. The frequency range of 3.8-μm mid-infrared band is close to the intersection of the Earth emission and solar blackbody reflection curves, whereas the frequency range of 10.8-μm and 12.0-μm far-infrared bands has little solar blackbody reflection. It means that the radiation received by the mid-infrared band would be influenced by the reflection of solar radiation reflected by ground surface during the dawn–dusk period (Matson et al., 1987).
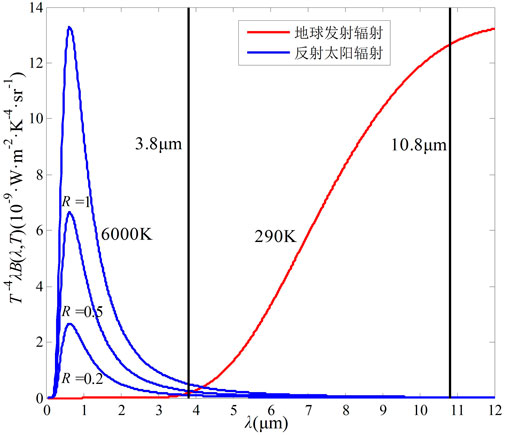
FIGURE 5. Normalized radiation curves of Earth emission and solar blackbody reflection.
Figure 6 gives a schematic diagram of solar blackbody reflection received by satellites.
where R is the original reflectance of the mid-infrared band; R′ is the revised reflectance.
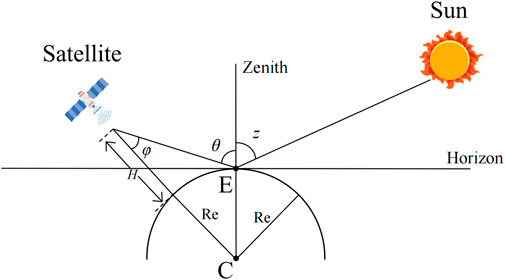
FIGURE 6. Solar blackbody reflection received by satellite.
Since FY-3E was observed during the morning and evening hours, the solar zenith angle is very large and cos(z) is very small, resulting in a large number of oversaturated pixels when using the correction Eq. 4 (Chen et al., 2022b). Based on the observation experience, the correction equation can be revised to be
when the solar zenith angle is close to 90°, the correction ratio of Eq. 4 is about 1/8 of that of Eq. 5, which produces far fewer supersaturated image elements. Operational experience has shown that better observation results can be achieved using this method.
Owing to the effects of the Earth’s curvature and the atmospheric attenuation, the detection data of infrared bands varies depending on the observation angle of the satellite. When the targeted pixel is close to the edge of the satellite’s scanning strip, the radiation reaches the satellite in a very long path, which results in the significant attenuation during the atmospheric propagation.
To eliminate the disparity generated by the satellite’s observation angle, the brightness temperature at the edge of the satellite’s scanning strip needs to be corrected. In this paper, the empirical correction method used in the NESDIS global jigsaw puzzle system is used for correcting the critical dark (Sisong, 1987; Zhong and Yinhai, 1988). The correction formula is expressed as follows
where,
where C1 and C2 are Planck’s constants; E is the radiant flux density; ν is the central wave number of the band,
The identification of fire spots is significantly impacted by cloud coverage. On the one hand, clouds can block the radiation information from wildfires on the ground, resulting in missed identification of wildfires. On the other hand, the specular reflection of solar radiation caused by clouds abnormally increases the brightness temperature, which may bring the wildfire misidentification.
As the observation hours of the FY-3E/MERSI-LL is the dawn–dusk period, no other visible light information can be obtained to aid in the identification of cloud pixels (Platnick et al., 2003). Therefore, the Cloud Mask technique, which is widely used for the MODIS cloud identification, cannot be applied into the FY-3E/MERSI-LL (Frey et al., 2008). In this paper, the radiation temperature data which is measured by both the mid-infrared and far-infrared bands should completely be used to obtain identify the possible cloud pixels. The identification criteria of cloud pixel are presented in Table 3. If any of these criteria is satisfied, the pixel can be identified as a cloud pixel.where,
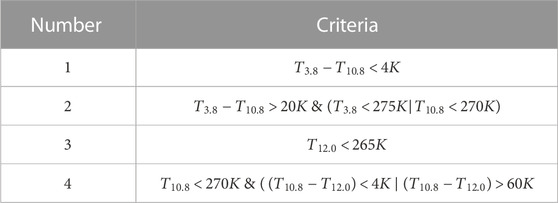
TABLE 3. Criteria for cloud pixel identification.
The brightness temperature calculation of background is critical for identifying wildfires. It is often derived by using the average brightness temperature of pixels around the targeted pixel. However, background brightness temperature would be influenced by the solar radiation reflection caused by clouds and water, the coverage and types of vegetation, and surrounding fires. These influence factors increase the background brightness temperature, which results in the missed identification of wildfires. Therefore, these suspicious high-temperature pixels should be filtered out before background brightness temperature calculation.
Kaufman et al. (1998) used the standard deviation of background brightness temperature to identify a fire spot, which effectively address the problem of over-calculating the background brightness temperature. The approach used in this study to identify suspicious high-temperature pixels is as follows: Firstly, the top 20% of high-temperature pixels in the monitoring region are chosen as pixels to be recognized. Then, each pixel should be identified successively by using formula (10)
where
After removing the suspicious high temperature pixels and cloud pixels, the remaining pixels are used to calculate the background brightness temperature information, which includes the average value, as well as the differences of the brightness temperature in the 3.8-μm and the 10.8-μm band. The size of the pixels involved in the calculation of the background brightness temperature is calculated according to the window method. Firstly, valid 5
The wildfire occurrence of the pixel is confirmed after the calculation of the background brightness temperature. Both absolute and relative threshold criteria are used. The absolute threshold criterion is to compare the brightness temperature of pixels with the predetermined threshold. And the relative threshold criteria are to compare the brightness temperature of the targeted pixel to that of the background pixels in the 3.8-μm band, or to compare the brightness temperature difference between the 3.8-μm and 10.8-μm bands of the targeted pixel to that of the background pixels.
Specifically, if a targeted pixel satisfies the criterion (10) or (11), it can be confirmed as a wildfire pixel. These criteria are more stringent than those of MODIS and FY-3D (Chen et al., 2022a) because of the sizable solar zenith angle non-visible light adjustment throughout the observation period of FY-3E.
where
Traditional fire spot identifications generally skip the procedure of extracting wildfire spots from cloud pixels (Zhong and Yinhai, 1988; Platnick et al., 2003; Giglio, 2010; Zheng et al., 2020), which may mis-identify parts of wildfires. If the thickness of clouds is thin, a certain amount of radiation energy of wildfire is able to pass through the clouds and reach the satellite, providing a necessary condition for wildfire identification. This study proposes a wildfire identification approach under thin cloud condition with following steps.
1) Potential wildfire selection
A cloud pixel is identified as a potential wildfire pixel when it satisfies the criteria.
where
2) Wildfire confirmation
The potential wildfire pixel is confirmed as a wildfire pixel if its brightness temperature satisfies the criterion.
where
The proposed FY-3E satellite-based wildfire monitoring algorithm has been used in the Shanxi province power grid of State Grid in China since March 2022. It is capable of providing early warning and precise localization of wildfire occurrences. Combined with the coordinate information of transmission lines, it is also able to analyze the danger level of the wildfire to the power system. In this section, two typic wildfire cases were analyzed. And the infrared multispectral data between FY-3E and GMS H8 or GK-2A were compared in the early stage of wildfire occurrences to verify the advantages of FY-3E in the detecting sensitivity as well as the spatial and location accuracy.
A wildfire was monitored by FY-3E in Datong City, Shanxi Province, at 16:50 on 30 March 2022. The warning information shows that the location of wildfire was 114.0406°E, 40.4001°N, where is 1.4 km from the 220 kV GY transmission line, and 3 km from five other 220 kV transmission lines, as shown in Figure 7A. Field personnel verified that the actual position of the wildfire was approximately 300 m from the 220 kV GY line, as shown in Figure 7B. Meanwhile, the GMS H8 also detected the wildfire occurrence. However, the warning time of H8 started at approximately 17:00 which was 10 min later than that of FY-3E.
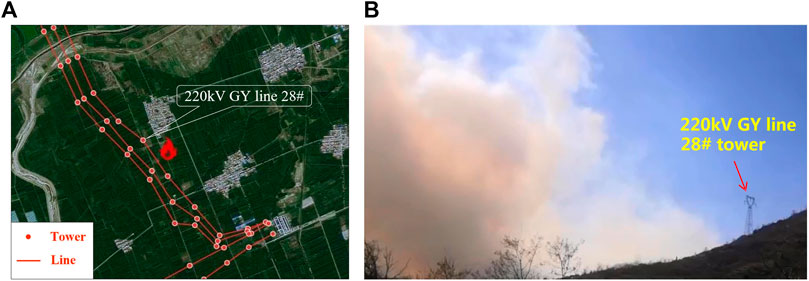
FIGURE 7. (A). Wildfire location and surrounding transmission line; (B). On-site wildfire investigation in Datong city.
Figure 8 shows a synthesized RGB image of the 3.8, 10.8 and 12-μm infrared bands of FY-3E for the Datong wildfire at 16:50. The red area in the image represents the warning wildfire location which has two pixels, whereas the yellow cross represents the actual location of the wildfire by on-site confirmation. Contrastively, the synthesized RGB images of the 3.8, 0.26, 0.64-μm infrared bands of H8 for the same region at 16:50 and 17:00, separately as shown in Figure 9. It is obvious that the synthesized RGB image of H8 at 16:50 shows little temperature increment at the wildfire location. But at the same time, two temperature abnormal pixels were observed by FY-3E. It was not until 17:00 that GMS H8 observed an unusual brightness temperature at this location with one pixel size.
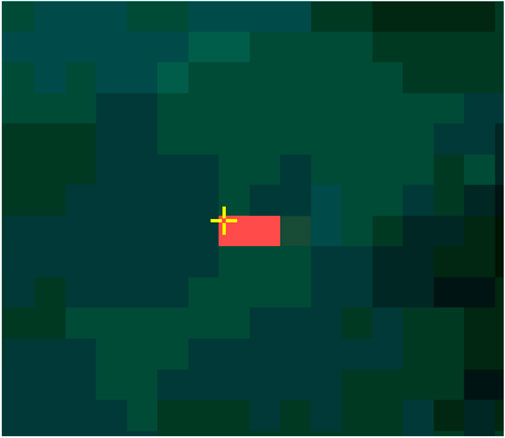
FIGURE 8. RGB composite image of Datong wildfire at 16:50 provided by FY-3E.
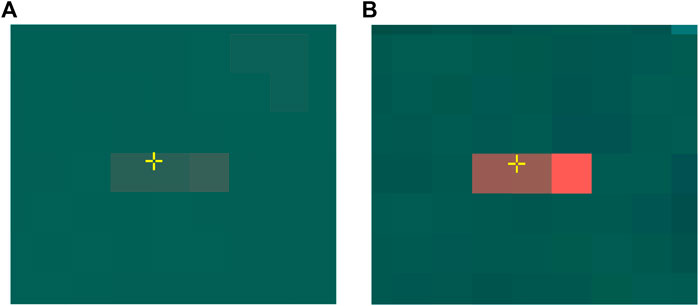
FIGURE 9. RGB composite images of Datong wildfire provided by H8. (A) 2022-3-30 16:50; (B) 2022-3-30 17:00.
The brightness temperature of mid-infrared 3.8-um band for FY-3E and H8 in the wildfire pixels from 16:50 to 17:20 are listed in Figure 10. The brightness temperature of wildfire pixel observed by FY-3E at 16:50 was 322.8 K. It has a difference of 27.1 K from the background brightness temperature, considerably exceeding the identification threshold for the wildfire monitoring. In the contrast, the brightness temperature of pixel observed by H8 was 289.77 K at 16:50, only 0.8 K higher than that of background. The negligible difference of the brightness temperature did not achieve the identification threshold leading to the misidentification of the wildfire at that time. As the wildfire grew intensively, the brightness temperature of H8 increased to 297.92 and 296.11 K at 17:00 and 17:10, respectively. The brightness temperature differences increased to 8.42 and 6.45 K. As a result, H8 issued a wildfire warning at 17:00. But even at this moment, the bright temperature difference between the pixels observed by H8 is much lower than that observed by FY-3E 10 min earlier, indicating FY-3E exhibits a significant higher sensitivity in wildfire detection than H8.
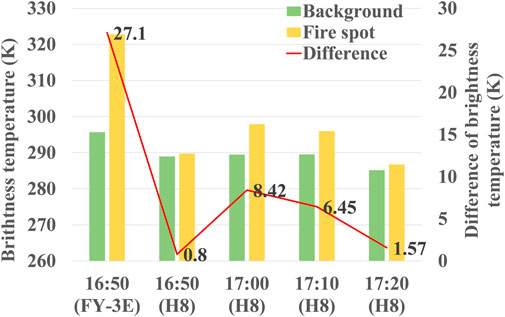
FIGURE 10. Brightness temperatures of mid-infrared 3.8-um band for FY-3E and H8 in the Datong wildfire area.
In Figure 8, the two pixels for wildfire monitored by FY-3E covers an area of approximately 2 km2. And the satellite-positioned location of the wildfire, which means the geometric center of the pixels, is about 1.12 km away from the actual location of the wildfire (yellow cross). As shown in Figure 9B, GMS H8 monitored a single fire pixel. But the spatial resolution of the pixel is 2 × 2 that covers an area of 4 km2. And the distance between the satellite-positioned location and the actual location of the wildfire is approximately 3.25 km, which is as 3 times as that located by FY-3E. Table 4 displays the specific warning information for FY-3E and H8.
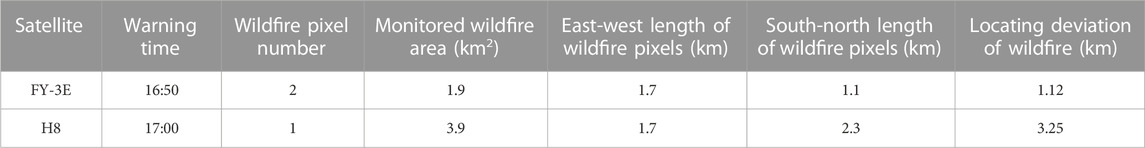
TABLE 4. Datong wildfire warning information of FY-3E and H8.
On 7 April 2022, FY-3E detected a wildfire in Shuozhou City, the north of Shanxi Province, at 17:50. As shown in Figure 11, the distance of the warning wildfire zone is less than 500 m from the 500 kV MXI transmission line. Comparatively, GMS GK-2A issue a wildfire warning 18:15, which is 25 min later than FY-3E.
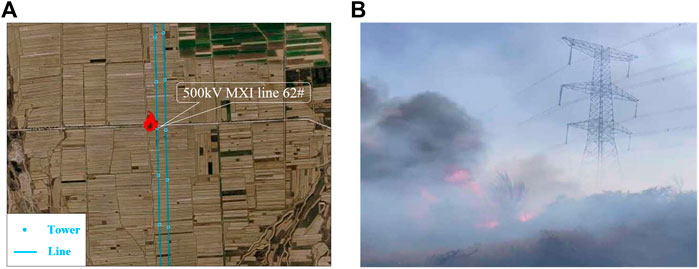
FIGURE 11. (A). Wildfire location and surrounding transmission line; (B). On-site wildfire investigation in Shuozhou city.
Figure 12 shows the 3.8-μm mid-infrared images when the wildfire was first identified by FY-3E and GK-2A, respectively. Herein, the whiter color indicates the higher brightness temperature of the pixels. And the red boxed area is the final waring pixel of the wildfire. FY-3E has a greater spatial precision than GK-2A. The area of the wildfire identified by FY-4E is 1 km2, which is 1/4 of that identified by GK-2A. Moreover, the mid-infrared image of FY-3E contains more detailed brightness temperature information. The brightness temperature of the 3.8-μm mid-infrared channels of FY-3E and GK-2A are compared, as shown in Figure 13. At 17:50, the brightness temperature of wildfire pixel observed by FY-3E was 312.9 K. It has a difference of 8.8 K from the background temperature. However, the brightness temperature of GK-2A was 297.0 K at this time, only 5.6 K than the surrounding background brightness temperature. However, the small brightness temperature increment did not trigger the warning threshold of GK-2A. Until 18:15, the brightness temperature increment increased to 6.1 K, which is higher than the warning threshold of GK-2A. Therefore, GK-2A issued the wildfire warning 25 min later than FY-3E did.
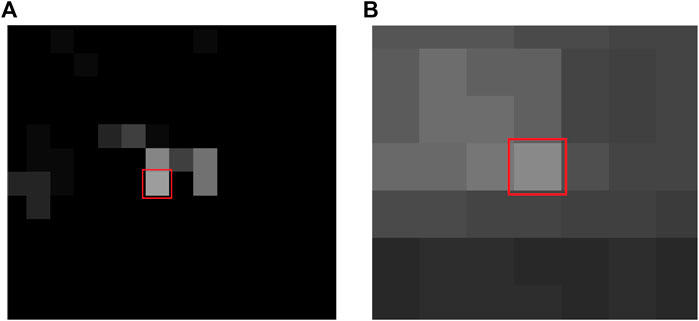
FIGURE 12. 3.8-μm mid-infrared image of Shuozhou wildfire provided by (A) FY-3E at 2022-4-7 17:50 and (B) GK-2A at 2022-4-7 18:15.
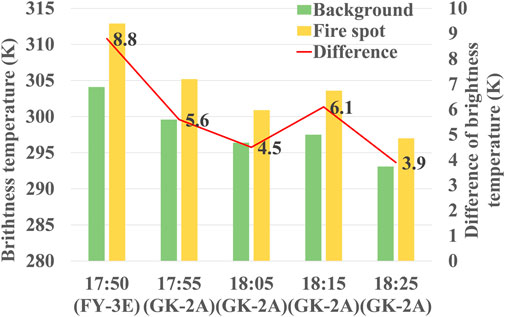
FIGURE 13. Brightness temperatures of mid-infrared 3.8-um band for FY-3E and H8 in the Shuozhou wildfire area.
Monitoring of wildfire disaster, especially at the extreme weather, is the key to operation governance for electric power system. Based on the world’s first operational dawn–dusk orbiting PMS FY-3E, this study proposed a wildfire monitoring algorithm to early warn wildfires in transmission line corridors. The following technical contributions can be achieved.
1) The proposed algorithm eliminated the adverse effects of large solar zenith angle and differences in satellite viewpoints on the data of infrared band by solar zenith angle correction and thermal infrared limb-darkening correction. And it realized cloud information extraction and wildfire identification from cloud pixels under complex atmospheric conditions, reducing the influence of clouds on false alarms and missed alarms of wildfires.
2) Linear spectral separation analysis of the hybrid images shows that the wildfire detection sensitivity of FY-3E is about 4 times higher than that of the H8 and GK-2A, which can significantly improve the detection capability of smaller wildfires in transmission line corridors.
3) The proposed FY-3E-based wildfire monitoring algorithm has been applied in China’s Shanxi Power Grid. The application experience demonstrates that the FY-3E-based algorithm has obvious advantages in terms of the detecting sensitivity, as well as the spatial and localization accuracy, compared to that of GMSs H8 and GK-2A. The wildfire positioning accuracy of FY-3E can be improved by more than one times.
It should be noted that, although FY-3E has higher sensitivity and localization accuracy in detecting wildfires, it has a very low frequency of monitoring, bringing the monitoring limitations in wildfires with short duration and rapid changes. And FY-3E is also unable to monitor the development of wildfire continuously and dynamically. In order to meet the requirements of high accuracy and timeliness of wildfire monitoring in transmission corridors, the subsequent study will combine the use of FY-3E and GK-2A, H8 through data fusion technologies to further enhance the effect of satellite remote sensing wildfire monitoring. On the other hand, although this paper proposes a method for wildfire identification under thin cloud conditions, cloud cover is still the main reason for the missed monitoring of wildfires. Therefore, how to effectively combine satellite monitoring with multiple technical methods such as helicopters, drones, manual patrols and fixed monitoring devices to realize complementary advantages is the future direction to enhance the monitoring and warning capability of wildfires on power grid transmission lines.
The raw data supporting the conclusion of this article will be made available by the authors, without undue reservation.
JL: Conceptualization, Methodology, Writing–original draft, Formal Analysis. JC: Writing–original draft, Project administration, Resources. HY: Writing–review and editing, Methodology. MJ: Writing–review and editing, Validation. ZL: Writing–review and editing, Supervision. YZ: Writing–review and editing, Data curation, Methodology. SW: Validation, Writing–review and editing. JF: Supervision, Writing–review and editing.
The author(s) declare financial support was received for the research, authorship, and/or publication of this article. The research was funded by the Science and technology projects funded by National Key Research and Development Program of China for supporting this research under Contract No. 2021YFC3000300, and by State Grid Shanxi Electric Power Company Technology Project under Contract No. 52053023000D.
The authors declare that this study received funding from State Grid Shanxi Electric Power Company The funder had the following involvement in the study: collection and interpretation of data.
The authors declare that the research was conducted in the absence of any commercial or financial relationships that could be construed as a potential conflict of interest.
All claims expressed in this article are solely those of the authors and do not necessarily represent those of their affiliated organizations, or those of the publisher, the editors and the reviewers. Any product that may be evaluated in this article, or claim that may be made by its manufacturer, is not guaranteed or endorsed by the publisher.
Anagnostatos, S. D., Halevidis, C. D., Polykrati, A. D., Koufakis, E. I., and Bourkas, P. D. (2011). High-Voltage lines in fire environment. IEEE Trans. Power Deliv. 26 (3), 2053–2054. doi:10.1109/TPWRD.2011.2123471
Blackett, M. (2015). An initial comparison of the thermal anomaly detection products of MODIS and VIIRS in their observation of Indonesian volcanic activity. Remote Sens. Environ. 171, 75–82. doi:10.1016/j.rse.2015.10.002
Chen, J., Yao, Q., Chen, Z., Li, M., Hao, Z., Liu, C., et al. (2022a). The fengyun-3D (FY-3D) global active fire product: principle, methodology and validation. Earth Syst. Sci. Data. 14 (8), 3489–3508. doi:10.5194/essd-14-3489-2022
Chen, J., Zheng, W., Wu, S., Liu, C., and Yan, H. (2022b). Fire monitoring algorithm and its application on the geo-kompsat-2A geostationary meteorological satellite. Remote Sens. 14 (11), 2655. doi:10.3390/rs14112655
Chen, W., Zhou, Y., Chen, J., Zhou, E., Zhou, W., and Sui, S. (2019). “Wildfire monitoring technology of transmission lines based on himawari-8 geostationary meteorological satellite,” in 2019 IEEE 3rd Conference on Energy Internet and Energy System Integration (EI2), Changsha, China, 08-10 November 2019, 2408–2412. doi:10.1109/EI247390.2019.9061748
Dong, C., Weng, F., and Yang, J. (2022). Assessments of cloud liquid water and total precipitable water derived from FY-3E MWTS-III and NOAA-20 ATMS. Remote Sens. 14 (8), 1853. doi:10.3390/rs14081853
Dozier, J. (1981). A method for satellite identification of surface temperature fields of subpixel resolution. Remote Sens. Environ. 11, 221–229. doi:10.1016/0034-4257(81)90021-3
El-Zohri, E. H., Abdel-Salam, M., Shafey, H. M., and Ahmed, A. (2013). Mathematical modeling of flashover mechanism due to deposition of fire-produced soot particles on suspension insulators of a HVTL. Electr. Power Syst. Res. 95, 232–246. doi:10.1016/j.epsr.2012.09.009
Fan, X., Pang, X., and Feng, H. (2022). Design of multi-data sources based forest fire monitoring and early warning system. Big Data – BigData 2022, 35–51. doi:10.1007/978-3-031-23501-6_5
Fonseca, J. R., Tan, A. L., Silva, R. P., Monassi, V., Assuncao, L. A. R., Junqueira, W. S., et al. (1990). Effects of agricultural fires on the performance of overhead transmission lines. IEEE Trans. Power Deliv. 5 (2), 687–694. doi:10.1109/61.53071
Frey, R. A., Ackerman, S. A., Liu, Y., Strabala, K. I., Zhang, H., Key, J. R., et al. (2008). Cloud detection with MODIS. Part I: improvements in the MODIS cloud Mask for collection 5. J. Atmos. Ocean. Technol. 25 (7), 1057–1072. doi:10.1175/2008JTECHA1052.1
Frost, P., and Annegarn, H. (2007). “Providing satellite-based early warnings of fires to reduce fire flashovers on South Africa’s transmission lines,” in 2007 IEEE International Geoscience and Remote Sensing Symposium, Barcelona, Spain, 23-28 July 2007, 2443–2446. doi:10.1109/IGARSS.2007.4423336
Giglio, L. (2010). MODIS collection 5 active fire product user’s guide version 2.4, science systems and applications. Maryland: University of Maryland.
Hillger, D., Kopp, T., Lee, T., Lindsey, D., Seaman, C., Miller, S., et al. (2013). First-light imagery from suomi NPP VIIRS. Bull. Am. Meteorological Soc. 94 (7), 1019–1029. doi:10.1175/BAMS-D-12-00097.1
Kaufman, Y. J., Kleidman, R. G., and King, M. D. (1998). SCAR-B fires in the tropics: properties and remote sensing from EOS-MODIS. J. Geophys. Res. Atmos. 103 (D24), 31955–31968. doi:10.1029/98JD02460
Liang, Y., Zhou, L., Chen, J., Huang, Y., Wei, R., and Zhou, E. (2020). Monitoring and risk assessment of wildfires in the corridors of high-voltage transmission lines. IEEE Access 8, 170057–170069. doi:10.1109/ACCESS.2020.3023024
Lu, J., Liu, Y., Zhang, G., Li, B., He, L., and Luo, J. (2018). Partition dynamic threshold monitoring technology of wildfires near overhead transmission lines by satellite. Nat. Hazards 94 (3), 1327–1340. doi:10.1007/s11069-018-3479-5
Martín, M. P., Ceccato, P., Flasse, S., and Downey, I. (1999). Fire detection and fire growth monitoring using satellite data. Berlin, Heidelberg: Springer Berlin Heidelberg.
Matson, M., Stephens, G., and Robinson, J. (1987). Fire detection using data from the NOAA-N satellites. Int. J. Remote Sens. 8 (7), 961–970. doi:10.1080/01431168708954740
Platnick, S., King, M. D., Ackerman, S. A., Menzel, W. P., Baum, B. A., Riedi, J. C., et al. (2003). The MODIS cloud products: algorithms and examples from terra. IEEE Trans. Geoscience Remote Sens. 41 (2), 459–473. doi:10.1109/TGRS.2002.808301
Roy, D. P., Boschetti, L., and Smith, A. M. S. (2013). “Satellite remote sensing of fires,” in Fire phenomena and the earth system: An interdisciplinary guide to fire science. Editor C. M. Belcher (John Wiley & Sons), 77–93.
Shan, T., Zheng, W., Chen, J., and Tang, S. (2021). A burned area mapping method for the FY-3D MERSI based on the single-temporal L1 data and multi-temporal daily active fire products. Int. J. Remote Sens. 42 (4), 1292–1310. doi:10.1080/01431161.2020.1826064
Shengli, W., and Cheng, L. (2010). “A new model for fire forecast,” in Proc. SPIE 7831, earth resources and environmental remote sensing/GIS applications. Editors U. Michel, and D. L. Civco (SPIE), 184–189. doi:10.1117/12.865533
Sisong, Z. (1987). The application of avhrr data to estimating the earth-atmosphere radiation budget of the qinghai-xizang plateau. Atmos. Radiat., 139–144. doi:10.1007/978-1-935704-18-8_23
Su, H., Sun, M., and Shang, J. (2019). “Research on stereoscopic monitoring and positioning technology of mountain fire in EHV transmission lines,” in 2019 IEEE 3rd International Electrical and Energy Conference (CIEEC), Beijing, China, 07-09 September 2019, 222–227. doi:10.1109/CIEEC47146.2019.CIEEC-2019115
Wang, C.-H. (2022). Bushfire and climate change risks to electricity transmission networks. Cham: Springer International Publishing.
Wang, Y., Chen, C., Wang, J., and Baldick, R. (2016). Research on resilience of power systems under natural disasters—a review. IEEE Trans. Power Syst. 31 (2), 1604–1613. doi:10.1109/TPWRS.2015.2429656
Wooster, M. J., Roberts, G. J., Giglio, L., Roy, D. P., Freeborn, P. H., Boschetti, L., et al. (2021). Satellite remote sensing of active fires: history and current status, applications and future requirements. Remote Sens. Environ. 267, 112694. doi:10.1016/j.rse.2021.112694
Xie, L., Wu, S., Chen, J., Zheng, W., Yan, H., and Xu, Z. (2022). Cross-Comparison of channel parameters between FY-3E/MERSI-LL and Himawari-8/AHI in China. Int. J. Remote Sens. 43 (12), 4663–4681. doi:10.1080/01431161.2022.2116297
You, F., Zhang, Y., Chen, H.-x., Zhang, L.-h., Zhu, J.-p., and Zhou, J.-j. (2013). Preliminary studies on flashovers of high-voltage transmission lines induced by wildfires by field survey and experimental tests. Procedia Eng. 52, 557–565. doi:10.1016/j.proeng.2013.02.185
Yu, F., and Wu, X. (2016). Radiometric inter-calibration between himawari-8 AHI and S-NPP VIIRS for the solar reflective bands. Remote Sens. 8 (3), 165. doi:10.3390/rs8030165
Zhang, P., Hu, X., Lu, Q., Zhu, A., Lin, M., Sun, L., et al. (2022). FY-3E: the first operational meteorological satellite mission in an early morning orbit. Adv. Atmos. Sci. 39 (1), 1–8. doi:10.1007/s00376-021-1304-7
Zhang, W., Yu, H., Yan, Z., and Xu, J. (2017). “Study on disaster monitoring technology of mountain fire based on UAV transmission line inspection,” in 2017 IEEE International Conference on Unmanned Systems (ICUS), Beijing, China, 27-29 October 2017, 400–403. doi:10.1109/ICUS.2017.8278377
Zheng, W., Chen, J., Yan, H., Liu, C., and Tang, S. (2020). Global fire monitoring products of FY-3D/MERSI-II and their applications. J. Remote Sens. 24 (5), 521–530. doi:10.11834/jrs.20209177
Zhong, Q., and Yinhai, L. (1988). Satellite observation of surface albedo over the qinghai-xizang plateau region. Adv. Atmos. Sci. 5 (1), 57–65. doi:10.1007/BF02657346
Zhou, F., Ma, Y., and Wang, H. (2020). “Research on transmission line fire monitoring technology based on remote sensing satellite data,” in 2020 International Conference on Urban Engineering and Management Science (ICUEMS), Zhuhai, China, 24-26 April 2020, 314–317. doi:10.1109/ICUEMS50872.2020.00075
Keywords: Fengyun-3E, transmission lines fires, fire spot identification, dawn-dusk monitoring, satellite remote sensing
Citation: Li J, Chen J, Yu H, Jiang M, Lu Z, Zhou Y, Wang S and Fan J (2023) Wildfire monitoring technologies of transmission line corridors based on Fengyun-3E satellite imaging. Front. Energy Res. 11:1265516. doi: 10.3389/fenrg.2023.1265516
Received: 23 July 2023; Accepted: 24 August 2023;
Published: 12 September 2023.
Edited by:
Zhengmao Li, Aalto University, FinlandReviewed by:
Minglei Bao, Zhejiang University, ChinaCopyright © 2023 Li, Chen, Yu, Jiang, Lu, Zhou, Wang and Fan. This is an open-access article distributed under the terms of the Creative Commons Attribution License (CC BY). The use, distribution or reproduction in other forums is permitted, provided the original author(s) and the copyright owner(s) are credited and that the original publication in this journal is cited, in accordance with accepted academic practice. No use, distribution or reproduction is permitted which does not comply with these terms.
*Correspondence: Jie Chen, Y2hlbmppZUBjbWEuZ292LmNvbQ==
Disclaimer: All claims expressed in this article are solely those of the authors and do not necessarily represent those of their affiliated organizations, or those of the publisher, the editors and the reviewers. Any product that may be evaluated in this article or claim that may be made by its manufacturer is not guaranteed or endorsed by the publisher.
Research integrity at Frontiers
Learn more about the work of our research integrity team to safeguard the quality of each article we publish.