 Zhun Rong1
 Xianwei Dai
95% of researchers rate our articles as excellent or good
Learn more about the work of our research integrity team to safeguard the quality of each article we publish.
Find out more
ORIGINAL RESEARCH article
Front. Energy Res. , 25 August 2023
Sec. Process and Energy Systems Engineering
Volume 11 - 2023 | https://doi.org/10.3389/fenrg.2023.1264804
This article is part of the Research Topic Mechanisms and Applications of Coupled Technologies in Unconventional Resources for Enhancing Oil/Gas Recovery View all 5 articles
The development of high-efficiency polycrystalline diamond compact (PDC) bits plays a major role in developing unconventional oil and gas. Thereby, a series of single cutter tests have been conducted in the past few years. However, most of them were performed under atmosphere conditions due to the limitation of the experimental setup. In the present study, a series of single cutter experiments were performed under pressurized conditions, in which both principal stress and hydrostatic pressures were loaded with a self-developed facility. The cutting force, topography of cutting grooves, and mechanical specific energy (MSE) were analyzed to evaluate rock failure efficiency. Furthermore, a theoretical model was developed to study stress evolution. Combined with experimental results, the rock failure mechanism and the effects of bottom hole pressures on rock breaking characteristics were revealed. The results indicate that the increase in principal stress and hydrostatic pressures cause larger cutting forces and reduced rock cutting efficiency. Additionally, a larger hydrostatic pressure will promote the propagation of subsurface cracks, leading to larger roughness of cutting grooves and facilitating the subsequent rock cutting process. In this study, the hydrostatic pressure has the greatest impact on rock failure process, followed by the principal stress when parallel to the cutting direction. Comparing the experimental and simulation results, we can find that only a fraction of cutting force is directly utilized in breaking rocks, while the remaining force is applied to overcome the friction induced by the flow of cuttings along the cutter surface. Consequently, measures should be taken to prevent bit balling and decrease the friction force, thus weakening the effects of hydrostatic pressures and improving the efficiency of PDC bits.
Polycrystalline diamond compact (PDC) bits have steadily gained favor since their first introduction in the 1970s (Dai et al., 2020a). In 2010, their footage exceeds that of tri-cone bits, and presently, PDC bits are utilized in over 90% of oil and gas wells worldwide (Cheng et al., 2019a). Furthermore, continual improvements to the performance of PDC bits have been driven by innovation in material, geometry, and the arrangement of cutters (Zhu et al., 2022).
Guiding the future development and optimization of PDC bits depends on uncovering the mechanism of rock-cutter interaction during drilling. However, the complexity of realistic field conditions, e.g., the vibration of bits, the cross-affect among different cutters, and the multiple moving directions of cutters make it difficult to investigate rock cutting mechanisms directly (Chen et al., 2016; Che et al., 2017). As a consequence, a great number of single PDC cutter tests were performed in previous studies, in which the effects of cutting parameters and formation conditions on rock failure efficiency were evaluated (Rafatian et al., 2009; Rostamsowlat, 2018; Rostamsowlat et al., 2018). Meanwhile, the evolution of cracks and stress was determined to reveal the rock failure mechanism (Jaime, 2011; Jaime et al., 2015; Cheng et al., 2019b).
Based on the results of previous research, the cutting depth and back rake angles have more pronounced influences on rock failure characteristics in comparison with other parameters. The increase in the depth of cut causes a transition in rock failure modes (He and Xu, 2016; Zhou et al., 2017; Liu et al., 2018; Dai et al., 2021a). That is, ductile failure dominates the rock cutting process and the generated cuttings shows a fine powder form at small cutting depths. Meanwhile, the cutting force is proportional to the cutting depth, and the mechanical specific energy (MSE) remains constant. Once the cutting depth exceeds a specific value that depends on rock properties, brittle failure occurs. Correspondingly, chunk-like cuttings generates, cutting force increases more slowly, and the MSE starts to decrease. These characteristics can serve as important indexes for determining the critical depth. Some scholars also concluded that the failure of cutters changes from abrasive wear to impact wear with increasing cutting depth (Mazen et al., 2020; Mazen et al., 2021). Resulted from a larger rock-cutter interaction area and the variation of ratio between the cutting force and the normal force, a greater back rake angle would diminish the rock cutting efficiency and aggressive of cutters (Rajabov et al., 2012; Cheng et al., 2018). However, some scholars reported that the increase in back rake angles is accompanied by a higher rock penetration efficiency (Dai et al., 2020b; Dai et al., 2021c). Therefore, a trade-off should be made between cutting efficiency and penetration efficiency when selecting the back rake angles.
At present, most studies were performed under atmosphere conditions due to the restriction of experimental apparatus, which has unfavorable impacts on the optimization of rock cutting parameters. To address such an issue, the University of Tulsa developed a novel experimental setup capable of conducting rock cutting tests under simulated downhole pressures (Rafatian et al., 2010; Akbari et al., 2014). This facility can separately or simultaneously load the confining pressure to the side surfaces of cylinder rocks, the borehole pressure to the top surface of samples, and the pore pressure acting on the pore space of rocks. A series of experiments were performed utilizing this apparatus. The results indicate that the MSE can increase by more than 3 times as the confining pressure and borehole pressure rises from 0 psi to 950 psi, meaning an obvious decrease in rock cutting efficiency (Rafatian et al., 2010). Correspondingly, the topography of cuttings varies from chunk-like to ribbon-shaped. Moreover, the cuttings accumulates ahead of the cutter and moves along the cutter surface, rather than splash away at atmosphere conditions (Rahmani et al., 2012; Sheikhrezaei and Taleghani, 2017). These studies suggest that further insight into the influences of realistic downhole pressures on rock failure characteristics is required to optimize the arrangement of PDC cutters.
In recent years, the rapidly increasing computation power of computers makes it more convenient and cost-effective to analyze rock failure characteristics. Several theoretical models and calculation methods such as the finite element method (FEM), discrete element method (DEM), and the combination of both (FDEM), have been developed to evaluate the evolution of stress in rocks and reveal the mechanism of rock-cutter interaction. The development of commercial software further facilitates calculation efficiency and decreases the modeling difficulty. Among these methods, FEM and DEM have specific advantages in determining the distribution of stress and the propagation of cracks in rocks, respectively (Huang and Detournay, 2013; Jaime et al., 2015; Gao et al., 2020; Xi et al., 2023). Based on simulation results, some scholars proposed that the loading of confining pressures results in an overall increase in the cutting force. Meanwhile, cracks cease to propagate after the confining pressure surpasses 15 MPa (Li et al., 2016). Yin et al. (2014) monitored the initiation and propagation of cracks during the penetration process of TBM cutters. The results indicate that the angle of lateral cracks decreases once the confining pressure exceeds a critical value, which is related to the rock strength. At this moment, the volumetric breakage of rocks is limited, thus resulting in lower rock failure efficiency.
Meanwhile, a series of theoretical models have been developed to investigate the effects of different pressures on rock failure characteristics. Compared to commercial software, these models significantly simplify the problem and speed up the calculation by making some reasonable assumption (Detournay and Atkinson, 2000; Chen et al., 2018; Chen et al., 2021b; Xiong et al., 2021). During the analysis process, the effects of downhole conditions, such as the in-situ stress, the hydrostatic pressure, and the rock temperatures can be more easily and freely considered by employing different boundary setups and loading pre-stresses in rocks. According to the analytic solution of stress distribution subjected to a concentration force, some scholars calculated the stress evolution in rocks and predicted the cutting force (Cheng et al., 2019a; Xiong et al., 2021). In these studies, the influences of downhole pressures and thermal stresses were analyzed by superimposing different stress fields. Additionally, Chen et al. modeled the cutting process of a single cuter, two cutters, and the whole bit based on the theory of linear poroelasticity (Chen et al., 2019; Chen et al., 2021a; Chen et al., 2021b). In their models, the rock failure efficiency under different cutting parameters (cutting speed, back rake angles, etc.), formation conditions (confining pressure, hydrostatic pressure, etc.), and the characteristic of cutters (the wear and chamfer of the cutter) were studied, and the accuracy was validated through experimental results.
In conclusion, downhole pressurized conditions have significant impacts on the rock cutting process. Some studies have investigated these effects and drawn valuable conclusions. However, the restriction of facility limits the further experimental studies and the calibration of theoretical models. In the present study, a novel facility is developed to analyze the effects of in-situ stress and hydrostatic pressure on rock failure characteristics. The cutting force, MSE, and the topography of cutting grooves are captured to evaluate rock failure efficiency. Meanwhile, a theoretical model is established to calculate the stress evolution and reveal the rock failure mechanism under different conditions. The results of this study provide an in-depth understanding of rock cutting process under downhole pressurized conditions.
To investigate the rock failure mechanism under pressurized conditions, a novel experimental facility was developed. As shown in Figure 1, this facility mainly includes three parts: the control system, high-pressure generation system, and rock cutting system. The first part can control the movement of PDC cutters and monitor the fluctuation of cutting force with a sampling rate of up to 50 kHz. The high-pressure generation system is capable of producing a confining pressure and hydrostatic pressure with a maximum value of 50 MPa and 30MPa, respectively. The former is loaded by 3 separate pumps to change the overburden pressure on the top surface of rocks and confining pressure on four side surfaces of samples. Meanwhile, a hydrostatic pump is applied to simulate the pressurized condition resulted from the drilling fluid. The core component of this facility is the rock cutting system, which can produce a maximum cutting force of 10 kN through a motor. By changing the rotary speed of the motor, the moving velocity can vary from 1.6 mm/s to 230 mm/s. We machined a series of PDC cutter holders to meet the requirements of different back rake angles and shaped cutters.
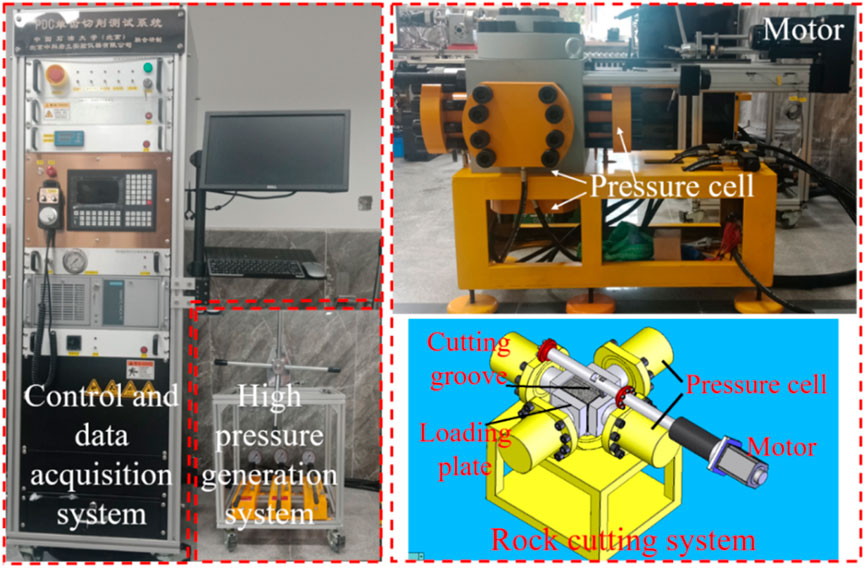
FIGURE 1. The experimental apparatus for rock cutting tests.
Over the past few years, a great number of studies have been performed to study the effects of cutting parameters on rock failure characteristics, and the results have been widely recognized. In the present study, we focused only on the impacts of in-situ stress and hydrostatic pressure on the rock cutting process, with the hydrostatic pressure being equal to the overburden pressure. Other parameters, including the cutting depth, cutting speed, and back rake angles were set as 1.5 mm, 5 mm/s, and 20°, respectively. The PDC cutters with dimensions of ϕ19 mm × 13 mm were used in this study due to their wide application in previous studies and oilfields (Cheng et al., 2019b; Dai et al., 2021b). The cutting force was monitored and recorded with a sampling rate of 100Hz, which reflects the cutter-rock interaction and resistance of rocks to the cutter. Table 1 provides an overview of the parameters designed for our experiments.
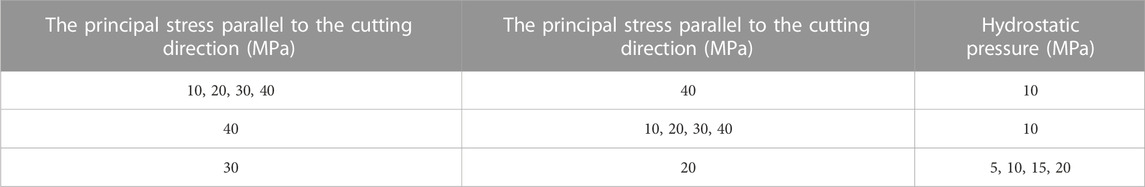
TABLE 1. The scheme of the rock cutting tests under pressurized conditions.
After conducting the rock cutting experiments, the ST400 3D Profilometer was applied to capture the 3D topography of cutting grooves. This facility has a measurement precision of 300 nm, enabling accurate determination of the height of different positions. Then, the volume of rock breaking, and the roughness of cutting grooves can be calculated based on the interpolation and integration algorithm. By combining the fluctuation of cutting force, we calculated the MSE as well. In this study, two sampling points at a distance of 30 μm and 40 μm in the parallel and perpendicular direction to the rock cutting direction.
The granite was selected to conduct rock cutting tests in this study, which was collected from Shandong province and machined into cube blocks with a side length of 100 mm, with all surfaces polished to ensure their flatness and parallelism. This design allows for precise adjustments to both cutting depth and confining pressures. Table 2 provides some important physical and mechanical properties of samples.

TABLE 2. Some physical and mechanical properties of granite.
Based on the results of previous studies, the cutting force is a valuable indicator of the rock-cutter interaction, the cuttings formation process, and the difficulty of rock breaking. Therefore, the cutting force is captured and the fluctuation of data is presented in Figure 2.
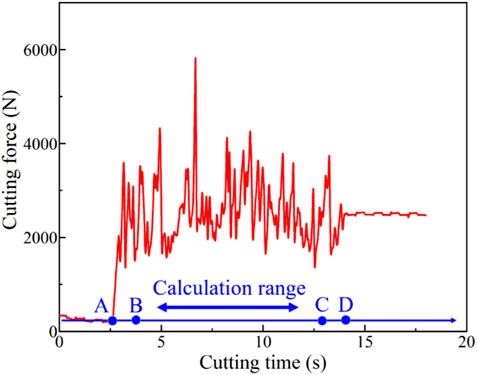
FIGURE 2. The fluctuation of cutting force in rock cutting experiments.
As shown in Figure 2, the cutting force presents different characteristics with the increase in cutting time. Before point A, the cutting force appears as a straight line because the cutter is within the fluid and without contacting the rock. However, it is worth noting that the average cutting force is larger than 0 due to the friction between the high-pressure fluid and the cutter. This value is calculated and subtracted to determine the average cutting force during the rock failure process. From point A to point D, the cutting force exhibits significant oscillatory behavior, indicating the repeated cycles of energy accumulation and rock failure. The cutting force increases as the PDC cutter compresses the rock in front of it until the energy exceeds a specific value that depends on the rock. At this threshold, cuttings generates, and the interaction between the rock and the cutter ends. Thereby, the cutting force decreases, and the next energy accumulation cycle begins with the continued movement of the PDC cutter. The rock cutting process comes to an end at point D. Because of the limitation of the experimental setup, the final position of the PDC cutter at a distance from the rock boundary. As a result, the average cutting force in Figure 2 tends to be stable after point D, rather than decrease to zero. In the present study, the actual cutting distance is equal to 55 mm. Additionally, to minimize the potential influence of boundary effects on the experimental results, we only calculate the data monitored from point B to point C, with a 2-s interval from point A and point D, respectively. This approach allowed us to focus on a 7-s window of sampled data to calculate the average cutting force.
Figure 3 illustrates the variation of average cutting force under different principal stresses. An overall increase in the cutting force can be observed, indicating that the loading of principal stress limits the rock-breaking efficiency. Similar phenomena are also concluded by other scholars. The first and major reason is that the confining pressure restricts the initiation of and propagation of cracks. The second reason is associated with enhanced rock strength and plasticity. Furthermore, a great difference between the maximum and minimum principal stress facilitates the rock fragmentation process. In the present study, the maximum principal stress remains constant. The stress difference in two mutually perpendicular directions decreases at larger confining pressures, leading to lower rock failure efficiency as well.
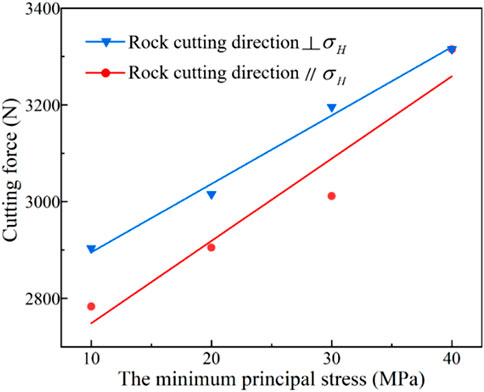
FIGURE 3. The variation of cutting force under different principal stresses.
Another result shown in Figure 3 is that the principal stress has greater effects on rock cutting process when its direction is parallel to the cutting direction. The stress distribution in rocks causes this result, which is further analyzed by the theoretical model developed in Section 3.
This study also investigates the effects of hydrostatic pressure on the rock failure process. Based on the results presented in Figure 4, hydrostatic pressure has a greater influence on cutting force compared to the principal stress. Additionally, nonlinear fitting analysis reveals a strong parabolic relationship between the cutting force and hydrostatic pressures. Therefore, the unfavorable effect of hydrostatic pressures is weakened at greater values.
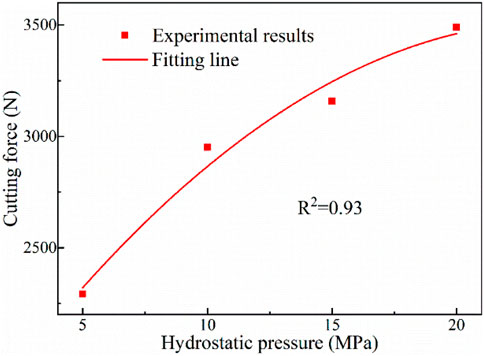
FIGURE 4. The variation of cutting force with the increase of hydrostatic pressures.
Previous studies validate that the generated cuttings flow along the cutter surface rather than splash away under the impacts of hydrostatic pressures (Rafatian et al., 2010). As shown in Figure 5, the friction force is induced in this process and significantly increases the difficulty of breaking rocks. Besides, the fracture process of cuttings and the distribution of stress in rocks are also affected by hydrostatic pressures. As a consequence, this pressure has more obvious effects on the rock failure process. The above analysis guides the development of the theoretical model, which would be described in Section 3 in detail.
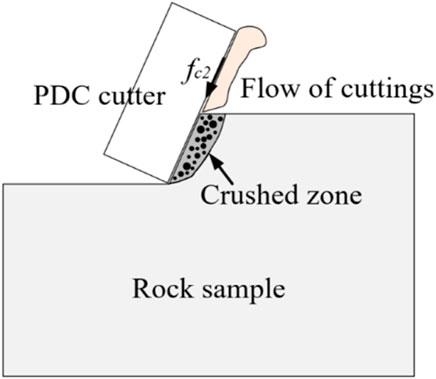
FIGURE 5. Rock failure process under the effects of hydrostatic pressures.
In the single PDC cutter tests, the failure of rocks mainly occurs in three stages: compression of rocks ahead of the cutter, propagation of major cracks to generate chunk-like cuttings, and the extension of subsurface cracks (Cheng et al., 2019b). Among them, the first stage serves primarily to accumulate energy and dominates the rock failure process at a small cutting depth. The second stage, by contrast, has the greatest effects on rock cutting efficiency, which is evaluated by calculating MSE in the subsequent analysis. The last stage can enhance the follow-up rock failure efficiency by creating a pre-damaged area.
To analyze different causes of rock fragmentation process, the 3D topography of cutting grooves is captured. As shown in Figure 6A, some pits can be observed on the surface of cutting grooves. Due to the great difference in the stiffness of the cutter and the rock, the former can be regarded as a rigid body. Thereby, a flat cutting groove should be formed at a constant cutting depth. Based on the above analysis, the pits located on cutting grooves are a symbol of subsurface cracks, which are quantitatively assessed by the roughness of cutting grooves using Eq. 1.
where Ra is the roughness of surfaces, and A is the area of the corresponding zone. Z (x, y) is the height of different sampling points and is determined by the ST400 3D Profilometer.
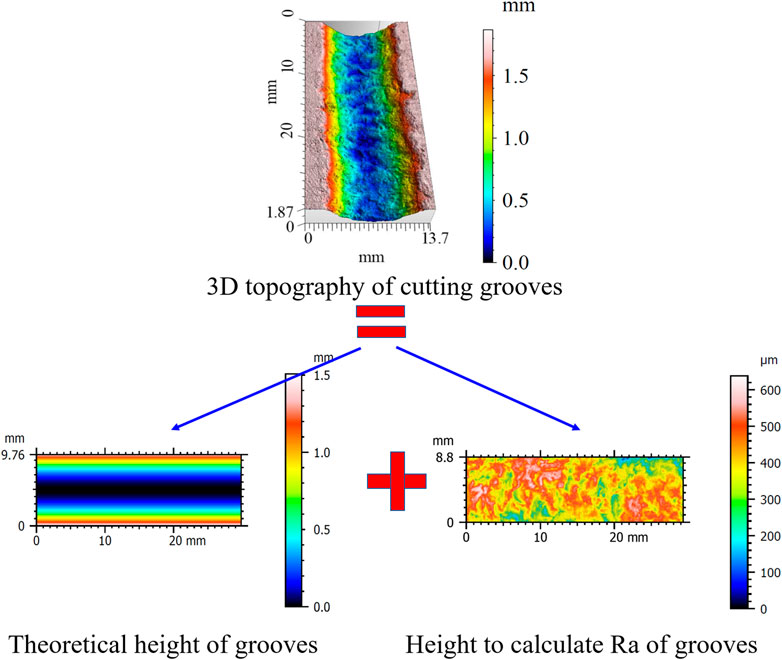
FIGURE 6. 3D topography of cutting grooves and the determination of Ra.
The calculation method reveals that the Ra assumes a substantial value even on wholly smooth cutting grooves. Thereby, the theoretical height of different points is calculated firstly based on the cutting depth, cutter diameter, and back rake angles (Figure 6B). Then, the difference between the actual value and the theoretical value is determined to eliminate the effects of cutter geometry on calculation results. After this step, the obtained value presented in Figure 6C can be applied to compute the Ra using Eq. 1.
Figure 7 displays the effects of confining pressure and hydrostatic pressure on the roughness of cutting groove. Interestingly, an opposite variation trend can be observed in Figures 7A, B. Specifically, the increase in the minimum principal stress results in a smaller Ra, indicating a decrease in the roughness of cutting grooves. Notably, it is found that the direction of minimum principal stress only has a few influences on the propagation of subsurface cracks. The continuous loading of hydrostatic pressure is accompanied by an overall increase in the roughness of cutting grooves. Compared with the results presented in Figure 4, greater hydrostatic pressures can limit the volumetric breakage of rocks and promote the extension of subsurface cracks simultaneously.
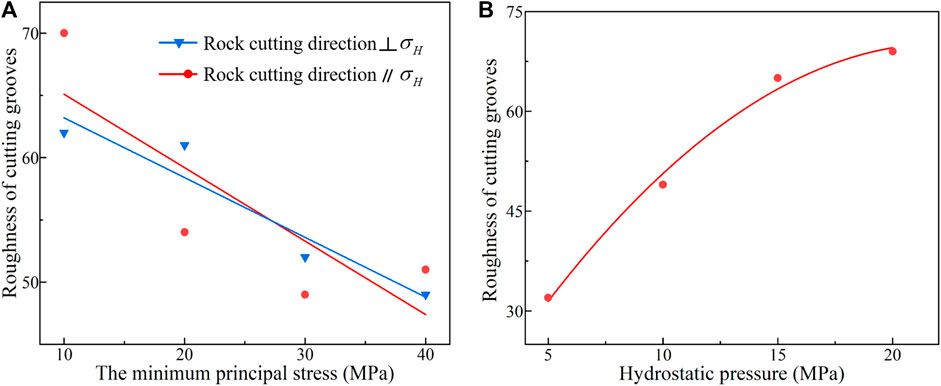
FIGURE 7. The variation of cutting groove roughness under different (A) principal stresses and (B) hydrostatic pressures.
In addition, the effects of different pressures on the MSE are studied, which is calculated by Eq. 2.
where Fi is the monitored cutting force in experiments and ∆x is the distance between two sampling points, which is determined by the sampling rate and cutting speed. V represents the volume of rock breaking and is determined by Eq. 3.
All parameters included in Eq. 3 are derived from the topography of cutting grooves. Four sampling points adjacent to each other can form a rectangle, which has a width of 30 μm (∆x) and a length of 40 μm (∆y), respectively. Then, the volume of cutting grooves (V) can be calculated based on the height of rectangle vertices (zi).
The effects of different pressures on MSE are evaluated, and the results are shown in Figure 8. The variation trend of MSE presents analogous characteristics with that of cutting force. Specifically, an overall increase in the MSE for the larger confining pressures can be detected. Moreover, more noticeable changes in the MSE is observed as the minimum principal stress is parallel to the cutting direction. Based on our calculations using Eq. 3, we can conclude that the rock failure volume under different conditions varies slightly. This finding is consistent with the variation of cutting groove roughness.
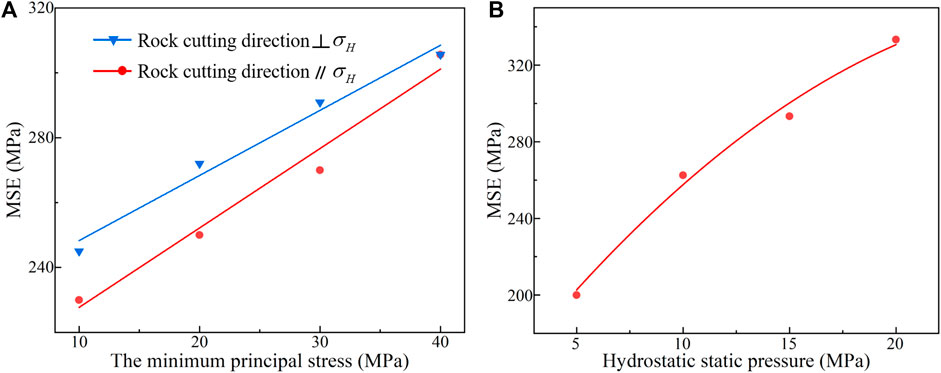
FIGURE 8. The impacts of (A) in-situ stress and (B) hydrostatic pressure on the MSE.
The MSE also increases at higher hydrostatic pressures. Although the extension of subsurface cracks leads to a larger rock failure volume, the increase in the cutting force is even more pronounced, thus resulting in a greater MSE. When drilling into deep formations, the density of drilling fluid should be as low as possible while ensuring safety.
In this section, a theoretical model is developed to investigate the failure mechanism of rocks under varying experimental conditions. As shown in Figure 9, the wear of cutters and side rake angles are neglected due to the short cutting distance and experimental setup used in this study. The distribution of stress in rocks is mainly affected by several factors, including the cutter-rock interaction force, the principal stress (σH and σh), and the hydrostatic pressure (ph). To simplify the analysis, the effects of each parameter are evaluated separately and the superposition principle is applied to calculate the results.
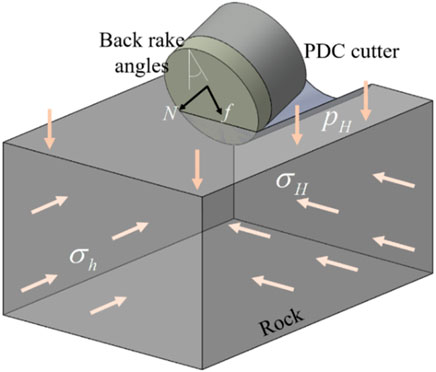
FIGURE 9. Physical model of cutter-rock interaction under pressurized conditions.
Among them, the first part consists of a contact force (N) and a frictional force (f). With the continuous movement of PDC cutters, the flow of generated cuttings results in a frictional force (f1), which can be determined by Eq. 4.
where the α is the frictional angle between the rock and the cutter.
Meanwhile, the generated cuttings flows along the cutter surface under the impact of hydrostatic pressure rather than splashes away under atmosphere conditions (Figure 5). Correspondingly, another frictional cutting force is induced and the value is expressed as:
where the ph is the hydrostatic pressure and A is the difference between the area of cutter surface and the cutter-rock interaction area, θ is the frictional angle between the cuttings and the cutter. In the calculation process, two frictional angles α and θ are ascertained by experimental results.
Then, the cutting force along the horizontal direction (x-axis direction) can be calculated, which is also measured in the experiments to evaluate rock failure efficiency and validate the accuracy of the theoretical model. Additionally, the vertical component of force (Fy) acting on the cutter can be identified as well. These two values can be expressed as follows:
It is important to note that the Fx1 and Fy1 are loaded on rocks, resulting in a redistribution of stress. Fx2 and Fy2 are consumed to overcome the friction between cuttings and cutter surfaces. Based on the cutter diameter and cutting depth in the present study, the average interaction width between the rock and the cutter can be determined. This simplification facilitates mathematical modeling and has negligible effects on the accuracy of theoretical model (Chen et al., 2021b).
As shown in Figure 10, the Fx1 and Fy1 are assumed to be uniformly distributed over the cutter-rock interaction region. Considering that a single element is significantly small in comparison with the rock, the loaded force can be treated as a concentration value. According to the theory developed by Boussinesq, T. V., and Cerruti, V., the induced stress is calculated by Eq. 8 and Eq. 9, respectively. Finally, the stress distribution within rocks can be determined by the integration algorithm.

FIGURE 10. The treatment of the cutter-rock interaction area in calculation process.
Based on the distribution of hydrostatic pressure, the evolution of stress in rock planes along the vertical direction can be approximated as a plane strain problem. That is, the strain in the horizontal direction is equal to 0. By applying the constitutive equations in the elastic stage, the effects of hydrostatic pressure on stress in rocks can be solved by Eq. 10.
where the v is the Passion’s ratio.
Similarly, the effects of the maximum and the minimum principal stress on rock stress field can be described as:
Based on the aforementioned results, the stress in rocks can be ascertained by the superposition of different parts. For example, the principal stress in x-axis direction is:
In the present study, the cutting force is calculated by the trial-and-error method. Specifically, a given force Fx1 is applied to confirm the rock stress field. Then, check whether the stress at the corresponding position (the cutting depth of 1.5 mm) meets the rock failure criterion, which is proposed by Ewy et al., and defined by Eq. 13 (Chen et al., 2021b).
where the C0 and
If the |Fai| is smaller than the error range ε, the assumed force Fx1 is correct. Then, the cutting force Fx and vertical force Fy can be determined. Otherwise, another value of Fx1 should be given based on the relation between Fai and ε. Specifically, if the Fai is larger than ε, it means that the rock will break at a larger cutting depth. Thus, a smaller Fx1 should be attempted. Inversely, a Fai smaller than –ε indicates that a larger Fx1 is required. In the present study, the bisection method is used to speed up the calculation process.
The accuracy of the theoretical model is crucial in analyzing rock failure mechanisms under pressurized conditions. In this section, we predict the cutting force (Fx) under various hydrostatic pressures and compared the results to experimental data. Notably, the maximum and the minimum principal stress are consistent with the experimental setup. As shown in Figure 11, the differences between different results are below 8%, which can be considered as a good prediction depending on the criterion utilized in previous research. Meanwhile, we can find that the predicted cutting force is always bigger than the experimental measurements. The first and primary reason is that the calculated cutter-rock interaction area is based on the cutting depth and cutter diameter. In reality, this area is irregular and smaller than the theoretical value during the cutting process. A smaller stress is induced due to the larger contact area, which in turn requires a bigger force to meet the rock failure criterion. Another contributing factor is associated with the homogeneity of the rock properties in the theoretical model, which does not account for damaged zones in real granite resulting from weakened cementing surfaces or natural cracks. Hence, the actual cutting force is smaller than the theoretical predictions. Overall, the theoretical model in this study exhibits accuracy sufficient to meet the demands for analyzing rock failure characteristics.
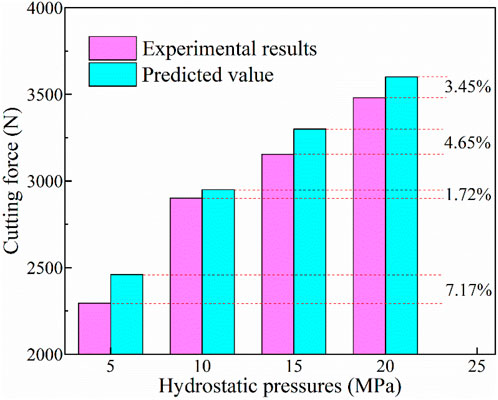
FIGURE 11. The comparison of cutting force in experiments and calculation.
To investigate rock failure mechanisms under different conditions, we calculate the distribution of stress in rocks. Figure 12 presents the stress around the cutter, in which the principal stress perpendicular and parallel to the cutting direction are equal to 40MPa and 30 MPa respectively, while the hydrostatic pressure is set at 10 MPa. The tip of the cutter is located in the center of the area, i.e., the x and y coordinate is equal to 0. The cutter moves along the positive direction of the x-axis. As shown in Figure 12, the stress mainly concentrates on the front of the cutter. The maximum value has a distance from the cutter and the stress decreases quickly as distance from the cutter increases. This finding can be correlated with the thickness of cuttings. As the z-coordinate increases from 1.5 mm to 2.0 mm, the maximum stress decreases significantly, implying that the rock at larger depths would not break. The roughness of cutting grooves shown in Figure 7B and previous studies validate this standpoint as well, which generally tends to be stable with the variation of cutting parameters (Dai et al., 2021b). That is, the failure of rocks at the bottom of cutters has a limited value. Besides, we can find that the τzx and σMises show similar characteristics and exert greater effects on rocks compared to the compression stress (σz). Meanwhile, these two values indicate the shear stress in rocks and represent the primary rock-breaking method for cylinder PDC cutters. In the follow-up analysis, only the Mises stress is presented to evaluate the rock failure efficiency.
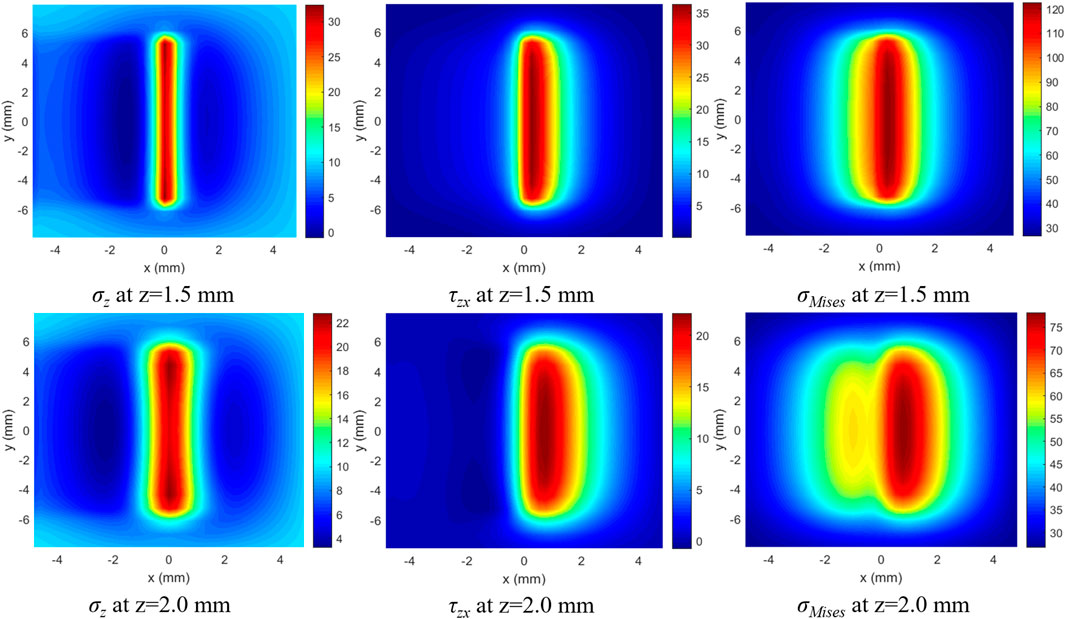
FIGURE 12. The distribution of stress at different depths.
Figure 13 depicts how the stress evolves with the variation of the minimum principal stress, with the maximum principal stress being perpendicular to cutting direction and fixed at 40 MPa. Similar outlines of stress distribution shown in Figure 13 mean an approximate mechanism behind rock-breaking. Meanwhile, the maximum Mises stress has varied values in response to changes in confining pressures. As the principal stress increases from 10 MPa to 40 MPa, the maximum Mises stress experiences an increment of approximately 17.89%. This observation indicates that the rock failure process becomes more difficult, and bigger cutting forces are required to balance the principal stress.
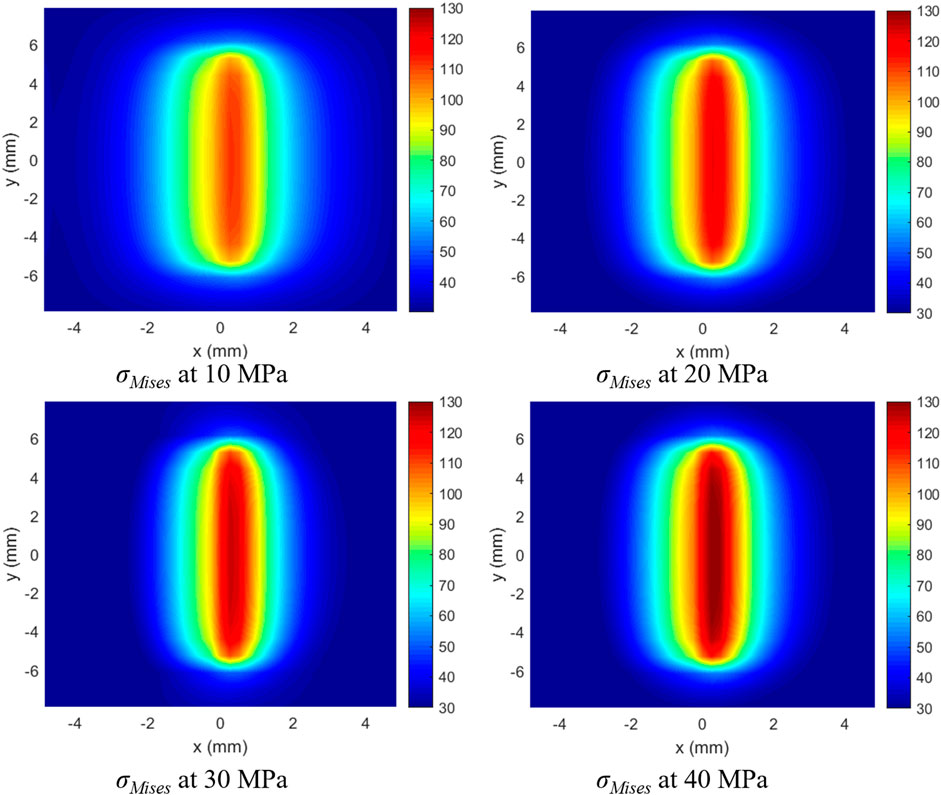
FIGURE 13. The distribution of Mises stress as the σH is perpendicular to the cutting direction.
The Mises stress in the central axis (y = 0) is also calculated to analyze rock failure process. Given that the rock mainly breaks in front of the PDC cutter, only the value located in corresponding positions (x > 0) is studied. Figure 14 shows a larger Mises stress under higher principal stresses, while the position of the maximum Mises stress consistently has a distance from the PDC cutter, consistent with the experimental findings. A compression zone emerges in front of the cutter. Meanwhile, the topography of cuttings generally shows thin slices or thick bodies, but always has a specific thickness. Thereby, the maximum shear stress is not found on the cutter surface. In previous studies, some scholars predicted the profile of cuttings based on the position of the maximum shear stress (Cheng et al., 2019a). The results indicate that the outline of cuttings is a curve rather than a straight line, which is demonstrated by other researchers as well (Hareland et al., 2009).
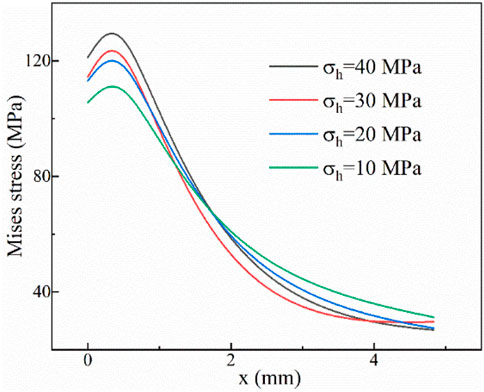
FIGURE 14. The distribution of Mises stress in front of the PDC cutter.
Another noteworthy phenomenon in Figure 14 is the variation velocity of Mises stress. Although the value at 40 MPa is larger than that at 10 Mpa, it decreases more quickly as well. A greater decent rate of Mises stress indicates a relatively small impact area in rocks, hence limiting the propagation of cracks and the size of cuttings. In Figure 14, the decreasing rate of Mises stress is negatively correlated to the corresponding maximum value. In light of these findings, a conclusion can be drawn that bigger principal stresses not only lower the rock-breaking efficiency but also limit the sizes of cuttings.
When the minimum principal stress is parallel to the cutting direction, its impact on the Mises stress is displayed in Figure 15. An overall increase in the maximum Mises stress can be observed as the principal stress becomes higher, which indicates a lower rock failure efficiency. It is evident that the loading of principal stress in both directions limits the rock cutting process. Meanwhile, the Mises stress shown in Figure 15 changes more slightly compared with that presented in Figure 13. Therefore, the influence of the principal stress on rock breaking process is weaker when its direction is perpendicular to the cutting direction. This discovery is further validated by the experimental results in the present study (Figure 3).

FIGURE 15. The evolution of Mises stress as the σH is parallel to the cutting direction.
The impacts of hydrostatic pressure on the rock cutting process are also evaluated, with the corresponding results being shown in Figure 16. Although the hydrostatic pressure only increases from 5 MPa to 20 MPa, the maximum Mises stress still varies from 110 MPa to 132 MPa, rising by about 23%. This value is close to that shown in Figure 13, where the principal stress increases by 30 MPa, twice as much as the hydrostatic pressure. Based on the results, it can be deduced that the hydrostatic pressure has more significant effects on rock failure efficiency.
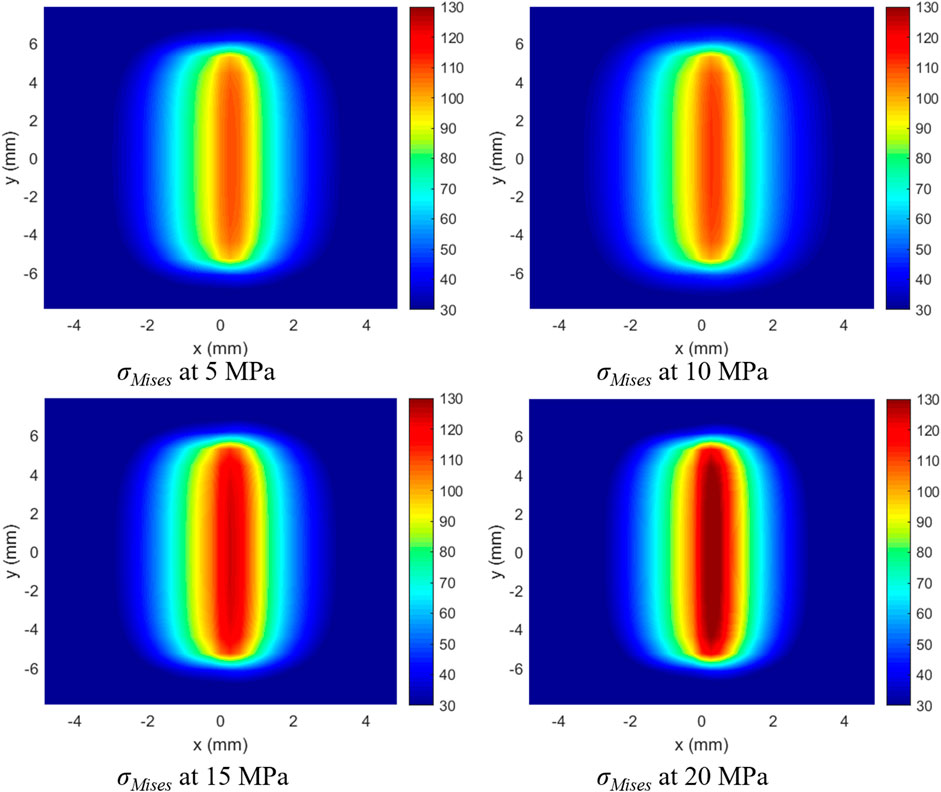
FIGURE 16. The evolution of Mises stress at different hydrostatic pressures.
Meanwhile, the hydrostatic pressure should have a larger impact in terms of the cutting force monitored in the experiments. This can be attributed to the varied rock failure mechanism under different conditions. The cutting force is composed of two components: one part is applied to break the rocks, while another one is employed to overcome the friction induced by the flow of cuttings along the cutter surface. During the rock cutting process, only the former component is exerted on rocks. Thus, the evolution of Mises stress shows analogous characteristics with that at different principal stresses. The calculated results highlight the necessity of taking certain measures, such as optimizing pump displacement, adjusting the number and diameter of nozzles, and employing underbalanced drilling to prevent the bit balling. On the basis of this, the cuttings would not accumulate in front of the cutter. Correspondingly, the induced friction force and the total cutting force decrease obviously, thereby improving the rock-breaking efficiency and prolonging the service life of PDC bits.
In the present study, a series of rock cutting tests under pressurized conditions were conducted using a self-developed facility. Meanwhile, a theoretical model was developed to investigate the evolution of stress in the rock failure process. By combining the experimental results with theoretical analysis, the rock-breaking mechanism is revealed, and the main conclusions can be summarized as follows:
• Both the principal stress and hydrostatic pressure is detrimental to the improvement of rock failure efficiency. An overall increase in cutting force and MSE can be detected at higher pressures. Additionally, the maximum Mises stress in front of the cutter becomes larger as well.
• When the principal stress is parallel to the cutting direction, it has greater effects on rock failure characteristics in comparison with that in the perpendicular direction. The corresponding cutting force, MSE, and Mises stress increase more obviously. Besides, the evolution of stress validates that larger principal stresses will limit the volumetric breakage of rocks.
• The loading of hydrostatic pressure restricts the failure of rocks and the movement of cuttings, thereby inducing friction force and simultaneously increasing the cutting force. To address this issue, the nozzle distribution and hydraulic parameters should be optimized to prevent bit-balling.
The original contributions presented in the study are included in the article/Supplementary material, further inquiries can be directed to the corresponding author.
ZR: Investigation, Methodology, Writing–original draft, Writing–review and editing. XD: Funding acquisition, Writing–original draft. SY, Validation, Writing–original draft. YL: Writing–review and editing. QZ: Investigation, Writing–review and editing. HF: Investigation, Writing–review and editing. JY: Writing–review and editing.
The authors declare that no financial support was received for the research, authorship, and/or publication of this article.
The authors would like to acknowledge the financial support from the National Natural Science Foundation of China (52204004), Natural Science Foundation of Sichuan Province (2023NSFSC0928), and their approval of publishing this paper.
Authors ZR, SY, YL, QZ, and HF were employed by PetroChina Southwest Oil & Gasfield Company. Author JY was employed by CCDC Petroleum Drilling and Production Technology.
The remaining author declares that the research was conducted in the absence of any commercial or financial relationships that could be construed as a potential conflict of interest.
All claims expressed in this article are solely those of the authors and do not necessarily represent those of their affiliated organizations, or those of the publisher, the editors and the reviewers. Any product that may be evaluated in this article, or claim that may be made by its manufacturer, is not guaranteed or endorsed by the publisher.
Akbari, B., Miska, S., Yu, M., and Ozbayoglu, E. (2014). “Relation between the mechanical specific energy, cuttings morphology, and PDC cutter geometry,” in ASME 2014 33rd International Conference on Ocean, Offshore and Arctic Engineering (American Society of Mechanical Engineers), V005T11A038.
Che, D., Zhang, W., and Ehmann, K. (2017). Chip formation and force responses in linear rock cutting: an experimental study. J. Manuf. Sci. Engineering-Transactions Asme 139 (1). doi:10.1115/1.4033905
Chen, S., Grosz, G., Anderle, S., Arfele, R., and Xun, K. (2016). The role of rock-chip removals and cutting-area shapes in polycrystalline-diamond-compact-bit design optimization. SPE Drill Compl. 30 (04), 334–347. doi:10.2118/171833-pa
Chen, P., Miska, S. Z., Ren, R., Yu, M., Ozbayoglu, E., and Takach, N. (2018). Poroelastic modeling of cutting rock in pressurized condition. J. Petroleum Sci. Eng. 169, 623–635. doi:10.1016/j.petrol.2018.06.009
Chen, P., Meng, M., Miska, S., Yu, M., Ozbayoglu, E., and Takach, N. (2019). Study on integrated effect of PDC double cutters. J. Petroleum Sci. Eng. 178, 1128–1142. doi:10.1016/j.petrol.2019.04.024
Chen, P., Miska, S., Yu, M., and Ozbayoglu, E. (2021a). Modeling of cutting rock: from PDC cutter to PDC bit—modeling of PDC bit. SPE J. 26 (06), 3465–3487. doi:10.2118/206725-pa
Chen, P., Miska, S., Yu, M., and Ozbayoglu, E. (2021b). Modeling of cutting rock: from PDC cutter to PDC bit—modeling of PDC cutter. SPE J. 26 (06), 3444–3464. doi:10.2118/205342-pa
Cheng, Z., Sheng, M., Li, G., Huang, Z., Wu, X., Zhu, Z., et al. (2018). Imaging the formation process of cuttings: characteristics of cuttings and mechanical specific energy in single PDC cutter tests. J. Petroleum Sci. Eng. 171, 854–862. doi:10.1016/j.petrol.2018.07.083
Cheng, Z., Li, G., Huang, Z., Sheng, M., Wu, X., and Yang, J. (2019a). Analytical modelling of rock cutting force and failure surface in linear cutting test by single PDC cutter. J. Petroleum Sci. Eng. 177, 306–316. doi:10.1016/j.petrol.2018.09.023
Cheng, Z., Sheng, M., Huang, Z., Shi, H., and Dai, X. (2019b). Cracks imaging in linear cutting tests with a PDC cutter: characteristics and development sequence of cracks in the rock. J. Petroleum Sci. Eng. 179, 1151–1158. doi:10.1016/j.petrol.2019.04.053
Dai, X., Huang, Z., Shi, H., Cheng, Z., Xiong, C., Wu, X., et al. (2020a). Rock failure analysis based on the cutting force in the single PDC cutter tests. J. Petroleum Sci. Eng. 194, 107339. doi:10.1016/j.petrol.2020.107339
Dai, X., Huang, Z., Wu, X., and Shi, H. (2020b). “Experimental investigation of the PDC cutter penetration process,” in 54th U.S. Rock Mechanics/Geomechanics Symposium.
Dai, X., Huang, Z., Shi, H., Wu, X., and Xiong, C. (2021a). Cutting force as an index to identify the ductile-brittle failure modes in rock cutting. Int. J. Rock Mech. Min. Sci. 146, 104834. doi:10.1016/j.ijrmms.2021.104834
Dai, X., Huang, Z., Wu, X., Shi, H., and Xiong, C. (2021b). Failure analysis of high-temperature granite under the joint action of cutting and liquid nitrogen jet impingement. Rock Mech. Rock Eng. 54 (12), 6249–6264. doi:10.1007/s00603-021-02600-1
Dai, X., Huang, Z., Zou, W., Wu, X., and Shi, H. (2021c). Failure characteristics of rocks subjected to PDC cutter indentation. J. Petroleum Sci. Eng. 207, 108992. doi:10.1016/j.petrol.2021.108992
Detournay, E., and Atkinson, C. (2000). Influence of pore pressure on the drilling response in low-permeability shear-dilatant rocks. Int. J. Rock Mech. Min. Sci. 37 (7), 1091–1101. doi:10.1016/s1365-1609(00)00050-2
Gao, M., Zhang, K., Zhou, Q., Zhou, H., Liu, B., and Zheng, G. (2020). Numerical investigations on the effect of ultra-high cutting speed on the cutting heat and rock-breaking performance of a single cutter. J. Petroleum Sci. Eng. 190, 107120. doi:10.1016/j.petrol.2020.107120
Hareland, G., Nygaard, R., Yan, W., and Wise, J. L. (2009). Cutting efficiency of a single PDC cutter on hard rock. PETSOC 48 (06), 60–65. doi:10.2118/09-06-60
He, X., and Xu, C. (2016). Specific energy as an index to identify the critical failure mode transition depth in rock cutting. Rock Mech. Rock Eng. 49 (4), 1461–1478. doi:10.1007/s00603-015-0819-6
Huang, H., and Detournay, E. (2013). Discrete element modeling of tool-rock interaction II: rock indentation. Int. J. Numer. Anal. Methods Geomech. 37 (13), 1930–1947. doi:10.1002/nag.2114
Jaime, M. C., Zhou, Y., Lin, J.-S., and Gamwo, I. K. (2015). Finite element modeling of rock cutting and its fragmentation process. Int. J. Rock Mech. Min. Sci. 80, 137–146. doi:10.1016/j.ijrmms.2015.09.004
Jaime, M. C. (2011). Numerical modeling of rock cutting and its associated fragmentation process using the finite element method. University of Pittsburgh.
Li, X., Wang, S., Malekian, R., Hao, S., and Li, Z. (2016). Numerical simulation of rock breakage modes under confining pressures in deep mining: an experimental investigation. IEEE Access 4, 5710–5720. doi:10.1109/access.2016.2608384
Liu, W., Zhu, X., and Jing, J. (2018). The analysis of ductile-brittle failure mode transition in rock cutting. J. Petroleum Sci. Eng. 163, 311–319. doi:10.1016/j.petrol.2017.12.067
Mazen, A. Z., Mujtaba, I. M., Hassanpour, A., and Rahmanian, N. (2020). Mathematical modelling of performance and wear prediction of PDC drill bits: impact of bit profile, bit hydraulic, and rock strength. J. Petroleum Sci. Eng. 188, 106849. doi:10.1016/j.petrol.2019.106849
Mazen, A. Z., Rahmanian, N., Mujtaba, I. M., and Hassanpour, A. (2021). Effective mechanical specific energy: A new approach for evaluating PDC bit performance and cutters wear. J. Petroleum Sci. Eng. 196, 108030. doi:10.1016/j.petrol.2020.108030
Rafatian, N., Miska, S. Z., Ledgerwood, L. W., Yu, M., and Ahmed, R. (2009). “Experimental study of MSE of a single PDC cutter under simulated pressurized conditions,” in SPE/IADC Drilling Conference and Exhibition (Amsterdam, The Netherlands: Society of Petroleum Engineers), 12.
Rafatian, N., Miska, S., Ledgerwood, L. W., Ahmed, R., Yu, M., and Takach, N. (2010). Experimental study of MSE of a single PDC cutter interacting with rock under simulated pressurized conditions. SPE Drill Comp 25 (01), 10–18. doi:10.2118/119302-pa
Rahmani, R., Smith, J., and Taleghani, A. D. (2012). “Analytical modeling of PDC single cutter-rock interaction under confining pressure,” in 46th US Rock Mechanics/Geomechanics Symposium (American Rock Mechanics Association).
Rajabov, V., Miska, S. Z., Mortimer, L., Yu, M., and Ozbayoglu, M. E. (2012). “The effects of back rake and side rake angles on mechanical specific energy of single PDC cutters with selected rocks at varying depth of cuts and confining pressures,” in IADC/SPE Drilling Conference and Exhibition (Society of Petroleum Engineers).
Rostamsowlat, I., Richard, T., and Evans, B. (2018). An experimental study of the effect of back rake angle in rock cutting. Int. J. Rock Mech. Min. Sci. 107, 224–232. doi:10.1016/j.ijrmms.2018.04.046
Rostamsowlat, I. (2018). Effect of cutting tool properties and depth of cut in rock cutting: an experimental study. Rock Mech. Rock Eng. 51 (6), 1715–1728. doi:10.1007/s00603-018-1440-2
Sheikhrezaei, K., and Taleghani, A. D. (2017). “Comparative experimental study of rock cutting under high confining pressure and atmospheric conditions using PDC cutter,” in Poromechanics VI, 1900–1908.
Xi, Y., Wang, H. Y., Zha, C. Q., Li, J., Liu, G. H., and Guo, B. Y. (2023). Numerical simulation of rock-breaking and influence laws of dynamic load parameters during axial-torsional coupled impact drilling with a single PDC cutter. Petroleum Sci. 20, 1806–1827. doi:10.1016/j.petsci.2023.01.009
Xiong, C., Huang, Z., Shi, H., Yang, R., Dai, X., and He, W. (2021). 3D cutting force model of a stinger PDC cutter: considering confining pressure and the thermal stress. Rock Mech. Rock Eng. 54 (9), 5001–5022. doi:10.1007/s00603-021-02494-z
Yin, L., Gong, Q., Ma, H., Zhao, J., and Zhao, X. (2014). Use of indentation tests to study the influence of confining stress on rock fragmentation by a TBM cutter. Int. J. Rock Mech. Min. Sci. 72, 261–276. doi:10.1016/j.ijrmms.2014.07.022
Zhou, Y., Zhang, W., Gamwo, I., and Lin, J.-S. (2017). Mechanical specific energy versus depth of cut in rock cutting and drilling. Int. J. Rock Mech. Min. Sci. 100, 287–297. doi:10.1016/j.ijrmms.2017.11.004
Keywords: unconventional oil, rock breaking, pressurized conditions, theoretical model, PDC cutter
Citation: Rong Z, Dai X, Yan S, Liu Y, Zhang Q, Fu H and Yao J (2023) Experimental and theoretical analysis of rock failure characteristics by a single PDC cutter under downhole pressurized conditions. Front. Energy Res. 11:1264804. doi: 10.3389/fenrg.2023.1264804
Received: 21 July 2023; Accepted: 14 August 2023;
Published: 25 August 2023.
Edited by:
Zhilin Cheng, Xi’an Shiyou University, ChinaReviewed by:
Yu Shi, Southwest Jiaotong University, ChinaCopyright © 2023 Rong, Dai, Yan, Liu, Zhang, Fu and Yao. This is an open-access article distributed under the terms of the Creative Commons Attribution License (CC BY). The use, distribution or reproduction in other forums is permitted, provided the original author(s) and the copyright owner(s) are credited and that the original publication in this journal is cited, in accordance with accepted academic practice. No use, distribution or reproduction is permitted which does not comply with these terms.
*Correspondence: Xianwei Dai, ZGFpeHdAY2R1dC5lZHUuY24=
Disclaimer: All claims expressed in this article are solely those of the authors and do not necessarily represent those of their affiliated organizations, or those of the publisher, the editors and the reviewers. Any product that may be evaluated in this article or claim that may be made by its manufacturer is not guaranteed or endorsed by the publisher.
Research integrity at Frontiers
Learn more about the work of our research integrity team to safeguard the quality of each article we publish.