 Changjun Zhao1
 Xing Yan
- 1Marketing Division, Gansu Electric Power Company, Lanzhou, China
- 2College of Electrical Engineering, Sichuan University, Chengdu, China
To cope with the energy crisis and environmental degradation, the new energy represented by wind and photovoltaic power generations have developed rapidly, which leads to a large number of power electronic converters being connected to the power grid. In this context, the power-electronic-based power system has become a trend. However, when wideband impedance mismatch happens between the power electronic converter and the connected power supply network, the wideband oscillation will occur in the system, which seriously endangers the safe and stable operation of the power system. To solve it, impedance identification is a key step to obtain the dq-frame impedance characteristics to analyze the power system stability. This article focuses on the power supply network and proposes an improved method to identify its dq-frame wide-band impedance by only one disturbance, which greatly simplifies the dq-frame wideband impedance identification process to improve the identification efficiency. It is of great significance for the safe and stable operation of the power-electronic-based power system.
1 Introduction
With the gradual depletion of fossil fuels and the continuous deterioration of the natural environment globally, the clean power generation is increasingly receiving attentions (Hassan Zamani et al., 2016; Rebello et al., 2019; Hara et al., 2022). Among them, wind and photovoltaic power generations that rely on power electronic converters are increasingly connected to the power grid for their mature technology. However, when the wideband impedances of the wind/photovoltaic power generations are mismatched with that of the connected power supply network, the wideband oscillation will occur in the system, which seriously endangers the safe and stable operation of the power system (Xie et al., 2017; Zhang et al., 2020). Thus, to obtain the wideband impedance is the key to solve this problem (Zhou et al., 2019; Hu et al., 2020a; Wu et al., 2020).
According to whether the harmonic disturbance signals are applied, the methods to identify impedance are mainly divided into active and passive strategies (Pan et al., 2018; Hu et al., 2020b; Pan et al., 2021a). Passive strategy estimates the impedance using mathematical analysis and numerical processing without injecting any additional disturbance (Pegoraro et al., 2019; Lin et al., 2020a; Lin et al., 2020b). Although this kind of strategy has no impact on the original system, it has a large computational load and extensive estimation. This “estimation” inevitably brings the errors to the impedance identification results, which causes it difficult to accurately identify the wideband impedance in practical engineering applications. Different from it, the active identification strategy requires injecting disturbance signals to the system, such as switching capacitors, bridge power electronic circuits, etc. Although the disturbance-injection-based active strategy has some impacts on the original system, it can more accurately identify the impedance within the allowable range of the impact and have developed rapidly in recent years. In addition, the identification process of the active strategy is simpler, since it does not involve a large amount of redundant numerical calculations.
The active method can be further divided into single-frequency-based method and wideband-based method. The single-frequency-based method injects a single-frequency harmonic disturbance into the tested system at once, relying on the idea of “frequency scanning” to identify the wideband impedance characteristics of the tested system. For example, L. Asiminoaei extracts the impedance of the tested system by injecting a single specific frequency harmonic disturbance into the common coupling point of the tested system (Asiminoaei et al., 2004). Subsequently, a large number of identification techniques similar to this idea have emerged (Jakšić et al., 2017; Berg et al., 2018; Alves et al., 2019; Salis et al., 2019). The Virginia Tech research team proposes impedance identification method based on power electronics building block (PEBB), and designs high-power impedance identification devices based on these methods, which can be well applied to the on-site identifications. The research team of Hunan University has developed a MW-level impedance identification device based on a modular approach, and the device is used to measure the wideband impedance of VSC equipment in clean energy generation systems. However, this type of method can only identify the impedance at the corresponding injected disturbance frequency and requires the idea of “frequency scanning” to repeatedly inject harmonic disturbances into the tested system. The measurement process is time-consuming and has poor real-time performance.
The wideband-based identification method injects all the harmonic disturbances at the target frequencies into the tested system at once, greatly improving the identification speed and real-time performance. For example, J Huang uses the pulse width modulation (PWM) signals to switch and control H-bridge or chopper type circuits, which can inject wideband harmonic disturbances into the system (Jing et al., 2009). In addition, by using uncontrolled rectification bridge, combined with the random pulse width modulation (RPWM) signal or directly using the PWM switching signal to control the DC load, it can also generate harmonic disturbances over a wide frequency range in the tested system at once (Jordan et al., 2011). Furthermore, relying on disturbing the control system loop, a maximum-length binary sequence (MLBS) signal with high SNR has a good performance in detecting the impedance of the strong power supply network, and also has a good applicability for sensitive systems (Roinila et al., 2018). In summary, the overall development trend of impedance identification is from single-frequency-based method to wideband-based method.
Since the generalized Nyquist stability criterion is based on the dq-frame impedances (Pan et al., 2021b). To directly measure the dq-frame impedance of the power supply network can be conveniently used to analyze the stability of the system. Thus, this paper focuses on the power supply network, and proposes an improved dq-frame impedance identification method based on the advanced wideband-based method. The main contributions are listed as follows.
1) The traditional dq-frame impedance identification methods require at least two disturbance injections. Compared to it, the proposed method only requires one wideband disturbance injection, which is simpler and more efficient.
2) The proposed method does not rely on a particular disturbance mode, and the disturbance generated by any wideband disturbance device can be used for the proposed method, which has higher practicality.
The rest of the article is organized as follows. Section 2 briefly introduces the traditional dq-frame impedance identification method of the power supply network. Then, the detailed mathematical derivation processes of dq-frame impedance at the positive/negative frequencies are presented in Section 3. Based on this, Section 4 proposes the corresponding wideband impedance identification method. Section 5 shows the simulation validations. Finally, Section 6 concludes this article.
2 Traditional dq-frame impedance identification method
The traditional dq impedance identification method for power supply networks can be divided into four steps (Pan et al., 2021b), as shown in Figure 1, which are: 1) Disturbance injection; 2) Responses acquisition and α→αβ transform; 3) αβ→dq transform; 4) Impedance calculation. Through the above steps, the dq-frame impedance Zdq of the power supply network can be identified. The following will provide the detailed introductions to these four steps. Furthermore, it is worth noting that the discussed object of this article is single-phase power supply network, which has better applicability because the three-phase power supply network can be seen as three single-phase networks, and its impedance in the dq frame can be obtained by identifying the impedance of any one phase. Further, the disturbance used in this paper is a current-type disturbance.
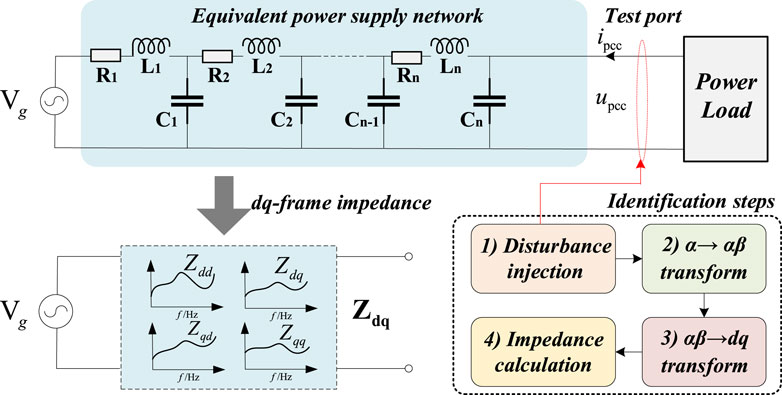
FIGURE 1. Block diagram of the simplified single-phase train-network system.
2.1 Disturbance injection
To identify the dq-frame impedance at the target frequency ωm, the traditional disturbance injection needs to be specially designed to obtain two sets of dq-frame responses at the identification frequency ωm, as shown in Eq. 1.
where udq1,2 denotes the desired two sets of dq-frame voltage responses. Notably, udq1 cannot be linearly represented by udq2, and introductions of linearly independent vectors can be seen in (Pan et al., 2018). To obtain these kinds of dq-frame responses, generally, two sets of disturbances are injected at ωm-ω0 and ωm+ω0, where ω0 is the fundamental frequency. Considering the above characteristics, it is also a limitation of the traditional dq-frame impedance identification methods, as there are some strict restrictions on disturbance injection link to obtain the desired responses, which leads to the complexity of the impedance identification process. It is worth noting that the disturbance injection time must be greater than the sampling time, which is the reciprocal of the frequency resolution.
2.2 α→αβ transform
After injecting the designed harmonic disturbance into the test port of the power supply network, the response voltage/current data ipcc and upcc (α frame) can be further collected. Then the second order generalized integrator (SOGI) or Hilbert transform can be utilized to get the data (uα, uβ) in the αβ frame. Since the identification method proposed in Section 4 is based on the Hilbert transform, the following will introduce the Hilbert-transform-based method to get uα and uβ in detail (Pan et al., 2021b).
Hilbert transform can be expressed as
where H represents the Hilbert transform;
where F represents the Fourier transform. It can be seen from Eq. 3 that when the target frequency ω is greater than 0, the Hilbert transform can shift the original signal phase by - 90°. Furthermore, when the target frequency is less than 0, the phase shift angle is 90°. It should be noted that when the frequency is equal to 0, the Hilbert transform is invalid since the result is constant 0. However, this situation does not affect the field of impedance identification as there is no need to perform the corresponding transformations on the DC values. Further, the orthogonal uα and uβ can be obtained, represented as follows
Furthermore, the Hilbert transform can be easily realized by MATLAB toolbox function “hilbert.” In detail, uα equals upcc, and uβ equals the imaginary part of the Hilbert transform results.
2.3 αβ→dq transform
Through Section 2.2, the αβ-frame values can be obtained. Then, the dq-frame values can be further transformed from αβ frame, and the transform formula is as follows
where, ud and uq are the dq-frame voltage responses. The above process takes the voltage transform as an example. Furthermore, for the current transform, it is consistent with the above process. Thus, id and iq can be further obtained with the above process.
2.4 Impedance calculation
When the dq-frame voltage/current values are obtained, the power supply network impedance can be calculated. The equivalent dq-frame impedance matrix is marked as Zdq, and its corresponding circuit relationship can be derived as
where, Zdd, Zdq, Zqd and Zqq are the four elements of the dq-frame impedance matrix Zdq. To calculate the Zdq, two sets of linearly independent dq-frame voltage/current data are required, which can be expressed as
where, subscripts “1” and “2” represent two sets of dq-frame voltage/current responses, respectively. As can be seen, the traditional dq-frame impedance identification methods require at least two harmonic disturbance injections to calculate the corresponding dq-frame impedance Zdq, which is a limitation and should be further improved.
3 Detailed mathematical derivations of dq-frame impedance at the positive and negative frequencies
This section presents the impedance expressions of the basic components of the power supply network (inductor, capacitor, and resistor) at positive and negative frequencies, which provides a theoretical basis for proposing the novel dq-frame impedance identification method in Section 4.
3.1 Inductor impedance at the positive/negative frequencies
Firstly, the impedance expression of the inductor at the positive frequency (f+) condition is discussed. Assuming the expression for the current flowing through the inductor is i(t) = sin(ωt), the corresponding differential expression can be expressed as
where, L is the inductance value; d represents the differential operator; u(t) is the voltage of the inductor. According to (8), the relationship can be built as
where, ZL(f+) represents the inductor impedance at the positive frequency (f+). Further, through the relationship presented in Eq. 9, the impedance of the inductor at this condition can be expressed as
Then, the impedance expression of the inductor at the negative frequency (f−) is dis-cussed. At this condition, assuming the expression for the current flowing through the inductor is i(t) = sin(-ωt), the corresponding differential expression is shown as
According to (11), the following relationship can be obtained.
where, ZL(f−) represents the inductor impedance at the negative frequency (f−). Further, through the relationship presented in Eq. 12, the impedance of the inductor at this condition can be expressed as
From Eqs. 10, 13, it can be seen that the impedance expressions of the inductor at positive and negative frequencies are consistent, and the following contents will further explain this reason.
By observing the above inductor impedance expressions at the positive and negative frequencies, the voltage and current vector diagrams are shown in Figure 2. As can be seen, regardless of whether the frequency is positive or negative (forward and reverse rotation), the characteristic expressions of the inductor are the same, with voltage leading current of 90°. Thus, the impedance expressions of the inductor at positive and negative frequencies are consistent.
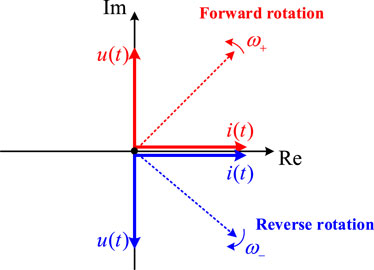
FIGURE 2. Voltage and current vector diagrams of inductor at the positive/negative frequencies.
3.2 Capacitor impedance at the positive/negative frequencies
For capacitor, its impedance expression at the positive frequency (f+) condition is first discussed. Assuming the voltage applied to the capacitor is u(t) = sin(ωt), the corresponding differential expression is shown as
where, C is the capacitance value. According to (14), the relationship can be built as
where, YC(f+) represents the capacitor admittance at the positive frequency (f+). Further, through the relationship presented in Eq. 15, the admittance of the capacitor at this condition can be derived as
Accordingly, its impedance at the positive frequency can be obtained by
Then, the impedance expression of the capacitor at the negative frequency (f−) is discussed. At this condition, assuming the voltage applied to the capacitor is u(t) = sin(-ωt), the corresponding differential expression is expressed as
From Eq. 18, the following relationship can be obtained.
where, YC(f−) represents the capacitor admittance at the negative frequency (f−). Further, through the relationship presented in Eq. 19, the admittance of the capacitor at this condition can be expressed as
Further, its impedance at the negative frequency can be obtained by
From Eqs. 17, 21, it can be seen that the impedance expressions of the capacitor at positive and negative frequencies are also consistent, and the reason can be further explained as follow.
By observing the above capacitor impedance expressions at the positive and negative frequencies, the voltage and current vector diagrams are shown in Figure 3. As can be seen, regardless of whether the frequency is positive or negative (forward and reverse rotation), the characteristic expressions of the capacitor are the same, with current leading voltage of 90°. Thus, the impedance expressions of the capacitor at positive and negative frequencies are consistent.
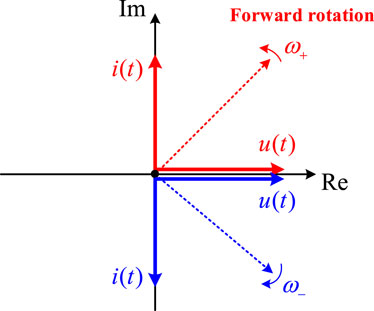
FIGURE 3. Voltage and current vector diagrams of capacitor at the positive/negative frequencies.
3.3 Resistor impedance at the positive/negative frequencies
For resistor, its impedance is not related to frequency. Therefore, at the positive and negative frequencies, the impedance expressions are the same, represented as follows
where, ZR(f+) and ZR(f−) represent the resistor impedance at the positive and negative frequencies, respectively.
The corresponding voltage/current vector diagram of resistor is shown in Figure 4. As can be seen, regardless of whether the frequency is positive or negative, the voltage and current are in phase.
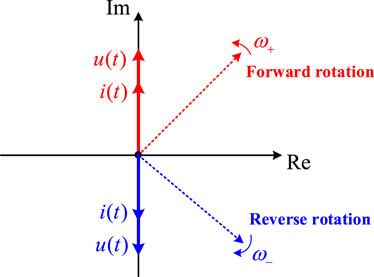
FIGURE 4. Voltage and current vector diagrams of resistor at the positive/negative frequencies.
To sum up, the impedance expressions of inductors, capacitors, and resistors are respectively the same at positive and negative frequencies. This is also the basis for proposing the novel dq-frame impedance identification method in the following section. Furthermore, the simulation results in Section 5 can also verify the correctness of the analysis and conclusions in this section in turn. Noteworthily, the physical significance of the negative-frequency impedance can be described by the impedance characteristics of inductance, capacitance and resistance under the reverse rotation of the motor. For inductor and capacitor, their impedance is only related to the frequency value and not related to the direction of motor rotation. For resistors, their impedance is completely independent of frequency. Therefore, the negative-frequency impedances of inductors, capacitors and resistors derived in this paper are the same as those under the positive frequencies.
4 Proposed impedance identification method with only one wideband disturbance
To improve the efficiency of the dq-frame impedance identification, this section introduces how to rely on only one wideband disturbance injection to identify the impedance characteristics of the power supply network. Firstly, the external characteristics of the power supply network at positive and negative frequencies are introduced. Then, the dq-frame voltage/current extractions at the positive and negative frequencies are con-ducted with the forward and reverse dq transformation. Finally, based on the above analysis, the corresponding detailed wideband impedance identification steps are developed, which can quickly and efficiently identify the dq-frame wideband impedance of the power supply network.
4.1 External characteristics of the power supply network at positive and negative frequencies
In Section 3, it can be found that the expressions for the positive- and negative-frequency impedances of the inductor, capacitor, and resistor are consistent. For the power supply network, it is also composed of multiple inductance, capacitance, and resistance links. Therefore, the impedance expressions of the power supply network are the same at positive and negative frequencies, and the relationship can be expressed as:
where, Zdqf+ and Zdqf− are the dq-frame impedance of the power supply network at the positive and negative frequency, respectively.
Further, the external characteristics of the power supply network can be further obtained by
where, Udqf+ and Udqf− are the dq-frame voltages at the positive and negative frequency, respectively; Idqf+ and Idqf− are the dq-frame currents at the positive and negative frequency, respectively. Thus, Zdq can be derived as
It is worth noting that compared to the traditional method of injecting two harmonic disturbances to calculate the impedance in Eq. 7. The impedance calculation method for the power supply network shown in Eq. 25 only requires one disturbance injection, which greatly reduces the complexity of impedance identification.
4.2 Dq-frame voltage/current extractions at the corresponding positive and negative frequencies
From (Fu and Zhou, 2023), it can be seen that the dq-frame voltage/current data at positive/negative frequencies is the key to calculate Zdq. Therefore, the following contents will introduce how to obtain these dq-frame voltage/current data.
For the rotation factor at positive frequency (forward rotation), there is the following relationship.
where, ejωt is the forward rotation factor. Further, if exchanging the values of α and β, the new phasor can be obtained by
Notably, the phase of the calculated impedance is the difference between the voltage and current phases. Based on this, the phase shift of 90° in Eq. 27 can be eliminated, and the reverse rotation factor e-jωt can be obtained. Further, comparing (Chen et al., 2023a; Chen et al., 2023b), it can be found that exchanging the values of α and β is equivalent to transforming the original forward rotation into reverse rotation.
To extract the dq-frame voltage/current, firstly, the Hilbert transform presented in Section 2.2 is utilized to obtain the αβ-frame values. Then, based on the forward and reverse rotation principles mentioned above, combined with αβ→dq transform in Section 2.3, the dq-frame voltage/current data can be obtained. In detail, the forward-rotation Udqf+ and Idqf+ can be obtained with the principle presented in Eq. 26, and the reverse-rotation Udqf− and Idqf− can be obtained with the principle shown in Eq. 27.
4.3 Proposed wideband impedance identification steps
To make the proposed dq-frame wideband impedance identification method of the power supply network clearer, this section provides the detailed identification steps, which are shown below.
Step 1: Inject a wideband disturbance into the test port of the power supply network. Notably, the disturbance does not depend on a particular mode, and the disturbance generated by any wideband disturbance device can be used here.
Step 2: Collect the voltage and current response data of the test port.
Step 3: Utilize the α→αβ transform and the αβ→dq transform, combined with the forward rotation transformation, and the dq-frame data Udqf+ and Idqf+ can be obtained.
Step 4: Similar to step 3, combined with the reverse rotation transformation, Udqf− and Idqf− can be obtained.
Step 5: Calculate the impedance to obtain Zdq with Eq. 25.Further, for the disturbance-based impedance measurement, the selection of disturbance energy is crucial. Excessive disturbance energy can threaten the normal operation of the system, while low disturbance energy can lead to inaccurate measurement results. In the actual measurement process, the disturbance energy can be minimized first, and then gradually increased until satisfactory measurement accuracy is achieved. Noteworthily, during this process, the total harmonic distortion (THD) of the system should not exceed the standard (IEEE Std 519-2014).
5 Additional Requirements
5.1 Simulation results with injecting PWM-based wideband disturbance
Taking the second-order power supply network structure as an example, its detailed parameters are listed in Table 1. In addition, the PWM-based wideband disturbance injection method is detailed in (Pan et al., 2018), and its corresponding parameters are shown in Table 2. For example, when the target impedance identification frequency reaches to 8,000 Hz and the frequency resolution is 10 Hz, in order to better cover this frequency band with the PWM-based disturbance, the frequency of PWM should be set to 10 Hz and the duty cycle can be set to 0.1%. Further, the simulation time step is set as 1 × 10⁻⁶ s.
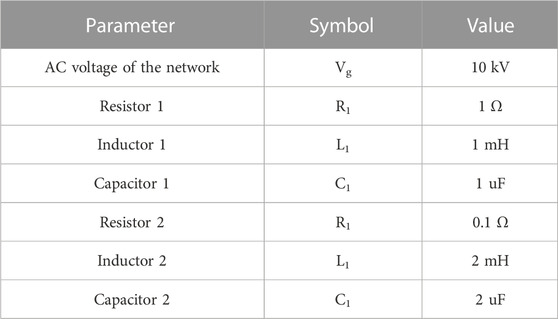
TABLE 1. Parameters of power supply network.
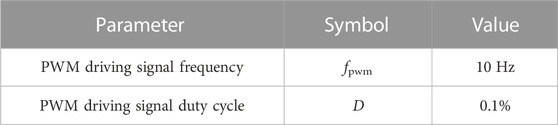
TABLE 2. Parameters of PWM-based wideband disturbance.
The proposed dq-frame impedance identification method is utilized to the simulation model, and the identified results are shown in Figure 5. The red solid lines represent the dq-frame impedance reference values, and the blue circles denote the identified dq-fame impedances. As can be seen, the identified dq-frame impedances, including their magnitudes and phases, can be well consistent with the reference values, which verifies the correctness of the proposed method. In addition, for the phase curve of the Zdq element, some points around approximately 5,000 Hz do not coincide with the reference value. However, it is a normal phenomenon because the phase angles of these points are approximately 180° and −180°, which are equivalent for the identified impedance.
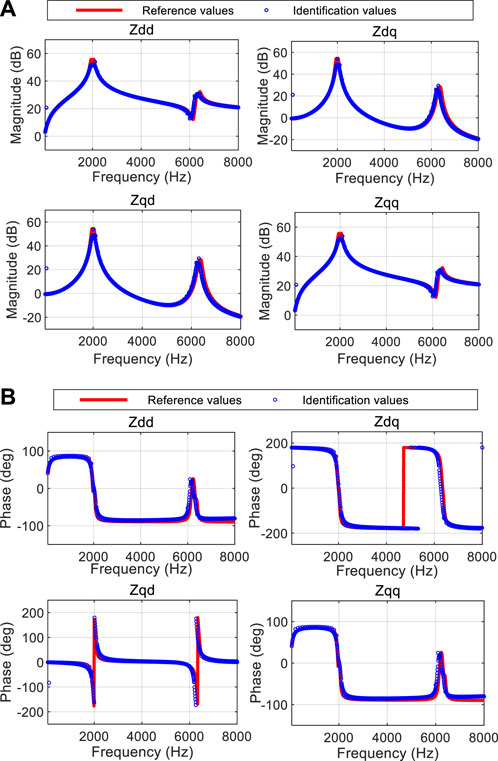
FIGURE 5. Identification results with injecting PWM-based wideband disturbance. (A) Impedance magnitudes. (B) Impedance phases.
5.2 Simulation results with injecting chirp-based wideband disturbance
The chirp-based wideband disturbance is detailed in (Hu et al., 2020b), and its corresponding parameters are shown in Table 3. Consistent with the identification objectives in Section 5.1, the specified minimum and maximum frequencies are set as 10 Hz and 8,000 Hz, respectively, to cover the target frequency band, and the time cycle of the chirp signal is set as 0.1s to meet the frequency resolution.

TABLE 3. Parameters of chirp-based wideband disturbance.
Similar to Section 5.1, the impedance identification results by the proposed dq-frame impedance identification method are shown in Figure 6. The red solid lines also represent the impedance reference values, and the blue circles are the identified dq-fame impedances. As can be seen, the identified dq-frame impedances of the power supply network can be also well consistent with the references, and the correctness of the proposed method is further verified. Furthermore, under the above two types of wideband disturbances, the proposed impedance identification method can identify the accurate dq-frame impedance. It is also verified that the proposed method does not rely on a particular disturbance mode.
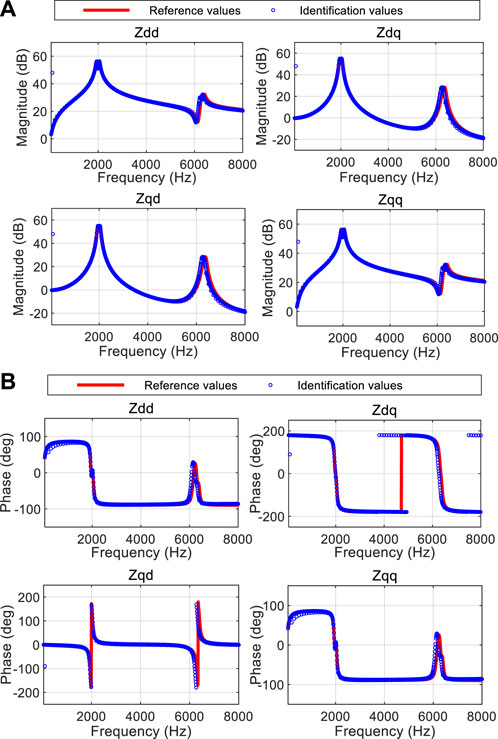
FIGURE 6. Identification results with injecting chirp-based wideband disturbance. (A) Impedance magnitudes. (B) Impedance phases.
6 Conclusion
In this article, an improved dq-frame wideband impedance identification method with only one disturbance is proposed to identify the power supply network impedance. This proposed method is based on the forward- and reverse-rotation dq-frame data extractions. Also, the proposed method has been validated through a simulation model based on MATLAB/SIMULINK. Some valuable conclusions can be drawn.
1) For the power supply network, the impedance expressions at the positive and negative frequencies are consistent. Therefore, this characteristic can be used to expand a set of dq-frame voltage/current data for impedance calculation, which reduces the traditional multiple wideband disturbance injection to only once and improving the impedance identification efficiency.
2) For power supply network, from the impedance identification results, it can be seen that the four elements of dq-frame impedance are symmetrical, so there is no need to consider the frequency interference caused by asymmetric characteristics. Therefore, for wideband disturbances, it does not rely on a particular disturbance mode, which has higher practicality.
Data availability statement
The original contributions presented in the study are included in the article/supplementary material, further inquiries can be directed to the corresponding author.
Author contributions
CZ: Conceptualization, Software, Validation, Writing–review and editing. KW: Conceptualization, Investigation, Methodology, Writing–original draft. XY: Investigation, Methodology, Writing–review and editing. HL: Software, Validation, Writing–review and editing.
Funding
The author(s) declare financial support was received for the research, authorship, and/or publication of this article. This research was funded by the State Grid Gansu Electric Power Marketing Service Center Technology Project, grant number SGYXXYTJS2200032.
Conflict of interest
Authors CZ and KW were employed by Gansu Electric Power Company.
The remaining authors declare that the research was conducted in the absence of any commercial or financial relationships that could be construed as a potential conflict of interest.
Publisher’s note
All claims expressed in this article are solely those of the authors and do not necessarily represent those of their affiliated organizations, or those of the publisher, the editors and the reviewers. Any product that may be evaluated in this article, or claim that may be made by its manufacturer, is not guaranteed or endorsed by the publisher.
References
Alves, D. K., Ribeiro, R. L. A., Costa, F. B., and Rocha, T. O. A. (2019). Real-time wavelet-based grid impedance estimation method. IEEE Trans. Power Electron. 66 (10), 8263–8265. doi:10.1109/tie.2018.2870407
Chen, J., Ge, Y., Wang, K., Hu, H., He, Z., Tian, Z., et al. (2023a). Integrated regenerative braking energy utilization system for multi-substations in electrified railways. IEEE Trans. Industrial Electron. 70 (1), 298–310. doi:10.1109/tie.2022.3146563
Chen, J., Zhao, Y., Wang, M., Wang, K., Huang, Y., and Xu, Z. (2023b). “Power sharing and storage-based regenerative braking energy utilization for sectioning post in electrified railways,” in IEEE transactions on transportation electrification (Germany: IEEE). (Early access).
Fu, X., Wu, X., Zhang, C., Fan, S., and Liu, N. (2022). Planning of distributed renewable energy systems under uncertainty based on statistical machine learning. Prot. Control Mod. Power Syst. 7, 41. doi:10.1186/s41601-022-00262-x
Fu, X., and Zhou, Y. (2023). Collaborative optimization of PV greenhouses and clean energy systems in rural areas. IEEE Trans. Sustain. Energy 14 (1), 642–656. doi:10.1109/tste.2022.3223684
Hara, S., Douzono, H., Imamura, M., and Yoshioka, T. (2022). Estimation of photovoltaic cell parameters using measurement data of photovoltaic module string currents and voltages. IEEE J. Photovoltaics 12 (2), 540–545. doi:10.1109/jphotov.2021.3135262
Hassan Zamani, M., Hossein Riahy, G., and Abedi, M. (2016). Rotor-speed stability improvement of dual stator-winding induction generator-based wind farms by control-windings voltage-oriented control. IEEE Trans. Power Electron. 31 (8), 5538–5546. doi:10.1109/tpel.2015.2495256
Hu, H., Pan, P., Song, Y., and He, Z. (2020b). A novel controlled frequency band impedance measurement approach for single-phase railway traction power system. IEEE Trans. Ind. Electron. 67 (1), 244–253. doi:10.1109/tie.2019.2896297
Hu, H., Zhou, Y., Li, X., and Lei, K. (2020a). Low-frequency oscillation in electric railway depot: A comprehensive review. IEEE Trans. Power Electron. 36 (1), 295–314. doi:10.1109/TPEL.2020.2998702
Jakšić, M., Shen, Z., Cvetkovic, I., Boroyevich, D., Burgos, R., DiMarino, C., et al. (2017). Medium-voltage impedance measurement unit for assessing the system stability of electric ships. IEEE Trans. Energy Convers. 32 (2), 829–841. doi:10.1109/tec.2017.2692275
Jing, H., Corzine, K. A., and Belkhayat, M. (2009). Small-signal impedance measurement of power-electronics-based ac power systems using line-to-line current injection. IEEE Trans. Power Electron. 24 (2), 445–455. doi:10.1109/tpel.2008.2007212
Jordan, M., Langkowski, H., Thanh, T. D., and Schulz, D. (2011). Frequency dependent grid-impedance determination with pulse-width-modulation signals. Proc. 7th Int. Conf.-Workshop Compat. Power Electron., 131–136.
Asiminoaei, L., Teodorescu, R., Blaabjerg, F., and Borup, U., "A new method of on-line grid impedance estimation for PV inverter," Nineteenth Annual IEEE Applied Power Electronics Conference and Exposition, 22-26 February 2004, 2004. APEC '04., Anaheim, CA, USA, pp. 1527–1533.
Lin, S., Liu, L., Sun, P., Lei, Y., Teng, Y., and Li, X. (2020a). Fault location algorithm based on characteristic-harmonic measured impedance for HV dc grounding electrode lines. IEEE Trans. strum. Meas. 69 (12), 9578–9585. doi:10.1109/tim.2020.3004682
Lin, S., Mu, D., Liu, L., Lei, Y., and Dong, X. (2020b). A novel fault diagnosis method for DC filter in HVDC systems based on parameter identification. IEEE Trans. strum. Meas. 69 (9), 5969–5971. doi:10.1109/tim.2020.3003362
Berg, M., Messo, T., Roinila, T., and Alenius, H., "Impedance measurement of megawatt-level renewable energy inverters using grid-forming and grid-parallel converters," 2018 International Power Electronics Conference (IPEC-Niigata 2018 -ECCE Asia), Niigata, 24th May 2018, Japan, pp. 4205–4212.
Pan, P., Hu, H., He, Z., and Li, Y. (2021b). Rapid impedance measurement approach based on wideband excitation for single phase four-quadrant converter of high-speed train. IEEE Trans. strum. Meas. 70, 1–11. doi:10.1109/tim.2021.3107048
Pan, P., Hu, H., Xiao, D., Song, Y., and He, Z. (2021a). An improved controlled-frequency-band impedance measurement scheme for railway traction power system. IEEE Trans. Ind. Electron. 68 (3), 2184–2195. doi:10.1109/tie.2020.2972469
Pan, P., Hu, H., Yang, X., Blaabjerg, F., Wang, X., and He, Z. (2018). Impedance measurement of traction network and electric train for stability analysis in high-speed railways. IEEE Trans. Power Electron. 33 (12), 10086–10100. doi:10.1109/tpel.2018.2836660
Pegoraro, P. A., Brady, K., Castello, P., Muscas, C., and Meier, A. V. (2019). Line impedance estimation based on synchro-phasor measurements for power distribution systems. IEEE Trans. strum. Meas. 68 (4), 1002–1013. doi:10.1109/tim.2018.2861058
Rebello, E., Watson, D., and Rodgers, M. (2019). Performance analysis of a 10-mw wind farm in providing secondary frequency regulation: experimental aspects. IEEE Trans. Power Syst. 34 (4), 3090–3097. doi:10.1109/tpwrs.2019.2891962
Roinila, T., Messo, T., and Santi, E. (2018). MIMO-identification techniques for rapid impedance-based stability assessment of three-phase systems in DQ domain. IEEE Trans. Power Electron. 33 (5), 4015–4022. doi:10.1109/tpel.2017.2714581
Salis, V., Costabeber, A., Cox, S. M., Tardelli, F., and Zanchetta, P. (2019). Experimental validation of harmonic impedance measurement and ltp Nyquist criterion for stability analysis in power converter networks. IEEE Trans. Power Electron. 34 (8), 7972–7982. doi:10.1109/tpel.2018.2880935
Wu, S., Liu, Z., Li, Z., Zhang, H., and Hu, X. (2020). Impedance modeling and stability analysis in vehicle-grid system with CHB-STATCOM. IEEE Trans. Power Syst. 35 (4), 3026–3039. doi:10.1109/tpwrs.2020.2963897
Xie, X., Zhang, X., Liu, H., Liu, H., Li, Y., and Zhang, C. (2017). Characteristic analysis of sub synchronous resonance in practical wind farms connected to series-compensated transmissions. IEEE Trans. Energy Convers. 32 (3), 1117–1126. doi:10.1109/tec.2017.2676024
Zhang, Y., Klabunde, C., and Wolter, M. (2020). Frequency-coupled impedance modeling and resonance analysis of dfig-based offshore wind farm with HVDC connection. IEEE Access 8, 147880–147894. doi:10.1109/access.2020.3015614
Keywords: wideband impedance identification, dq-frame impedance, power supply network, power-electronic-based power system, wideband disturbance
Citation: Zhao C, Wei K, Yan X and Lin H (2023) An improved dq-frame wideband impedance identification method for power supply network with only one disturbance. Front. Energy Res. 11:1259865. doi: 10.3389/fenrg.2023.1259865
Received: 17 July 2023; Accepted: 09 August 2023;
Published: 24 August 2023.
Edited by:
Xueqian Fu, China Agricultural University, ChinaReviewed by:
Salman Aatif, University of Engineering and Technology, Peshawar, PakistanJunyu Chen, Hong Kong Polytechnic University, Hong Kong SAR, China
Bingbing Shao, Hefei University of Technology, China
Copyright © 2023 Zhao, Wei, Yan and Lin. This is an open-access article distributed under the terms of the Creative Commons Attribution License (CC BY). The use, distribution or reproduction in other forums is permitted, provided the original author(s) and the copyright owner(s) are credited and that the original publication in this journal is cited, in accordance with accepted academic practice. No use, distribution or reproduction is permitted which does not comply with these terms.
*Correspondence: Xing Yan, eGluZ3lhbjA5MTJAMTYzLmNvbQ==