 Zhong-Yi Wang
 Chenxin He
 Yue Wu2
- 1College of Power and Energy Engineering, Harbin Engineering University, Harbin, Heilongjiang, China
- 2Unit 92942 of the People’s Liberation Army of China, Beijing, China
According to the use of marine gas turbines, inlet distortion is caused by the bending of the compressor inlet port. The total pressure distortion is the external stability reduction factor that has the greatest impact on the engine’s aerodynamic stability. This research designs a pressure distortion simulation device, which achieves the goal of providing the target distortion flow field for marine compressors by inserting plugboards of different heights and shapes into the inlet duct. The variation pattern of the entire flow field after inserting different parameter plugboards is obtained through distortion experiments and numerical simulations. Summarizes a prediction formula for total pressure distortion under different working conditions, with a verified error of less than 1.5%. In addition, the straight plugboard is changed to arc plugboard or concave and convex plugboard, the total pressure distortion distribution pattern can be changed while the range of the circumferential low-pressure zone remains unchanged. The distortion index of the distortion simulator designed by this research institute can be adjusted within the range of 0.5%–5%, while providing various distortion pattern. The distortion simulator meets the requirements of the comprehensive distortion index needed for the relevant distortion test of the marine engine and provides assistance for ship engine design and optimization.
1 Introduction
The engine may experience decreased performance due to an uneven intake flow field during operation, resulting from changes in the external environment and its own operating conditions. The study of inlet distortion is essential in engine development processes. If the influence of flow field distortion factors is not considered, excessive flow field distortion at the inlet may result in compressor instability and have serious consequences. With the increasing attention on the inlet flow field distortion, various simulation technologies for inlet distortion have emerged as the need arises. Through these simulation technologies, a flow field with the same effect as the inlet distortion can be generated, allowing for efficient and rapid experimentation related to engine distortion, thus providing assistance in anti-distortion design and optimization. Common simulation technologies for total pressure distortion include simulation network technology, turbulence generator, air jet distortion simulator, simulation board technology, plugboard simulation technology, etc.
Regarding the simulation of total pressure distortion, scholars have conducted extensive research in the field of testing and simulation. Since the 1960s, organizations such as AEDC and NASA in the United States have developed devices such as distortion screens (Bobula, 1979), plane wave method (Kutschenreuter et al., 1973), random frequency distortion generators, and air jet distortion simulation generators to achieve distortion simulation (Braithwaite et al., 1970; Meyer et al., 1970; Overall and Harper, 1974; Hubble and Smith, 1979; Mcllveen, 1979; Beale et al., 2002; Beale et al., 2006; Beale et al., 2007) and others have introduced research on transient total pressure distortion simulation technology and proposed concepts such as total temperature distortion simulation devices and eddy current distortion simulation devices based on the characteristics of various simulation devices. Zhang et al. (2017) designed a crescent-shaped pressure distortion simulator with a continuously adjustable distortion index achieved by increasing the curvature of the plugboard. Naseri et al. (2012) used a jet injector to simulate steady-state circumferential intake distortion on a micro jet engine test rig. With the development of distortion simulation, scholars have proposed new methods such as the delta wing method, blade method, square cylinder method, strip distortion generator, complex total pressure distortion screen, curved edge plate, and swirl chamber method (Mankbadi and Georgiadis, 2015; Yusoof and Deshpande, 2015; Sivapragasam, 2019; Cheng et al., 2020; Song et al., 2021). Wu et al. (2022) used the BP ANN method to predict the dynamic distortion flow field of a crescent shaped distortion generator. Through numerous experiments, the United States has developed definition criteria and relevant industry standards for aerospace inlet distortion (SAE S-16 Committee ARP 1420, Revision B, 2002; SAE Aerospace Information Report AIR-1419, 1999). However, China and Russia typically use the plugboard method for total pressure equivalent simulation. Conduct compressor distortion experiments using distortion generators such as straight plates, controllable moving plates, and double plate (Xia et al., 2018; Tu et al., 2021; Chen et al., 2023), the influence of different types of plugboard devices on compressor inlet flow field parameters is analyzed, and the reasons for compressor early stall caused by distortion are summarized (Jiang et al., 2007; Jiang et al., 2009; Zhang et al., 2019; Liu et al., 2022; Liu et al., 2022).
In order to analyze the impact of distortion on the compressor, scholars combined numerical simulation methods to further study the flow field of the compressor under distortion conditions. Many scholars’ research (Jinghua and Baofeng, 2015; Zhang et al., 2017; Maghsoudi et al., 2020; Chen et al., 2023) has shown that under different operating conditions, the plugboard has a significant impact on the different pressure distortion indices DC (90°), DC (60°), and PC/P of the measuring cross-section section, leading to circumferential flow in the rotor inlet section, disturbance of corner vortices on rotor tip leakage vortices, and changes in shock waves and positions. These factors affect the stable boundaries of low-speed, subsonic, and transonic compressors, leading to early stall of the compressor. By combining novel simulation models such as three-dimensional torsional force model, time-stepping simulation, and RANS/LES hybrid method, enhancements in both computational efficiency and simulation accuracy have been achieved. Through more comprehensive capture of flow field details, conducted thorough analysis of the impact of parameters, such as inlet conditions and plugboard types, on the internal flow of pipelines and compressors (Yin et al., 2015; Zhou et al., 2017; Zhou et al., 2018; Liu et al., 2021; Liu et al., 2021).
While numerous scholars have extensively researched the equivalent simulation of inlet distortion, there exists a notable gap in relevant studies concerning inlet distortion in marine gas turbines. Consequently, this study focuses on the equivalent simulation of inlet distortion in marine compressors and analyzes the impact of insertion plate parameters on distortion through approach combining experiments and simulations. Describe the simulation method and experimental verification results in Section 2; In Section 3, the impact of changes in parameters such as plugboard height and shape on the flow field is discussed. Finally, Section 4 provides a summary of the research findings.
2 Methods
2.1 Distortion equivalent simulation test rig
The distortion equivalent simulation test rig is shown in Figure 1A). The inlet of the test rig consists of a twisted pair flowmeter DLN-DN365, followed by a connecting segment and a pressure stabilizing chamber. The twisted pair flowmeter is a throttling flow meter, with its inlet surface consisting of a twisted pair wire rotating 360°, which then smoothly transitions to the cylindrical segment. This design ensures minimal pressure loss of air entering the flow meter, allowing for the neglect of throttling loss impact on the flow rate. Calculate the experimental flow rate using Eq. 1. During the experiment, the pressure difference at the measuring point is obtained using the differential pressure sensor MG 2000. The atmospheric temperature and pressure are acquired through the temperature sensor PT100 and absolute pressure sensor 3351AP. Real-time display of the flow rate is facilitated by the flow integrator F2000X, with the error of this flow measurement system being less than 1%.
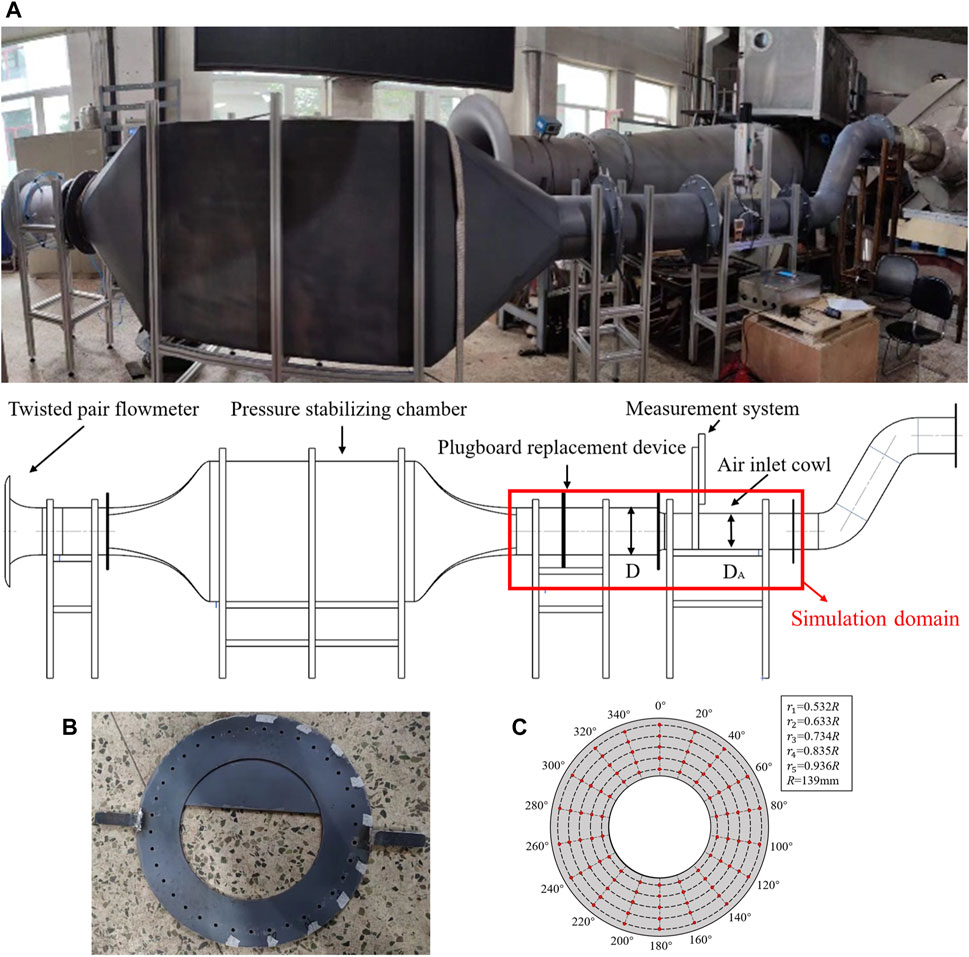
FIGURE 1. The distortion equivalent simulation test rig.
The inlet and outlet curves of the pressure stabilization chamber are Vickers curves, with a contraction ratio of 1:3. A convergent transition pipe is used to reduce the inner diameter to D = 365 mm. Different plugboard replacement devices (show in Fingure(b)) with various plugboard modes can be assembled between the transition pipe section and the air inlet cowl.
To assess the steady-state total pressure distortion on the compressor inlet surface AIP (Aerodynamic Interface Plane), located 250 mm away from the inlet fairing, a flow field parameter measurement system is installed at this specific location. The system consists of a probe, a probe displacement mechanism, and a flow field parameter acquisition and processing system RET-400. The displacement mechanism has a stroke of 200 mm and an accuracy of 0.01 mm. The flow field parameter acquisition and processing system offer a range of ±20 KPa and an accuracy of 1%. The measured AIP section is circular ring cross-section, with an outer diameter Dout and an inner diameter Din of 278 mm and 131mm, respectively. Multiple groups of data are collected at each measurement point and calculated by the flow field parameter acquisition and processing system to obtain an average value. After completing the radial five-point measurement, the plugboard replacement device’s circumferential rotation function is utilized to collect data from ninety measurement points on the AIP section. Finally, the AIP sectional flow field parameters are obtained, and the non-uniformity of the AIP section flow field is analyzed.
2.2 Plugboard parameters
In order to obtain various distortion pattern to meet the relevant distortion test requirements, select the height of the plugboard as the main research parameter, and the study is carried out in combination with the shape of the plugboard, as shown in Figure 2C. The shortest distance H from the plugboard to the center is defined as the plugboard height, and the effect of changing the plugboard height on the flow field is studied. Change the shape of the plugboard based on the plugboard with H = 100 mm and define the distances C and Z from the arc plate and the concave and convex plate to the center. Conduct dimensionless processing on each parameter h = H/D, c = C/D and z = Z/D, analyze the impact of various parameter changes on the total pressure distribution on the AIP surface, and summarize the influence of plugboard parameters on total pressure distortion.
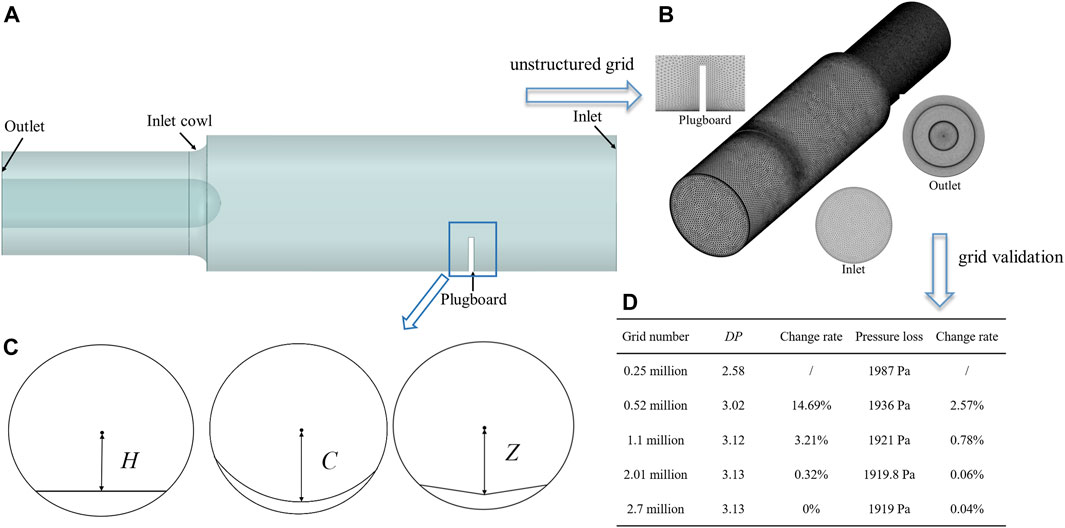
FIGURE 2. Grid independence verification.
2.3 Distortion assessment method
To quantify the non-uniformity of the inlet flow field of the compressor, the experimental and simulation results are analyzed using the non-dimensional parameter distortion index. Based on the characteristics of ship distortion, velocity distortion
The definition method of total pressure distortion DP degree is to divide the solution area, taking 1/6 of the ring area, which is divided into every 60 sector angle, firstly obtain the average total pressure
2.4 Ω criterion
In 2016, Liu et al. proposed the Ω criterion vortex identification method based on the second-generation vortex identification method (Q criterion, etc.). This method decomposes vorticity using the concepts of rotating and non-rotating parts for the first time. Choosing a reasonable threshold Ω within the range of 0–1 can effectively identify the vortex structure in the flow field. In the calculation process, the velocity gradient tensor is decomposed into a symmetric tensor A representing fluid deformation and an antisymmetric tensor B representing fluid rotation. Determine the vortex structure based on the proportion of rotation effect in the entire velocity gradient tensor. The calculation formula is as follows:
During the calculation process of Eq. 4, there may be situations where the values of A and B are small, leading to calculation errors. Therefore, a small positive number
A large number of related experiments have shown that when Ω is greater than 0.52, the main vortex structures in the flow can be clearly identified.
2.5 Modeling and simulation validation
The simulation domain is shown in Figure 2A, which corresponds to the labeled area in Figure 1. The calculation domain includes the test section, plugboard replacement device, air inlet cowl, and measurement section. Figure 2B is a schematic diagram of unstructured grid partitioning of the computational domain using the Fluent Meshing tool module. Due to the complexity of the model’s structure, the grid is densified in the key survey section and the smaller parts of the structure. To ensure computational accuracy, the boundary layer was refined to ensure that is y+ less than 100, meeting the requirements of the turbulence model. The mainstream within the computational domain is characterized by subsonic, compressible, and ordinary temperature, with a Reynolds number exceeding 10,000, thereby indicating fully developed turbulence. Choose Fluent software for numerical solution based on the research object. The gradient discretization scheme utilized the Least Squares Cell-Based approach, while the pressure discretization employed the Second Order scheme. Discretization for density, momentum, energy, and other parameters followed the Second Order Upwind method, and calculations are conducted using the k-ε turbulence model. The inlet of the computational domain is configured as pressure boundary, specifying total pressure of 101,325 Pa and temperature of 288.15 K. The outlet of the computational domain is set as pressure outlet, with a target mass flow rate specified as 7.5 kg/s. Grid independence verification is performed for five different mesh distribution schemes to ensure the effectiveness of the grid generation method (Kan et al., 2021a; Kan et al., 2021b). As observed in Figure 2D, it can be noted that the total pressure loss and the relative variation in pressure parameters remain essentially constant when the grid count exceeds 1.1 million. Consequently, considering the achievable maximum accuracy and the available computational resources, a grid scheme consisting of 1.1 million cells is selected to simulate the flow characteristics downstream of the plugboard.
2.6 Test verification
Use Eq. 7 to process the data of 90 measuring points of the AIP section, calculate the measured total pressure and static pressure according to the local temperature, atmospheric pressure and other data, and convert them into the velocity value of the measured section.
In the above formula, v represents the velocity value at this point, Ps represents the static pressure value, and PT represents the total pressure value. After performing calculations, the velocity nephogram of the AIP cross-section experiment and simulation comparison is shown in Figure 3. After processing the simulation results obtain the average velocity of the AIP surface
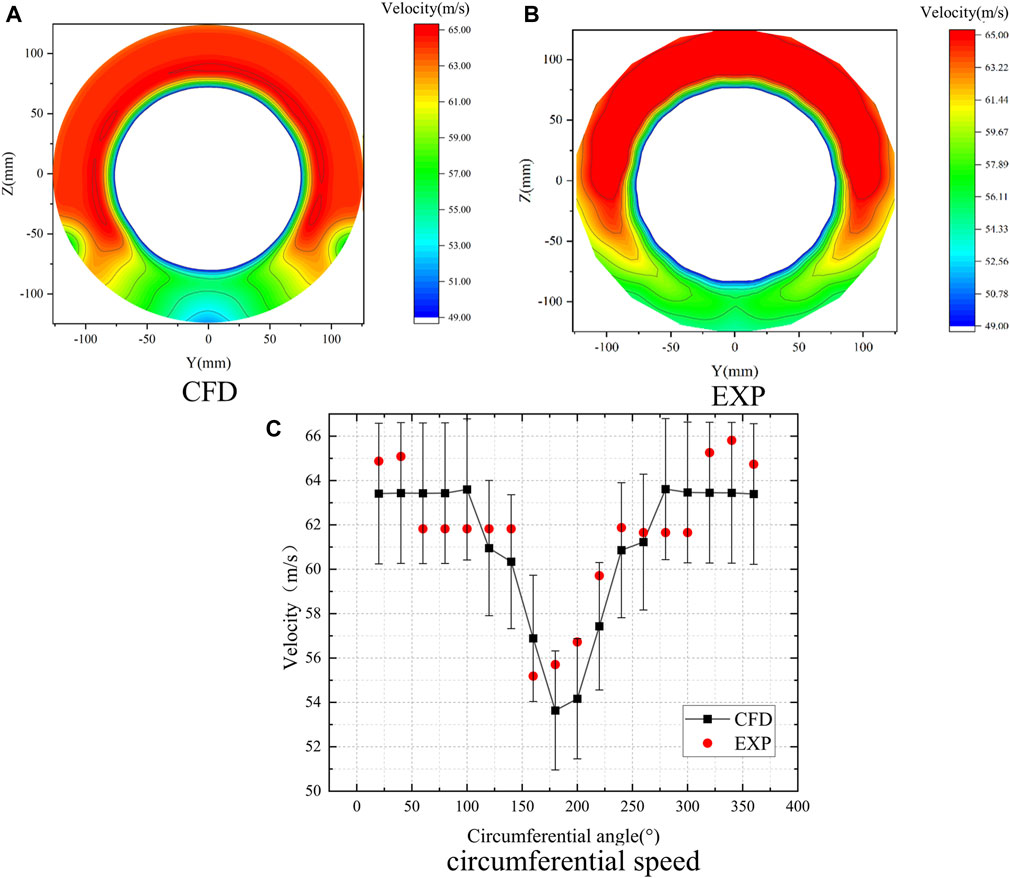
FIGURE 3. Verification of simulation results.
3 Results and discussion
Using the rated operating state of a ship compressor with 7.5 kg/s (n1r = 100%) as an example, the flow structure variation of the flow field after the plugboard is analyzed. Figure 4 shows the velocity distribution and three-dimensional streamline of five cross sections with an interval of 250 mm along the flow direction after the plugboard. It can be observed that the blocking effect of the plugboard on the mainstream causes it to be divided into two strands. The airflow that is not affected by the plugboard increased in speed due to a decrease in the flow area. And some of the airflow bypasses the plugboard, forming a large range of strong eddies due to the blockage of the plugboard, forming a low-pressure and low-speed zone. Under the influence of the plugboard, there is a significant non-uniformity in the flow. Although the continuous mixing of the airflow and the rectification effect of the inlet cowl effectively weaken the non-uniformity of the flow, there is still a clear low-pressure and low-speed zone at the inlet section of the compressor.
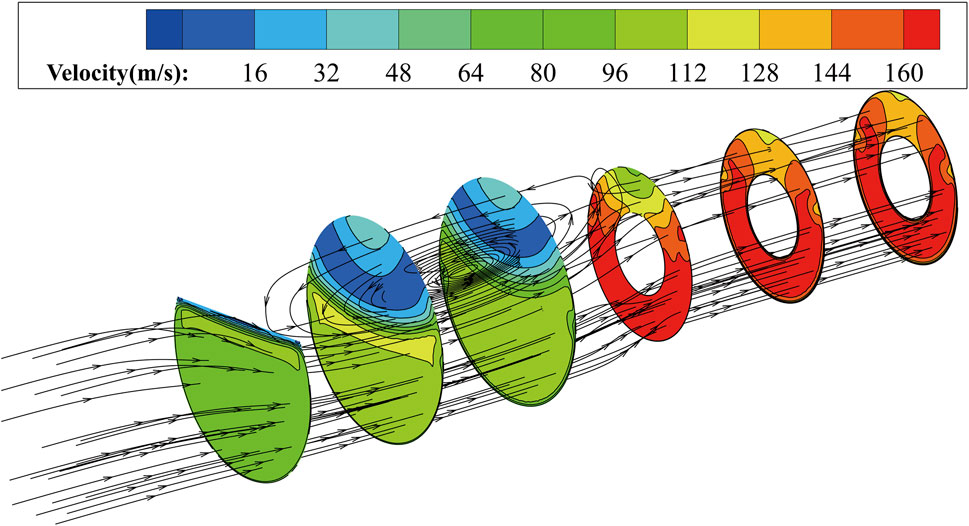
FIGURE 4. Velocity nephogram and streamline of each section.
In order to study the flow structure of the plugboard in detail, the total pressure, Mach number, and velocity vector of the Y and Z direction cross-section are analyzed (as shown in Figure 5). The analysis revealed that the large area reflux zone after plugboard has a relatively high flow velocity in the external and whereas the flow velocity inside the reflux zone remains at only 0.05 Ma. This process leads to substantial flow losses, resulting in a significant decrease in total pressure compared to the inlet pressure. Meanwhile, when the airflow bypasses the plugboard, the flow area decreases, and radial velocity is generated due to shear force, creating a high-speed flow area behind the board. The high-speed region experiences a decrease followed by an increase in the flow area under the influence of shear forces. Downstream of the plugboard, the airflow accelerates to the max 0.35 Ma. A transition zone forms between the low-speed reflux area and the high-speed area behind the board. The momentum transfer and continuous mixing of the airflow behind the plate, along with the wall viscous effect, blur the boundary between the high and low-pressure zones. This leads to a reduction in flow non-uniformity. The shape of the inlet cowl has a rectifying effect on the airflow, which can further reduce the non-uniformity of the flow, but cannot completely eliminate the distortion of total pressure and velocity.
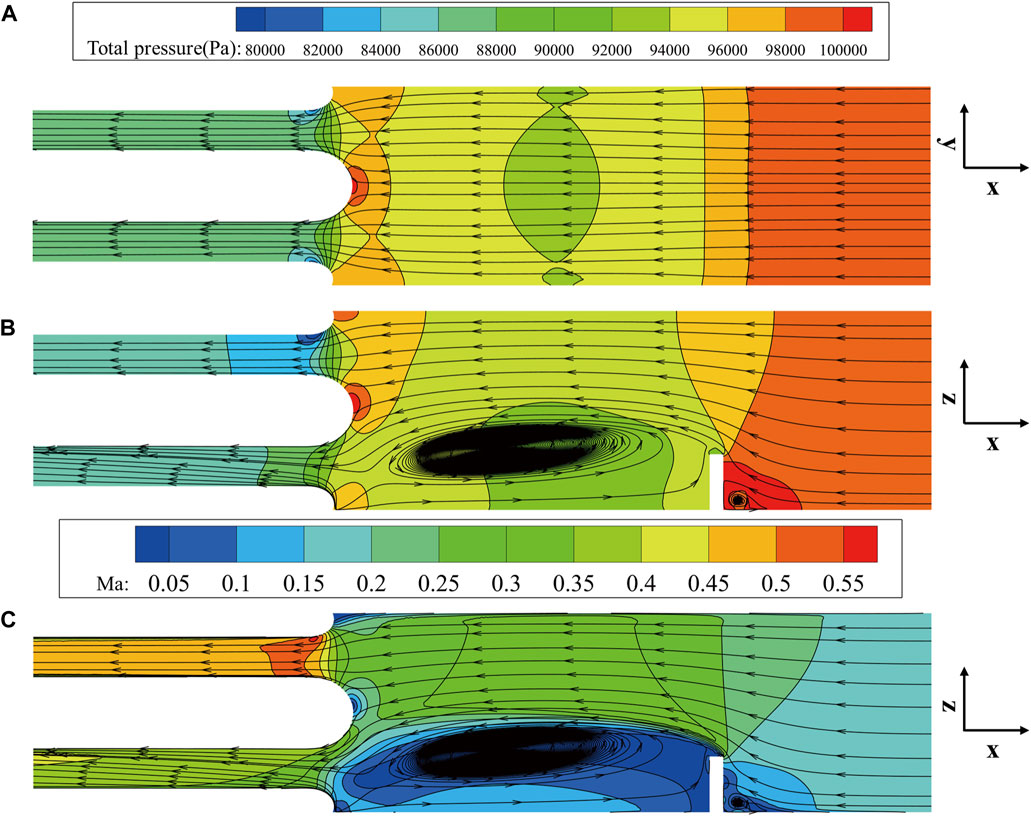
FIGURE 5. Total pressure Ma and streamline diagram.
Figure 6 and Figure 7 show the distribution of AIP cross-sectional flow field parameters. The section pressure of AIP is 99.3 kPa. The area where the pressure is lower than this value constitutes the low-pressure area, with an average pressure of 97.7 kPa. From the figure, it can be observed that the low-pressure area occupies a significant portion of the entire AIP section. By using linear difference analysis, it has been determined that the low-pressure area spans from 120° to 240°, amounting to a range of 120° which accounts for 33% of the compressor inlet plane.
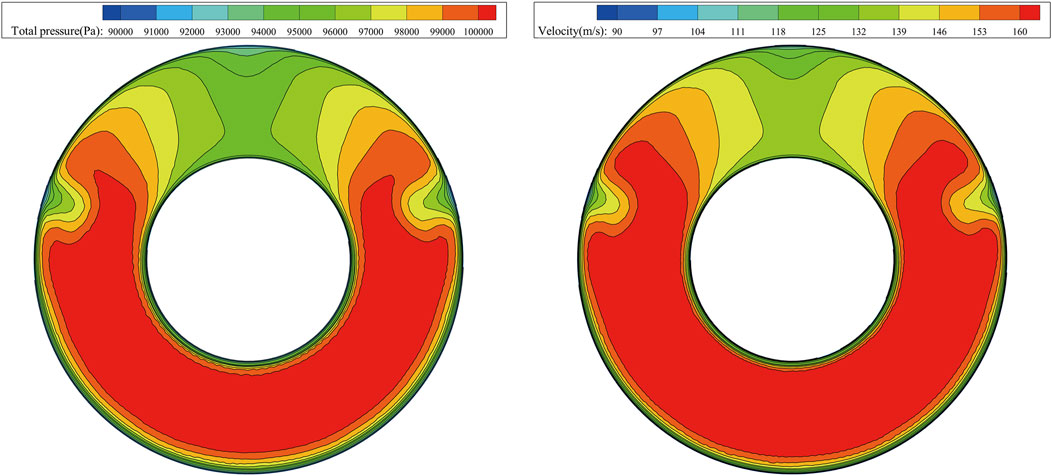
FIGURE 6. Total pressure and Ma contour of AIP section.
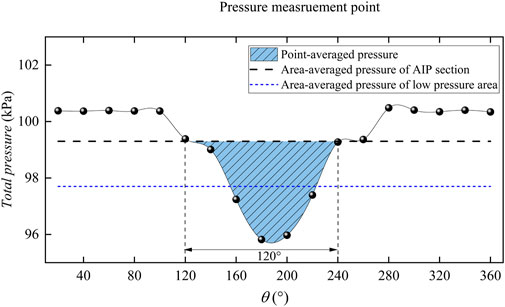
FIGURE 7. Identification of the low pressure area in AIP section.
In order to investigate the impact of plugboard depth on the flow field, the plugboard is operated at the rated flow rate. Figure 8 shows the changes in the flow field behind the plugboard as the depth of the plugboard changes. To assess the influence of h, record the total pressure of the cross section every 250 mm after the plugboard and display the streamline in the entire flow area. With an increase in the depth of the plugboard, the area of backflow behind the board also increases. During the analysis of the plugboard’s flow field, it is concluded that a high and low pressure zone will form behind the plate. As the relative depth h of the plugboard increases, the area ratio of the plugboard to the inlet section increases, and its blocking effect on the airflow increases, leading to a further decrease in the total pressure value in the low-pressure zone. Additionally, an increase in h will result in more flow blockage. When h = 0.22, the reflux area accounts for 30% of the flow area, and when h = 0.36, the counter current area accounts for 80% of the flow area, resulting in increased flow loss, a wider range of low-pressure areas, and greater flow non-uniformity.
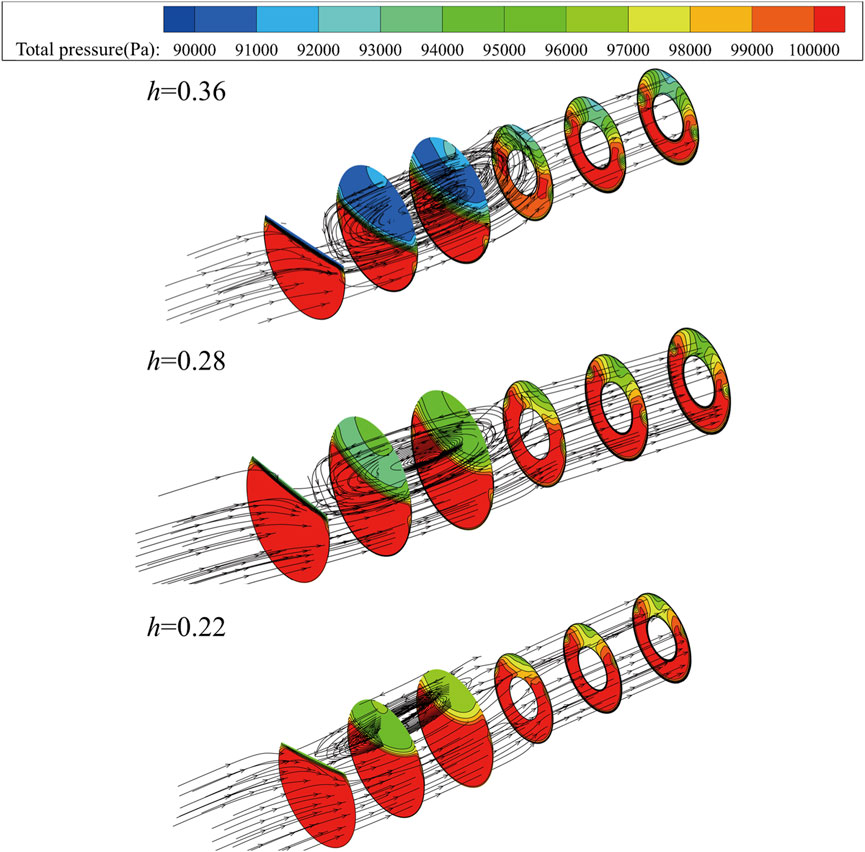
FIGURE 8. The flow fields behind the baffle under different baffle depths.
Figure 9 illustrates the changes in the total pressure nephogram of the AIP section under the condition of n1r = 100%. The total pressure distribution of the AIP section changes as the depth of the plugboard increases. The low-pressure area continuously expands, causing throttling of the airflow and consequently an increase in total pressure for the parts not covered by the plugboard. This leads to an enhancement in the overall total pressure non-uniformity of the AIP section. The average total pressure of the AIP section at five different insertion depths is as follows: 98.3kPa, 99.3kPa, 99.8kPa, 100.3kPa, and 100.5 kPa. Additionally, the average total pressure of the low-pressure area is 95.0, 96.7, 97.5, 98.2, and 98.1 kPa, respectively. The increase in plugboard depth results in a wider range of the low-pressure zone and a continuous increase in the total pressure loss of the AIP section.
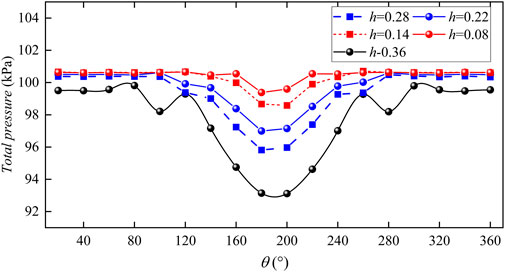
FIGURE 9. AIP section (n1r = 100%) under different plugboard depths.
Figures 10, 11 depict the variation in total pressure and DP counter of the AIP section under the condition of n1r = 100%. The starting and ending positions of the plugboards with different parameters in the circumferential direction of the flow path are identical, resulting in a nearly identical area of the low-pressure region in the AIP cross-section. However, when the straight plate is substituted with a circular arc plate or a concave-convex plate, the area of blockage by the plugboard alters. Consequently, the larger the blockage area, the greater the total pressure loss, leading to lower average total pressure across the AIP section and increased total pressure distortion. When compared with the straight plate, the arc plate affects the flow blockage to a greater extent than the concave-convex plate under the same h condition. Upon comparing the data in Figure 11, it becomes apparent that when the plugboard possesses a concave shape, the total pressure non-uniformity of the AIP section using the circular plate is less than that of the concave-convex plate. Conversely, when the plugboard has a convex shape, the total pressure non-uniformity of the AIP section using the circular plate is greater than that of the concave-convex plate. Through analysis, it is evident that changing the shape parameters of the plugboard can modify the total pressure distortion and yield expected distortion equivalent simulation results without altering the circumferential area of the low-pressure region in the AIP section.

FIGURE 10. Total pressure of AIP section (n1r = 100%) under different plugboard parameters.
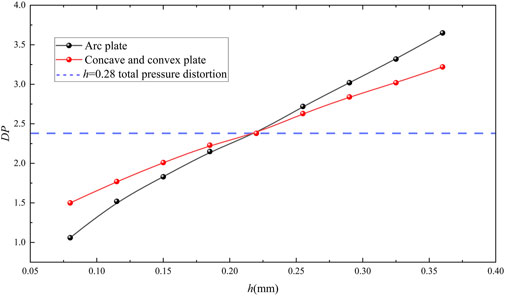
FIGURE 11. DP of AIP section (n1r = 100%) under different plugboard parameters.
The total pressure distortion DP of the AIP section under five working conditions of n1r = 20%–100% (inlet mass flow of 1.5–7.5 kg/s) and different plugboard heights is summarized in Figure 12. Increasing the working flow at the same plugboard height leads to higher flow velocity in the flow channel, greater difference between the low pressure and low-speed zone formed after the airflow is blocked by the plugboard and the main flow, increased flow non-uniformity after the plugboard, and greater distortion in the AIP section. Similarly, increasing the height of the plugboard at the same working flow rate also results in higher flow non-uniformity and distortion. The influence of plugboard height on total pressure distortion becomes stronger with increasing working flow. The working flow and plugboard height are positively correlated with the total pressure distortion of the AIP section. The relationship between h and DP under various working conditions is summarized in Figure 13, which also analyzes the relationship between h, DP, and n1r. Flow simulation is conducted under the conditions of n1r = 100%, h = 0.29, and under all operating conditions h = 0.21. The comparison error between the results and the relationship is less than 1.5%, confirming the accuracy of the relationship for predicting the total pressure distortion DP of the AIP section. Using this formula, the necessary plugboard parameters for the required distortion test conditions can be quickly obtained before conducting the compressor distortion test.
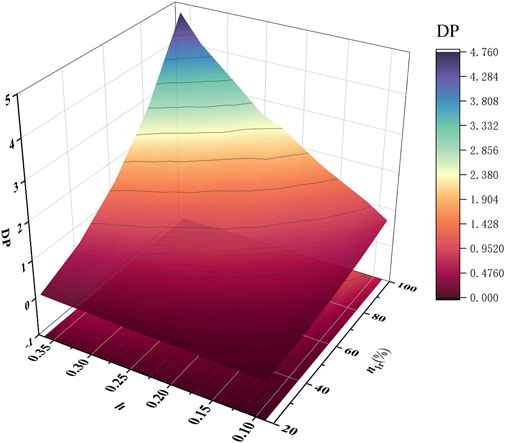
FIGURE 12. AIP section under different plugboard depths and n1r.
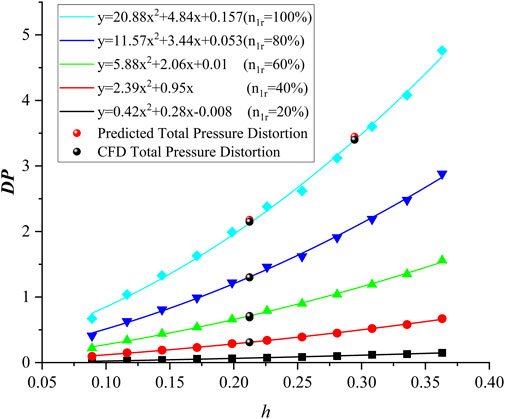
FIGURE 13. AIP section under different plugboard depths and n1r.
Figure 14 displays the results obtained from the implementation of the Ω criterion vortex identification method to examine the flow characteristics after the plugboard. The visualization indicates the formation of a stagnant vortex in the upstream region of the plugboard. As the airflow proceeds past the plugboard, a portion deviates towards the flow channel wall, leading to the creation of an angled vortex at the intersection between the plugboard and the wall. This corner vortex maintains relative independence and gradually dissipates along the flow direction, exhibiting a positive correlation with the plugboard’s height. Simultaneously, the bypassing airflow generates a separation vortex due to shear forces. A comparative analysis reveals similarities in the position and extent of the low-speed reflux zone and the separation vortex. Upon entering the inlet cowl, contributing to a more uniform flow field through airflow mixing and momentum transfer, consequently diminishing its spatial extent.
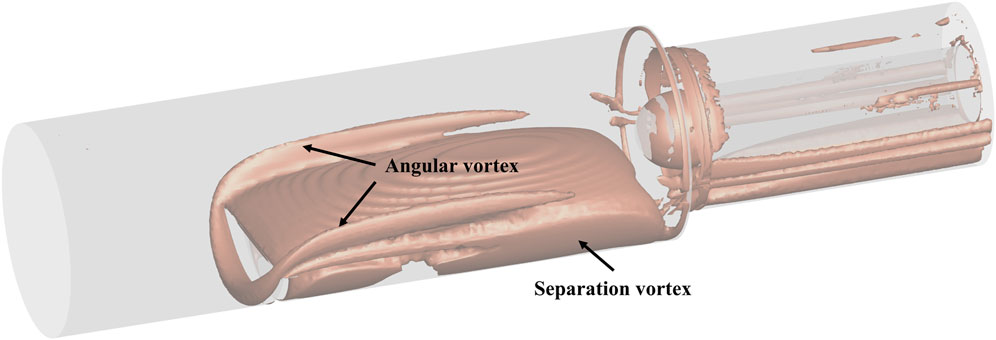
FIGURE 14. Ω-criterion vortex analysis.
Figure 15 shows the distribution of Ω at different positions in the X direction. As can be seen from the figure, the upstream vortices of the plugboard are mainly concentrated near the wall in front of the plugboard, with a small influence range of vortices, but a large value of central vortex Ω.
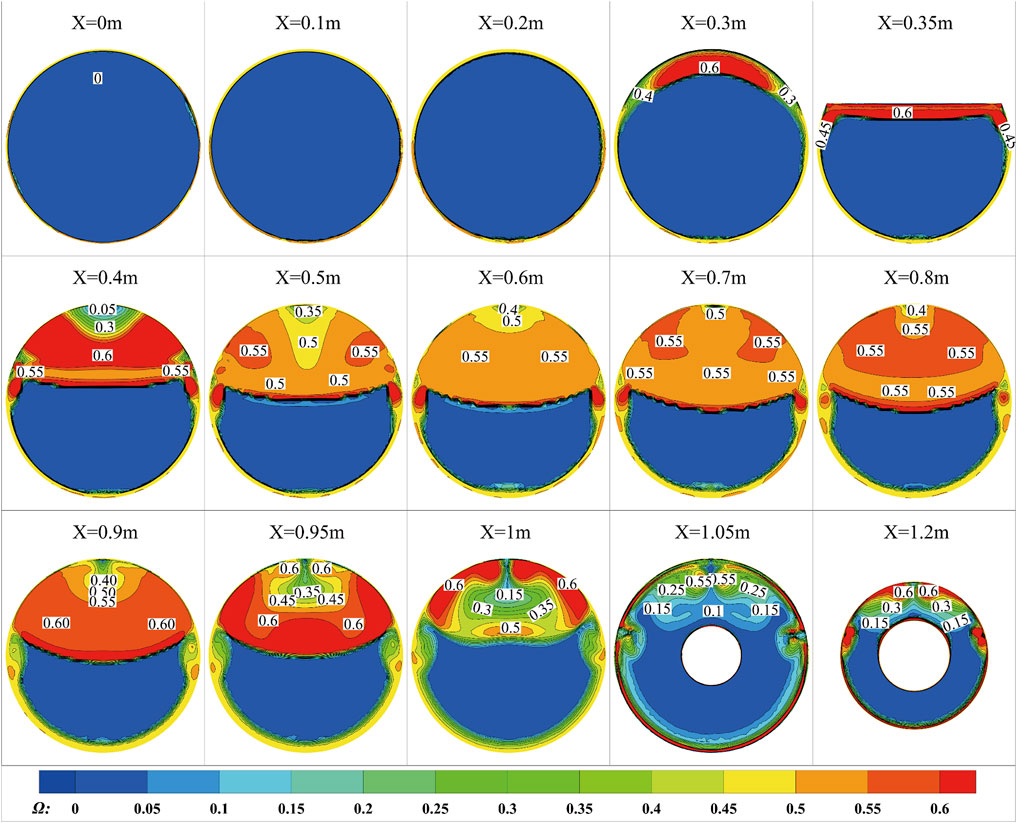
FIGURE 15. AIP section (n1r = 100%) Ω vortex distribution.
The intensity of vortices in the 0.35–0.4 and 0.8–0.9 m regions behind the plugboard is larger, while the intensity and velocity of vortices in the middle region are smaller. The range and intensity of the rectification vortex caused by the intake rectifying cap during the process of air flow passing through X = 1–1.1 m are significantly smaller. However, it cannot completely eliminate the non-uniformity of the airflow. The area with a large Ω value at X = 1.1 m is essentially the same as the low-pressure area. By comparing the Ω criterion values with the changes in fluid along the flow, it can be observed that regions with large Ω values are basically the same as the low-speed regions of the flow. The Ω value may be suitable for correlating eddy currents with flow parameters. It is important to note that due to the complexity of geometric characteristics, the Ω value cannot be directly equated to the flow velocity. Non-etheless, the Ω criterion still can be used as an auxiliary method for analyzing the flow field non-uniformity caused by the plugboard.
4 Conclusion
This article selects the distortion of ship inlet as the research object and conducts distortion equivalent tests and simulation calculations on plugboard devices of different heights and shapes. By analyzing the changes in the flow field structure of the computational domain and compressor inlet, the relationship between the insertion plate parameters and total pressure distortion is summarized. The following conclusions are summarized:
1. On the premise that the height of the plugboard h is constant, change the shape of the plugboard to arc plugboard or concave and convex plugboard, the total pressure distortion DP can be adjusted while the area of the circumferential low-pressure zone remains unchanged. The distortion DP of Total pressure is positively correlated with the blocking area of the plug plate.
2. The increase in work flow and plugboard height leads to an increase in flow non-uniformity, resulting in an increase in total pressure distortion of the AIP section. Based on the summary of the research results, the relationship between the plugboard height h and the total pressure distortion DP is obtained. This relationship can realize the rapid prediction of the total pressure distortion DP of the AIP section under different working conditions.
3. The analysis of the equivalent simulated flow field through the Ω criterion can reflect the change of the range and intensity of vortices in the flow process. The augmentation of vortex range and intensity within the flow field leads to an increase in flow losses, and further decreases in total pressure and velocity, resulting in an enhancement of flow non-uniformity. This indicates that the Ω criterion may serve as an auxiliary method for analyzing flow distortion caused by the plugboard.
Data availability statement
The original contributions presented in the study are included in the article/Supplementary material, further inquiries can be directed to the corresponding author.
Author contributions
Z-YW: Methodology, Supervision, Writing–original draft, Writing–review and editing. CH: Software, Validation, Writing–original draft, Writing–review and editing. YW: Funding acquisition, Resources, Writing–review and editing. Y-LQ: Project administration, Validation, Writing–review and editing.
Funding
The author(s) declare financial support was received for the research, authorship, and/or publication of this article. The work of this paper was completed with the support of National Natural Science Foundation of China (NO. 52101348) and the National Science and Technology Major Project (2017-V-0002-0051), and I would like to express my sincere gratitude.
Conflict of interest
The authors declare that the research was conducted in the absence of any commercial or financial relationships that could be construed as a potential conflict of interest.
Publisher’s note
All claims expressed in this article are solely those of the authors and do not necessarily represent those of their affiliated organizations, or those of the publisher, the editors and the reviewers. Any product that may be evaluated in this article, or claim that may be made by its manufacturer, is not guaranteed or endorsed by the publisher.
References
Beale, D., Cramer, K., and King, P. (2002). “Development of improved methods for simulating aircraft inlet distortion in turbine engine ground tests,” in Aiaa aerodynamic measurement technology and ground testing conference. St. Louis, Missouri: (ASME). doi:10.2514/6.2002-3045
Beale, D., Davis, M., and Sirbaugh, J. (2006). “Requirements and advances in simulating aircraft inlet total-pressure distortion in turbine engine ground tests,” in ASME turbo expo 2006:power for land, sea and air. Barcelona, Spain: (ASME). doi:10.1115/GT2006-90038
Beale, D., Wieland, S., Reed, J., and Wilhite, L. (2007). “Demonstration of a transient total-pressure distortion generator for simulating aircraft inlet distortion in turbine engine ground test,” in ASME turbo expo 2007: power for land, sea and air. Montreal, Canada: (ASME). doi:10.1115/GT2007-27222
Bobula, G. A. (1979). Effects of steady-state pressure distortion on the stall margin of a J85-21 turbojet engine. NASA Thechnical Reports.
Braithwaite, W. M., Dicus, J. H., and Moss, J. E. (1970). Evaluation with a turbofan engine of air jets as a steady-state inlet flow distortion device technical memorandum. NASA Thechnical Reports.
Chen, F., Ren, X., Li, Y., and Gu, C. (2023). Experimental and numerical study on aerodynamic stability of compressor L-inlet duct. Aerosp. Sci. Technol. 139, 108368. doi:10.1016/j.ast.2023.108368
Cheng, B., Wang, J., Feng, L., Wei, Y., Wang, Z., and Li, J. (2020). Review of aero-engine inlet swirl distortion research. J. Aerosp. Power 35 (12), 2465–2481. doi:10.13224/j.cnki.jasp.2020.12.001
Hubble, J. D., and Smith, R. E. (1979). Evaluation of an airjet distortion generator used to produce steady-state, total pressure distortion at the inlet of a general electric F101-GE-I00 turbofan engine. AEDC.
Jiang, Y., Zhang, B., Chen, S., Chen, G., and Mei, F. (2009). Test-based syntonic analysis of the aero-engine inserted-board inlet dynamic distortion pressure. J. Aerosp. Power 9, 2057–2062.
Jiang, Y., Zhang, F., Zhang, B., Kong, W., Tang, Y. B., Huang, M. C., et al. (2007). Caveolin-1 sensitizes rat pituitary adenoma GH3 cells to bromocriptine induced apoptosis. J. Air Force Eng. Univ. Sci. Ed. 7 (02), 1–3. doi:10.1186/1475-2867-7-1
Jinghua, C., and Baofeng, T. (2015). Full annulus numerical simulation of aerodynamic stability of compressor with total pressure distortion. J. Propuls. Technol. 36 (5), 729–736. doi:10.13675/j.cnki.tjjs.2015.05.012
Kan, K., Chen, H., Zheng, Y., Zhou, D., Binama, M., and Dai, J. (2021b). Transient characteristics during power-off process in a shaft extension tubular pump by using a suitable numerical model. Renew. Energy 164, 109–121. doi:10.1016/j.renene.2020.09.001
Kan, K., Yang, Z., Lyu, P., Zheng, Y., and Shen, L. (2021a). Numerical study of turbulent flow past a rotating axial-flow pump based on a level-set immersed boundary method. Renew. Energy 168, 960–971. doi:10.1016/j.renene.2020.12.103
Kutschenreuter, J. P., Collins, T., and Vier, W. I. (1973). P 3G-A new dynamic distortion generator. J. Aircr. 11 (6), 344–348. doi:10.2514/3.59256
Liu, Y., Chen, J., and Huang, G. (2022b). Study on stability and dynamic flow law of baffle in pipe. Mach. Build. Automation 51 (03), 125–129. doi:10.13477/j.cnki.aeroengine.2022.03.016
Liu, Z., Cai, C., He, Z., Xu, G., Gao, L., and Yang, L. (2022a). Inlet pressure distortion test of aeroengine under different plug. Aeroengine 48 (03), 101–105.
Liu, Z., Zhang, S., Yin, Y., Wang, Z., Luan, Y., and Zhou, S. (2021). Research on thrust calibration technology of aeroengine indoor test bench. J. Appl. Fluid Mech. 15 (1), 109–116.
Maghsoudi, I., Vaziry, A. M., and Mahmoodi, M. (2020). Experimental investigation of flow and distortion mitigation by mechanical vortex generators in a coupled serpentine inlet-turbofan engine system. Chin. J. Aeronautics 33 (05), 1375–1391. doi:10.1016/j.cja.2019.12.002
Mankbadi, M. R., and Georgiadis, N. J. (2015). Examination of parameters affecting large-eddy simulations of flow past a square cylinder. AIAA J. 53 (6), 1706–1712. doi:10.2514/1.j053684
Mcllveen, M. W. (1979). Further test results with the airjet distortion generator system. Las Vegas,NV,U.S.A.: AIAA, 79–1185. doi:10.2514/6.1979-1185
Meyer, C. L., Mc Aulay, J. E., and Biesiadny, T. J. (1970). Technique for inducing controlled steady-state and dynamic inlet pressure disturbances for jet engine tests. NASA Thechnical Reports.
Naseri, A., Boroomand, M., and Tousi, A. M. (2012). “The effect of inlet flow distortion on performance of a micro-jet engine,” in ASME 2012 international mechanical engineering congress and exposition. Houston, Texas, USA: ASME. doi:10.1115/IMECE2012-86865
Overall, B., and Harper, R. (1974). “The airjet distortion generator system: a new tool for aircraft turbine engine testing,” in 13th propulsion conference (Orlando,FL,U.S.A: AIAA), 77–993. doi:10.2514/6.1977-993
SAE Aerospace Information Report AIR-1419 (1999). Inlet total-pressure distortion considerations for gas turbine engines. Society of Automotive Engineers.
SAE S-16 Committee ARP 1420, Revision B (2002). Gas turbine inlet flow distortion guidelines. Society of Automotive Engineers.
Sivapragasam, M. (2019). Flow field behind a complex total pressure distortion screen. Proc. Institution Mech. Eng. Part G J. Aerosp. Eng. 233 (14), 5075–5092. doi:10.1177/0954410019837862
Song, G., Li, J., Tang, M., Wu, Y., and Luo, Y. (2021). Experimental simulation methodology and spatial transition of complex distortion fields in a S-shaped inlet. Aerosp. Sci. Technol. 2021, 116.
Tu, B., Xuan, B., Li, C., Zhang, X., and Hu, J. (2021). Experimental and numerical investigation on total pressure distortion generated by a rectangular movable flat baffle. Adv. Mech. Eng. 13 (2), 168781402199439. doi:10.1177/1687814021994397
Wu, Z., Cai, W., Zhang, T., Chen, X., and Li, W. (2022). An improved model for predicting dynamic total pressure distortion. Aerosp. Sci. Technol. 130, 107932. doi:10.1016/j.ast.2022.107932
Xia, A., Huang, X., Wei, T., and Zhou, M. (2018). Experimental study of a controlled variable double-baffle distortion generator engine test rig. Chin. J. Aeronautics 31 (9), 1880–1893. doi:10.1016/j.cja.2018.06.015
Yin, C., Hu, J., Guo, J., Yan, W., and Zhang, C. (2015). Three-dimensional body-force model for effect on compressor performance of inlet distortion. J. Aerosp. Power 30 (9), 2241–2250. doi:10.13224/j.cnki.jasp.2015.09.025
Yusoof, M. S., and Deshpande, M. D. (2015). Strip distortion generator for simulating inlet flow distortion in gas turbine engine ground test facilities. Propuls. Power Res. 5 (4), 287–301. doi:10.1016/j.jppr.2016.11.004
Zhang, T., Zhao, Y., Zhao, W., and Chen, B. (2017). Design and research of movable total pressure distortion generator. J. Propuls. Technol. 38 (12), 2706–2715. doi:10.13675/j.cnki.tjjs.2017.12.009
Zhang, X., Li, J., Song, G., Zhou, Y., and Xie, H. (2019). Numerical simulation on flat baffle inlet of axial compressor. J. Aerosp. Power 34 (5), 1153–1165.
Zhou, Y., Li, J., Peng, S., Song, G., Jiang, A., and Zhang, Y. (2017). Numerical simulation of flat baffle inlet distortion coupled with compressor. J. Aerosp. Power 32 (3), 568–576. doi:10.13224/j.cnki.jasp.2017.03.007
Keywords: ship engine, inlet distortion, distortion generator, plugboard method, equivalent simulation
Citation: Wang Z-Y, He C, Wu Y and Qu Y-L (2024) Equivalent simulation method for total pressure distortion of ship inlet. Front. Energy Res. 11:1259729. doi: 10.3389/fenrg.2023.1259729
Received: 16 July 2023; Accepted: 21 December 2023;
Published: 09 January 2024.
Edited by:
Kan Kan, College of Energy and Electrical Engineering, ChinaCopyright © 2024 Wang, He, Wu and Qu. This is an open-access article distributed under the terms of the Creative Commons Attribution License (CC BY). The use, distribution or reproduction in other forums is permitted, provided the original author(s) and the copyright owner(s) are credited and that the original publication in this journal is cited, in accordance with accepted academic practice. No use, distribution or reproduction is permitted which does not comply with these terms.
*Correspondence: Yong-Lei Qu, cXV5b25nbGVpQGhyYmV1LmVkdS5jbg==