 Raziq Yaqub
 Alak Bandyopadhyay1
 Hassan Ali
- 1Department of Electrical Engineering and Computer Science, Alabama A&M University, Huntsville, AL, United States
- 2Department of Electrical Engineering, University of Doha for Science and Technology (UDST), Doha, Qatar
We propose implementing an onboard energy scavenging subsystem utilizing piezoelectric materials, which serves the dual purpose of generating electrical energy and facilitating data acquisition for multifaceted applications. In a practical demonstration, we have engineered a fully functional prototype adept at gathering data via a piezoelectric-centric energy scavenging mechanism. This gathered data is seamlessly synchronized with GPS coordinates and timestamps, meticulously organized within a system architecture, and harnessed through meticulously crafted Python code. The wealth of data that we obtain from an onboard energy scavenging subsystem holds significant potential. It empowers us to discern road irregularities and potholes through intricate analytical methodologies while also facilitating a thorough assessment of asphalt quality. Furthermore, it enables real-time surveillance of vehicular suspension system health and offers a nuanced exploration of driver behavior patterns. In a pragmatic pursuit of actionable insights, the amassed data can be expeditiously conveyed to relevant authorities. These authorities can perform even deeper Artificial Intelligence (AI), Machine Learning (ML), and Deep Learning (DL) to proactively initiate timely corrective measures, thereby elevating road safety standards and ensuring the maintenance of critical infrastructure. The Results and Discussion section underscores the attainment of substantial and noteworthy outcomes, further affirming the significance of our findings.
1 Introduction
Problem Statement: Increasing demands for autonomous data collection and innovative energy sources have spurred interest in onboard energy scavenging subsystems. However, gaps exist in understanding the full potential of such systems to generate valuable data. This study aims to explore and uncover the untapped capabilities of onboard energy scavenging subsystems, evaluating their viability for efficiently harvesting energy and generating valuable data in diverse applications.
Motivation: In today’s technology-driven world, the quest for sustainable and autonomous solutions has fueled intense interest in harnessing ambient energy sources. Onboard energy scavenging subsystems hold the promise of revolutionizing data generation, offering a unique synergy between energy harvesting and valuable data acquisition. By delving into the uncharted territory of these systems, our study aims to unlock their untapped potential, paving the way for more efficient and self-sustaining technologies that can reshape industries, enhance data-driven decision-making, and contribute to a more environmentally conscious future.
This work aims to use piezo material to scavenge electrical energy for powering meso-to-micro scale devices and to detect and analyze information from energy creation patterns. This system can detect and locate road roughness, such as potholes and corrugations, monitor the health of a vehicle’s suspension system, evaluate a driver’s behavior, and profile asphalt quality. AI-based data analytics is used to provide meaningful information to those responsible for taking corrective actions. A prototype model of the system was constructed to carry out this endeavor, and the investigation results are described in this paper.
Road roughness (that may include corrugations, potholes, asphalt quality, etc. (Abulizi et al., 2016) health of vehicle suspension system (that may include springs, shock absorbers, and struts, etc., (Zhang et al., 2020), driving styles (that may include reckless, anxious style, and careful, etc., (Peng et al., 2022), all affect onboard energy scavenging. The motivation behind this work is to use piezo material not primarily to scavenge electrical energy for powering meso-to-micro scale devices but also to expose and utilize the information concealed in energy creation patterns. Thus, we suggest a system capable of extracting information concealed in energy creation patterns and using the data analytics techniques to i) detect and locate potholes, corrugations on the road surfaces, and road roughness, ii) monitor the health of car suspension system, iii) evaluate the driver’s behavior behind the wheel, and iv) conduct asphalt quality profiling for the assessment of contractors’ performance. We also suggest performing AI-based data analytics and dispatching meaningful information to the parties responsible for taking corrective actions. We constructed a prototype model of the system to carry out this endeavor, and this paper describes the investigation results.
The study of harvesting energy using piezoelectric material in a partial or complete car model is discussed in [(Chukwu and Mahajan, 2017; Ndoye et al., 2011; Yaqub et al., 2012)]. It reports that a passenger car traveling at a speed of 13 m/s can produce a power of around 200 W and is worth being harvested. However, it is mute about exposing the information concealed in energy creation patterns. Pothole detection and warning the drivers about it is demonstrated in (Rode et al., 2023) however, it employs sensors based on force balance pendulous accelerometers and piezoelectric material to detect the presence of potholes. Unfortunately, the pendulous accelerometer is very bulky and expensive while having outstanding performance. Also, the scope of the work is very limited as it does not alert the appropriate authorities for taking corrective measures (Motus engineering solutions, 2023). Due to their lower cost and smaller footprint, piezoelectric-based sensors were the ones we ultimately settled on. We could not find any work suggesting extracting information hidden in energy creation patterns, applying data analytics techniques to extract valuable and actionable information, and dispatching the information to the appropriate authorities. These authorities may include, for example, the Department of Transportation responsible for road planning, construction, and maintenance and taking corrective measures (US Department of Transportation, 2023), the Alliance of Automobile Manufacturers for Automotive Innovation (Autosinnovate, 2023), and State Driving Licensing Agencies. Since we do not append the vehicle, or the driver identification data with the collected information, therefore it does not pose any privacy and security concerns. (Davidson and Mo, 2014). This paper comprehensively examines recent advancements in energy harvesting technologies for Structural Health Monitoring (SHM) applications. The system encompasses embedded sensors, data acquisition, wireless communication, and energy harvesting components, including vibration, thermal gradients, solar, wind, pressure, piezoelectric materials, electromagnetic, and magnetostrictive materials. However, the objective of this paper is to explore advanced energy harvesting technologies to power low-power sensors and wireless communication components.
(De Fazio et al., 2023). The objective of this research is to explore and categorize existing energy harvesting technologies that can extract energy from various sources available on roadways, both natural and related to vehicular transit. The aim is to identify and analyze the most promising solutions and technologies for creating energetically autonomous smart road systems (Shaikh and Zeadally, 2021).
(Beeby et al., 2007; Ahmad et al., 2019). The main objective of this research work is to comprehensively address the energy efficiency challenges in Wireless Sensor Networks (WSNs) and the Internet of Things (IoT). The focus is on designing and developing efficient and high-performance energy harvesting systems for WSN and IoT environments. The book covers various energy harvesting sources, techniques, energy management, and prediction models to maximize harvested energy. It also highlights architectural advancements for cost-effective, efficient, and reliable energy harvesting systems. This reference serves researchers, engineers, practitioners, and students in developing practical energy harvesting models and technologies for WSN and IoT deployments, benefiting professionals and industries in IoT, sensing, and energy harvesting technologies. The main objective of this research is to provide a comprehensive review of energy harvesting from pavements, focusing on sources such as solar radiation, mechanical energy from vehicles and pedestrians, geothermal energy, rainwater, and wind. The study aims to present the current state of research, progress in energy harvesting methods, material developments, practical system creation, commercial status, technology comparison, challenges, and potential future directions. The findings emphasize the potential for broader implementation of pavement and roadway energy harvesting technologies through further research and feasibility studies.
Though we found these references closely related to our work, their objectives are quite different from our work. There are several limitations of previous studies on energy harvesting using piezoelectric materials, such as some studies focused solely on energy generation without fully exploring the potential for valuable data collection and utilization (Yaqub et al., 2012; Chukwu and Mahajan, 2017). Previous research is confined to specific applications (Abulizi et al., 2016; Zhang et al., 2020), overlooking the broader spectrum of possibilities for onboard energy scavenging subsystems. Most of the prior art primarily adopted theoretical and simulation approaches, lacking practical implementations or real-world testing (Chukwu and Mahajan, 2017; Rode et al., 2023; Jazar, 2017). The research on “Exploring the Potential of Onboard Energy Scavenging Subsystems for Generating Valuable Data” addresses these limitations as this study takes a holistic perspective, considering both energy scavenging and data generation, thus providing a more complete understanding of the technology’s potential. In addition, this research explores a wide range of potential applications for onboard energy scavenging subsystems, ensuring a more comprehensive assessment of their capabilities. By exploring both energy harvesting and data collection, the study emphasizes the integrated design of systems that simultaneously scavenge energy and generate valuable data. Also, the research includes practical experimentation, demonstrating the feasibility and real-world performance of the proposed onboard energy scavenging subsystems. By addressing these limitations, the research contributes to a more comprehensive and practical understanding of the potential of onboard energy scavenging subsystems for generating valuable data across diverse applications and contexts.
Thus, we decided to use the Piezoelectric-based sensors based on the following reasons and the advantages offered by the Piezoelectric based sensors. The Piezoelectric-based sensors directly convert mechanical vibrations into electrical energy, yielding high energy conversion efficiency compared to some other methods, which may involve more complex mechanisms. Piezoelectric sensors are inherently compact and lightweight, making them suitable for integration into vehicles for energy scavenging, which might not be as feasible with bulkier energy harvesting technologies. Further, Piezoelectric materials have durability and resilience, leading to longer operational lifespans for energy-scavenging subsystems. Also, Piezoelectric devices can produce instantaneous electrical power in response to vibrations, making them suitable for applications requiring rapid power bursts, and last but not least, the Piezoelectric sensors require minimal maintenance due to the absence of moving parts and their inherent robustness.
In contrast, other vibration-based data collection technologies might have different advantages and limitations. Accelerometers provide a broader motion detection range but may require additional power sources. Fiber optic sensors offer high precision but can be complex to install and maintain. By comparing these technologies, choosing the most appropriate solution is possible based on factors such as application, power efficiency, sensitivity, and budget.
2 Description
Figure 1A shows the proposed prototype. It is a battery-operated toy car that installs i) piezoelectric sensors at strategic locations in the suspension system, ii) a GPS data logger for measuring location coordinates, iii) a Wi-Fi-based communication interface for data transmission, and iv) a LattePanda host machine, amplified in Figure 1B. LattePanda host machine is a single-board computer. It is conceptually similar to the Raspberry Pi, but it runs Intel processors, has more RAM, speed, and power, and can run a full version of Windows 10 or Linux. It receives data from the above-noted onboard components and processes it. It displays the needed information on an onboard display, see Figure 1D and also sends the complete datasets to a remote server over a Wi-Fi communication link or cellular communication link (if it is provisioned with the Subscriber Identity Module (SIM)) to carry out data science related tasks comprising of Artificial Intelligence (AI), Machine Learning (ML), and Deep Learning (DL) as shown in Figure 1C.
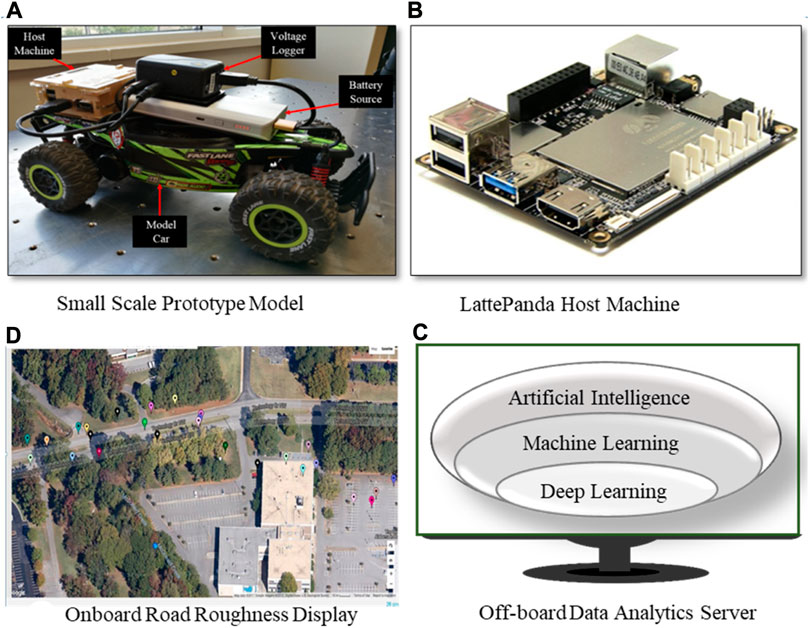
FIGURE 1. The overall concept of the proposed prototype.
The above noted components are grouped into different subsystems for easy explanation. These subsystems are listed below; inter-subsystem information flow is depicted in Figure 2, and their functions are elaborated in the below paragraphs. Figure 2 also portrays that the subsystem responsible for data analytics uses the data for diversified applications, such as detecting and locating potholes and road roughness, monitoring the health of the car suspension system, evaluating the driver’s behavior, and conducting asphalt quality profiling.
1) Energy Scavenging Subsystem (ESS)
2) Data Acquisition Subsystem (DAS)
3) Data Integration and Dispatch Subsystem (DIDS), and
4) Data Analytics, Display and Dispatch Subsystem (DADS)
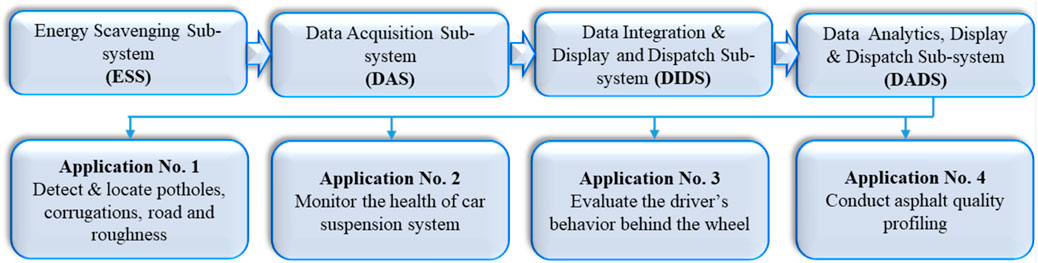
FIGURE 2. Block diagram of information flow in subsystems.
2.1 Energy scavenging sub-system
Although there are several onboard excitation sources, such as engine vibration and occupants’ movement, the road roughness, health of the vehicle suspension system, and driving styles are the main excitation sources for all vehicle energy scavenging subsystems (Chukwu and Mahajan, 2017; Ndoye et al., 2011). A suspension system connects a vehicle to its wheels and allows relative motion between the two (Jazar, 2017) to keep the wheels in contact with the road surface as much as possible. Therefore, defining a place for quartz (SiO2), a piezoelectric material, inside the suspension system of the small-scale model that would produce a sufficient voltage signal is very important. So, as shown in Figure 3, we put it between the front lower suspension arms of the remote-controlled automobile.
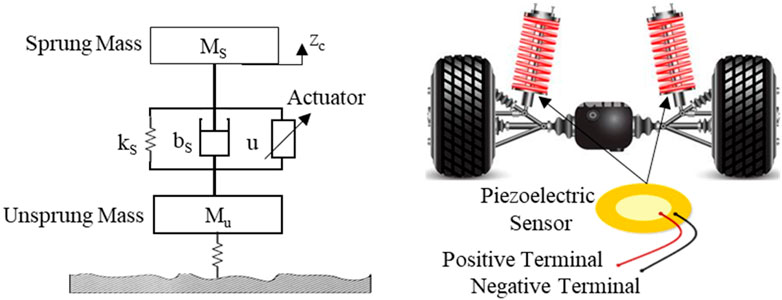
FIGURE 3. The quarter car suspension system.
By simulating the road surface as a periodic wave (Chukwu and Mahajan, 2017), we can determine its amplitude (the average height of the bumps) and wavelength (the average distance between them). Thus, using the quarter car non-linear model depicted in Figure 3, we can define a relationship between the vibrational energy harvested from the vehicle suspension systems (Chukwu and Mahajan, 2017; Davidson and Mo, 2014) (that are directly impinged) by i) the road surface landmarks, ii) the speed of the vehicle (that determines the frequency of vibrational excitation), iii) the health of the suspension system, and iv) the driving habits of the vehicle operator behind the wheel. Refer to Figure 3; the harvested power Pe, for such a system, is given in terms of the system’s natural frequency of vibration, the spring constants, and the roughness of the road as shown in Eq. 1:
Where,
The maximum power is obtained when ω = ωn and ξm = ξe (Yaqub et al., 2012).
The average power Pav generated by the piezoelectric material’s vibration is given by (Zhang et al., 2020; Ndoye et al., 2011; Davidson and Mo, 2014; De Fazio et al., 2023).
Where:
The piezoelectric strip may produce the most electrical power when the input and natural frequencies are matched. The following equation (Davidson and Mo, 2014).gives the maximum harvested power, assuming the vibration is acceleration and displacement is y:
Where:
The power generated from the ESS is very valuable for two reasons, firstly, it can be used to power the onboard electronics, and secondly, the energy generation patterns data contain much information that can be processed and used for several applications. Thus, the ESS passes the data to the next subsystem DAS as shown in Figure 2.
The proposed methodology utilizes a quarter-car suspension system integrated with piezoelectric material to harvest vibrational energy to collect valuable data from the vehicle’s operation. The process starts by simulating the road surface as a periodic wave with a defined amplitude (average height of bumps) and wavelength (average distance between them). By using the quarter car non-linear model, the relationship between the harvested vibrational energy and various factors such as road surface landmarks, vehicle speed (frequency of vibrational excitation), health of the suspension system, and driving habits of the vehicle operator can be defined. The harvested power (Pe) from the system is determined based on the system’s natural frequency of vibration, spring constants, and road roughness, as shown in Eq. 1.
The average power (Pav) generated by the piezoelectric material’s vibration is given by Eq. 3, which considers the piezoelectric strip’s properties and its input and natural frequencies. The goal is to maximize the harvested power, which can be achieved by matching the input and natural frequencies of the piezoelectric strip, as shown in Eq. 4. The parameters in Eq. 4 are related to the vibration’s acceleration and displacement. The generated power from the Energy Scavenging Subsystem (ESS) has two main advantages: it can be used to power the onboard electronics, and the data generated from the energy generation patterns carry valuable information that can be processed and utilized for various applications.
2.2 Data acquisition subsystem (DAS)
As the name implies, this subsystem extracts data from the energy generation pattern of the ESS. The information contained in this data can be analyzed and used for diversified applications. Some of the applications are shown in Figure 2 and are described in Section 3.
Each voltage signal produced by the piezoelectric material when the vehicle follows a course has a particular value at a specific time and place that is connected to the degree of road roughness. We employed the Accuzact DAQ 823 Voltage Data Logger to capture these voltage signals. This dual-channel data-collecting device monitors two different 0 to +30V DC measurement ranges with analog pins and a USB connection. Additionally, this device runs a virtual data logger program that can graph, print, and export data to other programs. Because the virtual data logger software requires power and a physical connection to a computer, we chose to install LattePanda Host Machine, see Figure 1B as an onboard host computer on the vehicle. Our virtual logger software works better on a development board that uses the x86 Framework. We utilized a 10,000mAh Romoss USB Battery pack with a maximum current to power the host PC.
2.3 Data integration and dispatch subsystem (DIDS)
The three pieces of information (GPS coordinates, Voltage pulses, and timestamp) are needed to be combined into a valuable digital data format. DIDS uses the Canmore GT-730FL universal Serial Bus GPS data recorder and performs aggregation of voltage signals, GPS coordinates, and timestamps. The USB port on the host computer is used to connect this dongle. The ESS, DIDS, and DADS are all assembled and mounted on a toy automobile. Figure 1A shows the miniature model. These subsystems gather and compile valuable data. DIDS also displays the most needed information by the driver on the onboard display. It may contain road health, suspension system health, etc.
DIDS is further charged with information dispatch. Thus, this subsystem sends the combined data to the remote machine that is computationally more powerful and capable of running data science/data analytics software for intense data analytics. We used a cell phone as a Wi-Fi hotspot to send the data to a remote computer server. We also used TeamViewer software to manage and track the prototype’s data production via a remote desktop client program. Additionally, we completed all startup activities without needing physical interfacing tools because of the prototype’s independence from direct I/O to the host system.
The DADS assume a pivotal role in efficiently processing and harnessing the data generated by the Energy Scavenging Subsystem (ESS). Leveraging cutting-edge AI algorithms, the DADS proficiently analyzes the vast data streams received from the ESS, empowering it to extract real-time insights. Furthermore, ML algorithms are adeptly employed within the DADS to construct adaptable models that continually enhance their performance over time. This facilitates optimal energy harvesting by allowing the DADS to adjust to dynamic road conditions, driving patterns, and suspension system health. The ML models constantly evolve and fine-tune their predictions using fresh data, resulting in more precise energy harvesting and the optimized use of collected data for a multitude of applications. Moreover, the incorporation of AI, ML, and DL on third-party servers at remote locations, enables comprehensive data evaluation across multiple vehicles, unveiling trends and anomalies that might remain hidden to a single vehicle.
2.4 Data analytics, display and dispatch subsystem (DADS)
The AccuLogger Data Logger and Canmore GPS dongle, the integral components of the prototype, each supplied files with voltage and position data important to our proof-of-concept. These files were initially kept locally on the LattePanda host system in the current prototype design.
The Accuzact Voltage Logger creates files (see Figure 4A) with three sections: voltage measurements, a start time, and a stop time (both are the host computer system times). The GPS logger’s file contents (see Figure 4B) conform to National Marine Electronics Association (NMEA) 0183 standards (Baddeley, 2001). Offloading these files is required, retrieved, then structured to provide an easily readable table via our user interface. Microsoft Excel and the Visual Basic Integrated Development Environment are the tools utilized for this. This was done by writing several different subroutines. These subroutines perform various tasks required to achieve our organizational objectives, such as data extraction from files, data manipulation, data comparison using data type, and many more. This section briefly overviews our Organize_GPS function (see Figure 4C).
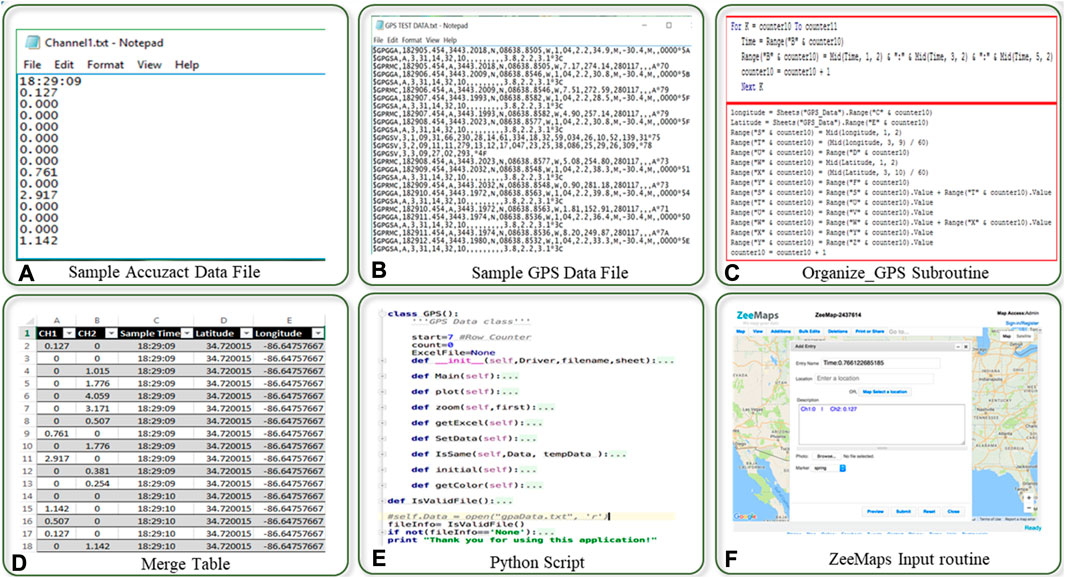
FIGURE 4. Data collection and analytics.
Time comparison is the most effective way to link the GPS data with the voltage information. However, Excel cannot recognize the data entered from the NMEA file as time (which stores time internally as a decimal). As a result, we are forced to develop a procedure that modifies the data to enable a straightforward string comparison. This method must match the timestamp of the GPS coordinates and the date of another sub-pair that contains the voltage information. For charting on our user interface, the latitude and longitude must also be translated from decimal degrees to degrees.
The Organize GPS sub begins by organizing the GPS time into a comparable format using a series of mid functions (which grab a specific range of data within a cell), colon characters, counters, and concatenating operations within a loop. It then uses coordinate conversions to enable the merging sub to prepare the data in a way that can be easily integrated into our user interface. A table (see Figure 4D) is created when our subroutines have finished running, and it is then made accessible to our Python script (see Figure 4E), which creates our user interface (see Figure 4F).
As a result of our system’s prototype voltage recording capabilities, which can measure up to seventeen samples per second, the road’s state is accurately represented at any moment throughout a run. The lower amplitudes associated with smoother road conditions may be filtered using a high pass filter that is already built into our algorithms. But further research is needed on the threshold at which this filter is established.
One sample of coordinates is recorded by the Canmore GPS dongle every second. As a result of the significant disparities in sample speeds between the voltage logger and the GPS dongle, both minor timing errors and the inherent resolution limitations of global positioning systems affect the resolution at which a peak occurs. However, it has been proven that our prototype is precise enough for this experiment’s purposes to express road roughness characteristics with a fair margin of error (2–6 m).
Our last method of informing a user regarding our prototype is the Dashboard. Users will be able to see an approximate representation of the gathered data shown on a map after capturing the voltage peaks and combining the voltage logger data with the global positioning data. We need to develop a mechanism to identify one point from the next since all the data will represent the degree of road roughness in terms of different voltages. Given these considerations, our strategy involves transferring all important aggregated data to the ZeeMaps website to produce a visual display. This procedure needed a Python script to read the complete merged table (as seen in Figure 4D) and run several export and comparison algorithms to present the user with points of interest.
There is a mechanism to extract the data from the data spreadsheet in the first section of the Python script. The Openpyxl Library enabled us to achieve that. This library includes routines that can extract data from an Excel file in several ways (Gazoni and Clark, 2010). Importing the whole Excel file and putting it in a variable were the steps to get the data out of the spreadsheet. After that, we read over each row and took five cells from each row using a row variable. The algorithm then compared the current row variable value to the previously recorded variable value. This cycle will continue until the file variable storing the complete spreadsheet is exhausted.
Secondly, to verify that all the points on the map are unique, we had to create an algorithm to compare variables. During our early runs, we tested our procedures by charting all the points along a path. Additionally, to compare the row variables, we would need to devise a way to differentiate the level of road roughness. This problem was resolved by color labeling the voltage peak ranges.
The last phase was taking the supplied data and displaying it in a simple fashion for a user to understand using a functional file reading and comparison approach. Web-driver functions that communicate with website components are available in the Selenium Library (Muthukadan, 2011). Usually, automation is accomplished with this tool. This library would allow quick insert of useful data from the test run into the user display. The entire procedure requires going to ZeeMaps and accessing the website’s map component. From this point, settings must be changed to allow users to enter information. The current row variable delivers the data from the captured voltage signal to the description space. The timestamp data is then taken by the current row variable and sent to the area designated for the Entry Name. Additionally, the current variable delivers the latitude and longitude data to the location-specific space.
Finally, a color will be assigned to the row variable’s current greatest value between the two channels of voltage logger data. This color will be transmitted to the marker field. This procedure will continue until the entire file is executed. The web-driver closes the add entry box once the procedure reaches the end of the file and then zooms in on the region with the greatest concentration of plots. The console will then ask the user if they want to save the current map and create another one when they’ve finished. A finished map with an abundance of sites of interest is shown in Figure 1D. The locations of the potholes are displayed on a map using the measurements that have been continuously taken from the toy car over time.
DADS is capable of analytics and dispatching the information to the authorities responsible for taking corrective actions.
3 Results and discussion
3.1 Strain and temperature impact on piezo sensor energy generation
Figure 5, the Piezo Sensor Strain vs. Energy Generation graph, illustrates the relationship between the strain applied to a piezo sensor and the amount of energy generated. As the strain on the sensor increases, the energy generation also rises, indicating a direct correlation. This graph also shows the impact of temperature variation on the output energy generation of piezo sensors under varying strain levels. The energy generation of a piezo sensor decreases as the temperature rises. This is due to the change in material properties of the piezoelectric material used in the sensor. Higher temperatures lead to increased electrical resistance, reduced piezoelectric coefficients, and decreased overall sensitivity of the sensor. Therefore, it is important to compensate for temperature effects for applications explained in this manuscript.

FIGURE 5. Strain and temperature impact on piezo sensor energy generation.
In this particular scenario, a road bump induces strain. As the vehicle encounters the road bump, the strain on the sensor increases, leading to a corresponding voltage or signal output change. This change in voltage is captured and analyzed to assess different parameters, as explained in the rest of the figures.
3.2 Impact of piezoelectric sensor sensitivity on energy harvesting
Figure 6 depicts the relationship between energy generation and the sensitivity of a piezo sensor and thus highlights the importance of selecting a piezo sensor with an appropriate sensitivity level to optimize energy generation based on specific application requirements. It shows how the sensor sensitivity impacts the output voltage. A highly efficient or sensitive piezo sensor will generate higher energy pulses even with minimal strains (road bumps) applied to it, as revealed by (Figure 6A). A moderately sensitive sensor will generate moderate energy pulses, as depicted in Figure 6B, while a poorly sensitive sensor will produce significantly lower energy pulses, as represented by Figure 6C.
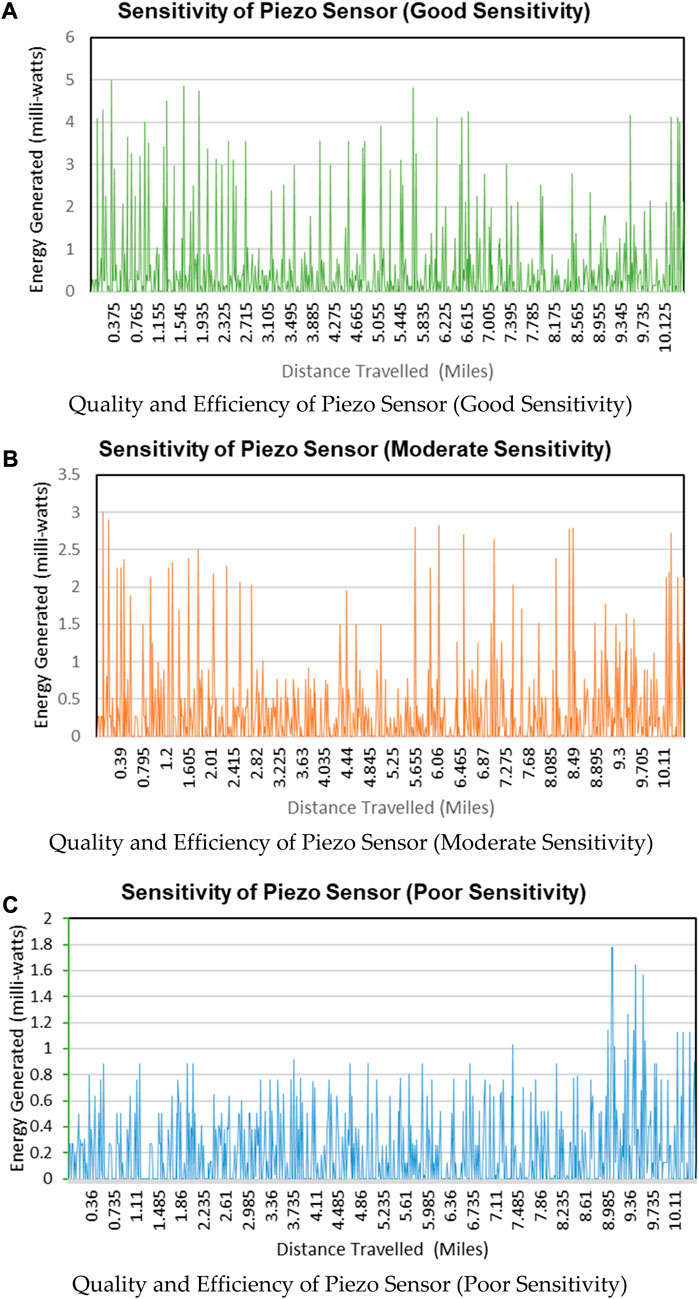
FIGURE 6. (A). Quality and efficiency of piezo sensor (good sensitivity). (B). Quality and efficiency of piezo sensor (moderate sensitivity). (C). Quality and efficiency of piezo sensor (poor sensitivity).
The sensitivity of piezoelectric sensors depends on several factors that include i) the intrinsic characteristics of the piezoelectric material used, such as the piezoelectric coefficient, mechanical quality factor, and dielectric constant, that significantly influence sensor sensitivity, ii) material thickness, as thinner piezoelectric layers generally exhibit higher sensitivities due to increased strain levels and more efficient energy conversion, iii) mechanical resonance frequency, as Operating a piezoelectric sensor close to its mechanical resonance frequency enhances sensitivity, as the material responds more strongly to vibrations at this frequency, and iv) electrode arrangement and design also influence how strain is distributed across the piezoelectric material, affecting sensitivity. Since these parameters vary based on manufacturing quality, we acquired the piezoelectric material from three different vendors, as we acknowledged that the precision and quality of sensor manufacturing influence the consistency and reliability of sensitivity.
Utilizing a piezo sensor with the appropriate higher sensitivity is crucial for the applications described. This sensitivity level allows for accurate recording of road roughness, drivers’ behavior, and evaluation of asphalt quality.
3.3 Application 2- assessment of road roughness
Figures 7A, B illustrate the correlation between voltage amplitude (in volts) and time (in seconds). Through careful analysis, it is evident that voltage amplitude is directly proportional to road roughness. The study investigates five levels of roughness, ranging from moderate (level 1) to highly rough roads (level 5). Peaks observed in both level 1 and level 5 indicate the intensity of roughness, highlighting the influence of road quality, bumps, and potholes on the measured voltage. Notably, level 5 exhibits a significantly higher degree of roughness compared to level 1, which reflects the probable potholes. This graph provides valuable insights into the relationship between voltage amplitude and road roughness, aiding in understanding road quality, bumps, and potholes.
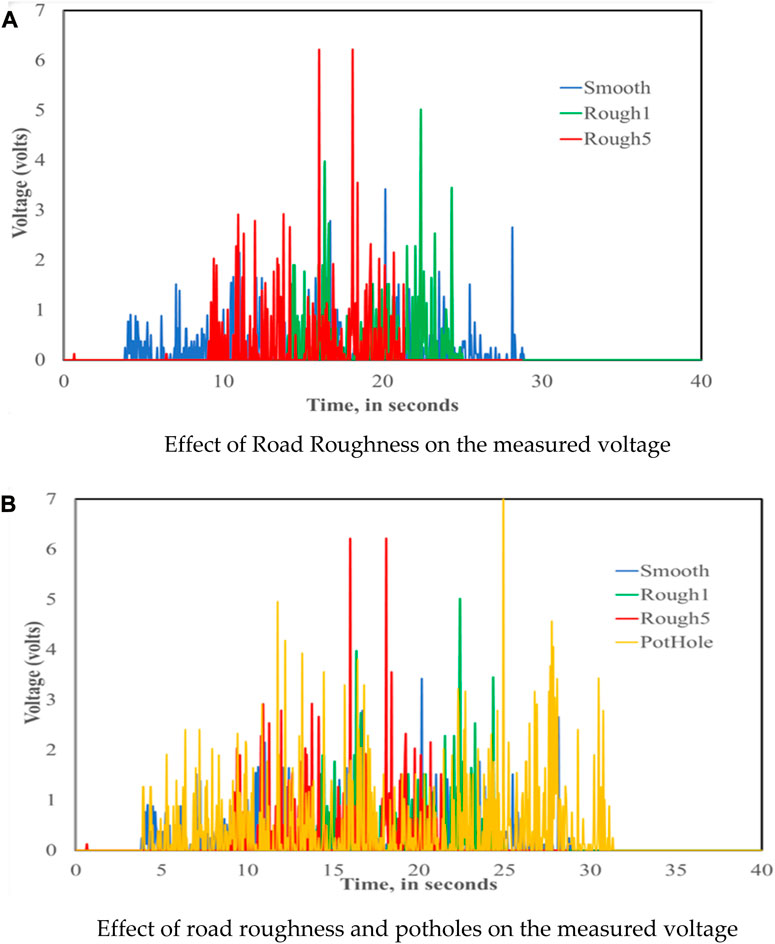
FIGURE 7. (A). Effect of Road Roughness on the measured voltage. (B). Effect of road roughness and potholes on the measured voltage.
As noted, Figures 7A, B depict the correlation between voltage amplitude (in volts) and time (in seconds) for different levels of road roughness. The study investigates five levels of roughness, ranging from moderate (level 1) to highly rough roads (level 5). The observed peaks in both level 1 and level 5 graphs indicate the intensity of roughness in the road. However, level 5 exhibits a significantly higher degree of roughness compared to level 1. The significant difference between instantaneous level 5 and level 1 in terms of road roughness implies that level 5 roads may have probable potholes. Potholes are typically deeper depressions or cavities in the road surface. When a vehicle encounters a pothole, it experiences a sudden jolt or impact, which can lead to a higher magnitude of vibrations and disturbances in the onboard energy scavenging subsystem. Also, the presence of frequent peaks in the voltage amplitude graph indicates a higher occurrence of bumpiness, disturbances, or obstacles on the road surface. This information can aid in assessing road conditions, identifying areas with higher risk for vehicle damage, and informing maintenance efforts to ensure safer and smoother roadways.
We think that capturing instantaneous values capture the nuanced variations in real-time intensity, while RMS carries the scientific merit of revealing trends, patterns, and predictions over time, as RMS values provide a representative measure of the overall energy content of the signal. Instantaneous values shown in Figure 6 enable the nuanced representation of real-time intensity variations, providing a detailed perspective on the immediate fluctuations. On the other hand, RMS values offer the scientific advantage of revealing long-term trends, patterns, and predictive behaviors by quantifying the overall energy content of the signal.
The amount of energy generated by a piezo sensor is influenced not only by the impact of the induced road bump but also by the sensor’s sensitivity, which is determined by the quality of the material used in its construction. Therefore, choosing high-quality materials with excellent piezoelectric properties can significantly enhance the sensor’s sensitivity and increase the energy generated in response to the road bump.
3.4 Application 4- assessment of driving behavior
In addition to the above, the amount of energy generated by a piezo sensor can also be influenced by the By analyzing the data collected from the sensor, it becomes possible to classify the driver’s behavior as either sober, reckless, or risky, as depicted in Figure 8A–C.
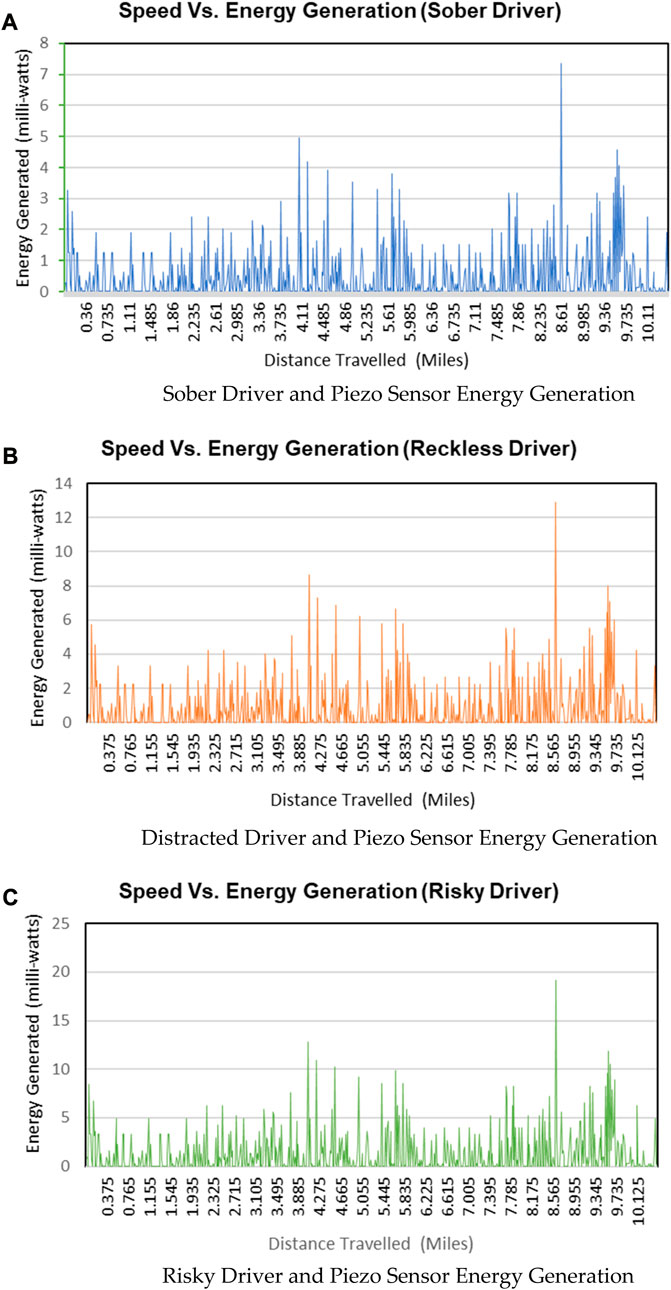
FIGURE 8. (A). Sober driver and piezo sensor energy generation. (B). Distracted driver and piezo sensor energy generation. (C). Risky driver and piezo sensor energy generation.
Different driving behaviors result in varying levels of strain and vibration on the piezo sensor. A sober driver typically maintains a smooth and controlled driving style, resulting in relatively low strain on the sensor. On the other hand, a reckless driver may exhibit sudden accelerations, hard braking, and aggressive maneuvers, leading to higher strain levels. Similarly, a risky driver may frequently encounter bumps, potholes, or uneven surfaces, causing significant strain on the sensor.
Monitoring the energy generation patterns from the piezo sensor and analyzing the associated data makes it feasible to classify the driver’s behavior based on the observed strain levels. This classification can provide valuable insights for various applications, such as driver safety assessments, risk analysis, and driver training programs.
3.5 Application 5- assessment of asphalt quality
In addition to the impact of induced road bumps, the amount of energy generated by a piezo sensor is influenced by the quality of the asphalt surface. Analyzing the data collected from the sensor makes it possible to classify the asphalt quality as top, medium, and low grade, as shown in Figures 9A–C.
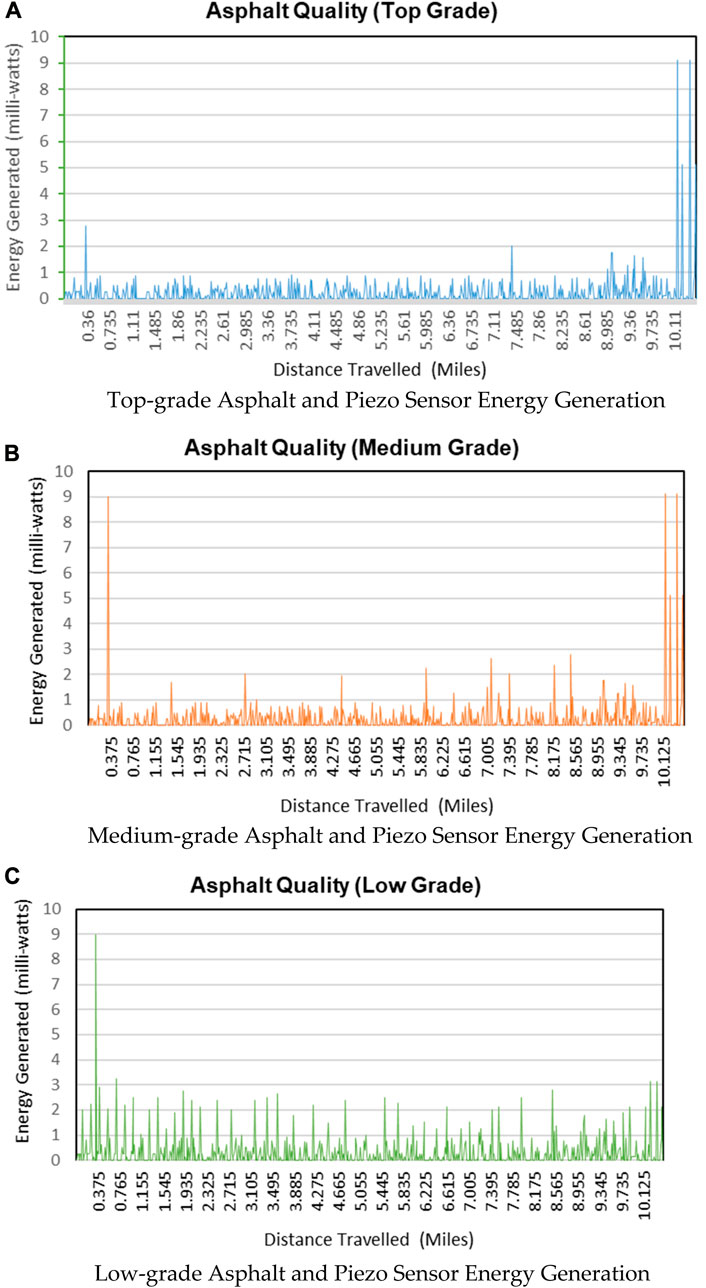
FIGURE 9. (A). Top-grade asphalt and piezo sensor energy generation. (B). Medium-grade asphalt and piezo sensor energy generation. (C). Low-grade asphalt and piezo sensor energy generation.
Different asphalt qualities result in varying levels of strain on the piezo sensor. Top-grade asphalt surfaces typically provide a smoother driving experience and, thus, lower strain levels. Conversely, low-grade asphalt surfaces may exhibit cracks, potholes, and unevenness, leading to higher strain levels. Medium-grade quality asphalt falls somewhere in between, with medium-grade strain levels observed.
Monitoring the energy generation patterns from the piezo sensor and analyzing the associated data makes it feasible to classify the asphalt quality based on the observed strain levels. This classification can provide valuable insights for road maintenance and infrastructure planning, allowing authorities to identify low-grade asphalt areas requiring repair or improvement. Furthermore, it helps assess the overall road condition and ensures safer and more comfortable driving experiences for motorists.
3.6 Application 6- assessment of vehicle health
Graphs in Figures 10A–C illustrate the relationship between the amount of energy generated by a piezo sensor, the type of suspension system, and the impact of induced road bumps. They show that the stiffness of the suspension system influences energy generation, as the suspension system absorbs the impact forces and minimizes vibrations. In the context of energy harvesting using a piezo sensor, the stiffness of the suspension system directly affects the amount of energy generated.
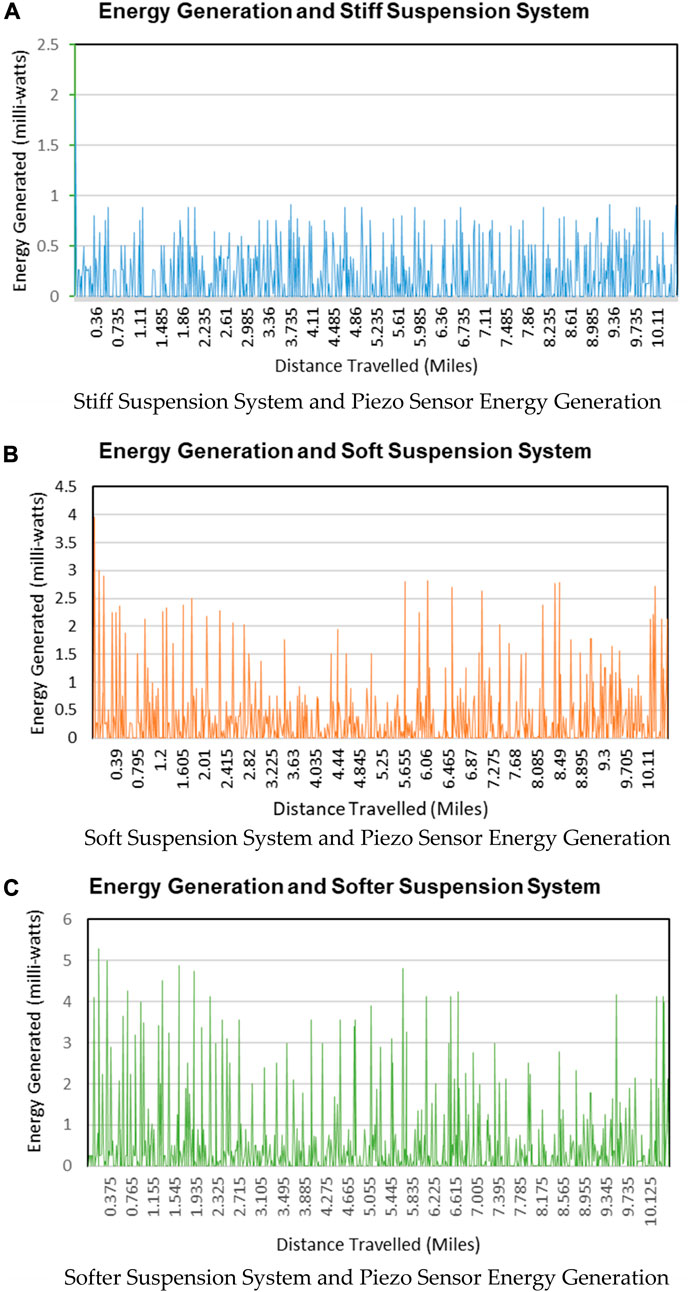
FIGURE 10. (A). Stiff suspension system and piezo sensor energy generation. (B). Soft suspension system and piezo sensor energy generation. (C). Softer suspension system and piezo sensor energy generation.
Figure 10A demonstrates that a stiff suspension system produces less energy than a soft one. This is because a stiff suspension resists the vertical movement caused by road bumps, reducing the mechanical strain and deformation on the piezo sensor. Consequently, less energy is converted from mechanical vibrations into electrical energy.
On the other hand, a soft suspension system, as indicated in Figure 10B, allows more significant vertical movement in response to the road bumps, resulting in increased strain and deformation on the piezo sensor. As a result, more energy is generated by the piezo sensor. Furthermore, Figure 10C indicates that an even softer suspension system produces the most energy. This is because a very soft suspension allows for even greater vertical movement, maximizing the strain and deformation on the piezo sensor and consequently increasing the energy generation. These findings emphasize the importance of evaluating the suspension system characteristics and effective life.
The data collected and analyzed by the proposed onboard energy scavenging subsystem contributes significantly to improved road infrastructure, enhanced vehicle performance, and overall safety through the system’s data collection capabilities that allow for the continuous monitoring of road roughness and potholes. This data can be used by road maintenance authorities to identify areas in need of repair or maintenance, leading to smoother and safer road surfaces. By analyzing data related to road vibrations and conditions, the system can contribute to assessing the quality of asphalt used in road construction. Identifying areas with subpar asphalt can lead to more durable and long-lasting roadways. And the data collected on road vibrations and vehicle responses can help monitor the health of a vehicle’s suspension system. Early detection of issues can prevent mechanical failures and improve overall vehicle performance and comfort. Additionally, the system can provide insights into driver behavior patterns, such as acceleration, braking, and steering. This information can be used to offer personalized feedback to drivers, encouraging safer driving practices and potentially reducing accidents. Above all, the onboard energy scavenging subsystem’s ability to capture real-time road conditions provides overall safety that allows authorities to i) to detection of hazardous situations such as sudden braking, slippery road conditions, or obstacles. This information can be communicated to drivers and relevant authorities for prompt response and accident prevention, ii) use the collected data to make informed decisions about road maintenance, infrastructure development, and traffic management, and iii) in the event of accidents or emergencies, the system’s data can provide valuable insights into the conditions leading up to the incident, aiding emergency responders in understanding the context and providing timely assistance. Overall, the data collected and analyzed by the proposed system empowers road authorities, vehicle manufacturers, and drivers with valuable insights to make informed decisions, optimize road infrastructure maintenance, enhance vehicle performance, and prioritize safety measures. This holistic approach has the potential to lead to safer and more efficient roadways, benefitting both individual drivers and the broader community.
4 Conclusion
In this comprehensive study, we have meticulously analyzed the rich dataset acquired from energy scavenging subsystems integrated within automobiles. Our exploration has illuminated the vast spectrum of their applications, which span from vital road condition monitoring to intricate car health assessment, strategic road maintenance prioritization, and even insightful driver behavior tracking.
At the heart of our endeavor lies a groundbreaking concept—a pioneering system adeptly extracting nuanced road condition data by harmonizing energy-scavenging device outputs, seamlessly integrated GPS coordinates, and precisely recorded timestamps. This fusion, while elegantly simple, holds the potential to revolutionize how we perceive, analyze, and respond to road-related challenges.
While our initial investigations were anchored by a single vehicle, our visionary roadmap foresees a networked fleet of vehicles contributing to a centralized Data Analytics and Display Dashboard (DAD). This forward-looking approach augments the robustness and dependability of our insights, effectively elevating the accuracy and reliability of the information harnessed. Furthermore, the pragmatic implementation of our study, accompanied by the judicious methodology deployed in prototyping, coupled with the tangible outcomes witnessed, substantiates the practical viability of this innovative model for real-world deployment.
In essence, our empirical findings resoundingly endorse the seamless assimilation of this transformative concept into practical domains, marked by attributes of simplicity, reliability, and operational efficiency. The innovation we present transcends technological advancements, extending into a realm of reshaped perspectives on road-oriented predicaments. As we chart our course into the future, this study stands as a cornerstone, laying the bedrock for not only further exploration but also resolute implementation. In essence, it is a pivotal stride towards a future where road infrastructure, vehicle performance, and overall safety converge into a harmonious symphony of enhanced societal wellbeing.
5 Future work
In our current work, we used piezoelectric sensors in suspension systems only; however, in the future, we plan to use them at numerous strategic locations to harness more data. We also plan to perform extensive code development and in-depth data analytics for each application shown in Figure 2.
At this stage, our primary goal is to establish the fundamental relationship between vehicle states, road conditions, and piezoelectric signals. However, in our next phase, we plan to explore frequency domain analysis for comparing piezoelectric signals under different vehicle states or road conditions. This would allow us to delve deeper into the intricacies of the frequency characteristics of the signals and provide a more comprehensive perspective.
We will perform a thorough analysis of instantaneous values and RMS values for voltage peaks. This dual approach will allow us to present future trends and predictions. In our forthcoming work, we will conduct an in-depth analysis encompassing both instantaneous values and RMS values for voltage peaks. This dual-pronged approach will allow us to present not only real-time insights but also forecast future trends and predictive patterns.
Data availability statement
The raw data supporting the conclusion of this article will be made available by the authors, without undue reservation.
Author contributions
RY: Writing–original draft. AB: Data curation, Writing–review and editing. RY and HA: Project administration, Supervision, Writing–review and editing.
Funding
The author(s) declare that no financial support was received for the research, authorship, and/or publication of this article.
Acknowledgments
The authors extend their sincere appreciation to Ms. Mphande Phiri, Mr. James Burrell, Mr. Xavier Crutcher, and Mr. Jairus Morrow, accomplished students from the Department of Electrical Engineering and Computer Science at Alabama A&M University, Huntsville, AL. These individuals made invaluable contributions in the purchase of parts, development of the prototype, and collection of the data. The authors commend their dedicated involvement and exceptional insights and express profound gratitude to these students. Among the authors, Dr. Yaqub conceived the initial concept and crafted the inaugural draft of the manuscript. Dr. Bandyopadhyay meticulously validated the mathematical analysis, engineered the Python Code, and skillfully executed data analytics. Dr. Ali rigorously verified the soundness of the results and conducted multiple comprehensive reviews of the entire manuscript. His invaluable suggestions significantly enhanced the paper’s clarity and coherence.
Conflict of interest
The authors declare that the research was conducted in the absence of any commercial or financial relationships that could be construed as a potential conflict of interest.
Publisher’s note
All claims expressed in this article are solely those of the authors and do not necessarily represent those of their affiliated organizations, or those of the publisher, the editors and the reviewers. Any product that may be evaluated in this article, or claim that may be made by its manufacturer, is not guaranteed or endorsed by the publisher.
References
Abulizi, Nueraihemaitijiang, Kawamura, Akira, Tomiyama, Kazuya, and Fujita, Shun (2016). Measuring and evaluating of road roughness conditions with a compact road profiler and ArcGIS. J. Traffic Transp. Eng. Engl. Ed. 3 (5), 398–411. doi:10.1016/j.jtte.2016.09.004
Ahmad, S., Abdul Mujeebu, M., and Farooqi, M. A. (2019). Energy harvesting from pavements and roadways: A comprehensive review of technologies, materials, and challenges. Int. J. Energy Res. 43 (6), 1974–2015. doi:10.1002/er.4350
Autosinnovate (2023). Alliance for automotive innovation. https://www.autosinnovate.org/.
Baddeley, Glenn (2001). Gps - NMEA sentence information. http://aprs.gids.nl/nmea/.
Beeby, S. P., Torah, R. N., Tudor, M. J., Glynne-Jones, P., O’Donnell, T., Saha, C. R., et al. (2007). A micro electromagnetic generator for vibration energy harvesting. J. micromechanics microengineering 17, 1257–1265. doi:10.1088/0960-1317/17/7/007
Chukwu, Uwakwe C., and Mahajan, Satish M., “Piezoelectric energy-scavenging possibilities in vehicular systems for powering ulpt”, July 2017, Proceedings of the IEEE Power & Energy Society, Chicago, IL, USA
Davidson, J., and Mo, C. (2014). Recent advances in energy harvesting technologies for structural health monitoring applications. Smart Mater. Res. 2014, 1–14. doi:10.1155/2014/410316
De Fazio, R., De Giorgi, M., Cafagna, D., Del-Valle-Soto, C., and Visconti, P. (2023). Energy harvesting technologies and devices from vehicular transit and natural sources on roads for a sustainable transport: state-of-the-art analysis and commercial solutions. Energies 16, 3016. doi:10.3390/en16073016
Gazoni, Eric, and Clark, Charlie (2010). A python library to read/write excel 2010 xlsx/xlsm files — Openpyxl 2.4.4 documentation. https://openpyxl.readthedocs.io/en/default/.
Motus engineering solutions (2023). Accelerometer limitations. http://www.motusbioengineering.com/accelerometer-limitations.htm.
Muthukadan, Baiju (2011). Selenium with python — Selenium python bindings 2 documentation. http://selenium-python.readthedocs.io/.
Ndoye, M., Barker, A. M., Krogmeier, J. V., and Bullock, D. M. (2011). A recursive multiscale correlation-averaging algorithm for an automated distributed road-condition-monitoring system. IEEE Trans. Intelligent Transp. Syst. 12, 795–808. doi:10.1109/TITS.2011.2132799
Peng, C., Merat, N., Romano, R., Hajiseyedjavadi, F., Paschalidis, E., Wei, C., et al. (2022). Drivers’ evaluation of different automated driving styles: is it both comfortable and natural? Hum. Factors, 187208221113448. doi:10.1177/00187208221113448
Rode, Sudarshan S., Vijay, Shonil, Goyal, Prakhar, Kulkarni, Purushottam, and Arya, Kavi (2023). Pothole detection and warning system using wireless sensor networks. retrieved from https://www2.ee.washington.edu/research/nsl/aar-cps/PrakharGoyal-20081021025613.pdf.
Shaikh, F. K., and Zeadally, S. (2021). Energy harvesting in wireless sensor networks and Internet of things. England: IET Digital Library. doi:10.1049/pbce124e
US Department of Transportation (2023). US department of transportation. https://www.transportation.gov/.
Yaqub, R., Ahmad, H., Nasir, A., Boakye-Boateng, , and Wang, Y., “System architecture for ride portfolio reporting employing energy harvesting scheme”, Proceedings of the International Conference on Connected Vehicles and Expo (ICCVE), December,2012, Beijing, China
Zhang, H. Y., Cheng, Z. G., and Han, B. H., “Overview of suspension system dynamics analysis,” Proceedings of the 9th Global Conference on Materials Science and Engineering (CMSE 2020), November 2020, Kyiv, Ukraine
Glossary
Keywords: GPS data logging, data analysis, piezoelectric energy scavenging, data processing, timestamping
Citation: Yaqub R, Bandyopadhyay A and Ali H (2023) Exploring the potential of onboard energy scavenging subsystems for generating valuable data. Front. Energy Res. 11:1259676. doi: 10.3389/fenrg.2023.1259676
Received: 16 July 2023; Accepted: 25 August 2023;
Published: 12 September 2023.
Edited by:
Praveen Kumar Donta, Vienna University of Technology, AustriaReviewed by:
Pallavi Joshi, Amrita Vishwa Vidyapeetham, IndiaDivya S, Yeungnam University, Republic of Korea
Copyright © 2023 Yaqub, Bandyopadhyay and Ali. This is an open-access article distributed under the terms of the Creative Commons Attribution License (CC BY). The use, distribution or reproduction in other forums is permitted, provided the original author(s) and the copyright owner(s) are credited and that the original publication in this journal is cited, in accordance with accepted academic practice. No use, distribution or reproduction is permitted which does not comply with these terms.
*Correspondence: Raziq Yaqub, cmF6aXEueWFxdWJAYWFtdS5lZHU=