 Haonan Zhang
 Youwen Tian1*
 Yi Zhao
95% of researchers rate our articles as excellent or good
Learn more about the work of our research integrity team to safeguard the quality of each article we publish.
Find out more
ORIGINAL RESEARCH article
Front. Energy Res. , 31 August 2023
Sec. Sustainable Energy Systems
Volume 11 - 2023 | https://doi.org/10.3389/fenrg.2023.1258689
This article is part of the Research Topic Modeling Practice and Mechanism Design of Green Energy Systems towards Sustainable Development View all 18 articles
Introduction: In recent years, with the rapid development of renewable energy generation, the stability of the power grid has been greatly reduced. In response to this problem, integrating the user side transferable load into the power market has become the key to the development of future power grid. At present, large transferable loads have entered the electricity market in some pilot areas of China, but the relevant research on small and medium-sized transferable users entering the electricity market is still few.
Methods: This paper proposes the concept of generation load aggregators. A two-stage generation load aggregator robust optimization model is developed to obtain the scheduling scheme with the lowest operating cost under the worst scenario. The model consists of distributed renewable power, transferable load, self-provided power, energy storage, etc. Uncertainties of renewable energy and load are introduced in the model. By using the column constraint generation algorithm and strong pairwise theory, the original problem is decomposed into the main problem and sub-problems to be solved alternately, so as to obtain the scheduling scheme with the lowest operating cost in the worst scenario under different conservatism.
Results: The solved results are compared with those without the generation load aggregator, illustrating the role of the generation load aggregator in relieving peak and valley pressure on the grid from the load side, reducing the cost of electricity for loads, and promoting the consumption of renewable energy. The comparison with the deterministic optimization algorithm shows a significant decrease in the total cost and validates the performance of the selected solution algorithm. The boundary conditions for the use of energy storage by generation load aggregators for peak and valley reduction under the time-sharing tariff mechanism are also derived.
Discussion: This study can provide reference for the investors of generation load aggregators when planning whether to install energy storage or the scale of energy storage, and also help the power market management department to design a reasonable incentive mechanism.
In recent years, with the rapid development of wind power, photovoltaic, and other renewable energy generation, the intermittent volatility of renewable energy generation has posed an increasing challenge to the power grid, and the problem of curtailed wind and PV caused by the balance of supply and demand power has become increasingly prominent. In addition, the gradual increase in the peak-to-valley load difference and the continuous growth of peak loads have reduced the stability of the safe operation of the power market (Li and Wang, 2021; Wu et al., 2022b; Sambodo et al., 2022). In response to the aforementioned problems, incorporating customer-side transferable loads into the power system has become the key to future grid development. Transferable loads are loads that actively respond to price signals and incentives to change the behavior of the original electricity consumption pattern (Chen et al., 2021). At this stage, large transferable loads have entered the power market in some pilot areas in China and are dispatched by the grid company. Research related to the access of small- and medium-sized transferable users to the power market remains scarce. To solve this problem, the concept of generation load aggregators is proposed in this paper. Small- and medium-sized transferable users sign agency contracts with generation load aggregators, and users participate in the electricity market through generation load aggregators. The generation load aggregator is mainly a load aggregator, which also aggregates distributed energy, energy storage, electric vehicles, self-provided generator on the load side, etc. Load aggregators are able to consolidate dispersed adjustable potential to form the scalable user-adjustable capacity that the market needs and respond to the grid’s price signals for profit (Li et al., 2022). When power consumption peaks or other periods of high electricity prices, power sources, and energy storage in generation load aggregators choose to operate at high power, at the same time, the transferable loads therein operate at as low a power as possible. When the power supply runs at a low power or even shuts down during low hours or other periods of lower electricity prices, the energy storage will charge and the transferable load will use electricity at a higher power at this time. The generation load aggregator participates in the market bidding for load regulation behavior as a demand response product, and the winning load resource is compensated with the corresponding market clearing price. The difference between generation load aggregators and electric power companies is that they do not make money in the same way. Electric power companies primarily make money by buying low and selling high. Generation load aggregators earn grid regulation fees primarily by regulating electricity use. The difference between generation load aggregators and microgrids is in the integrity of the system. Microgrids are smaller, decentralized, stand-alone systems that can be operated individually for extended periods. The generation load aggregators rely mainly on purchasing power in the electricity market, where the captive power supply is not sufficient to support the load for a long period. The difference between generation load aggregators and virtual power plants is their different roles in the electricity market. The virtual power plant belongs to the generation side, and the generation load aggregator is effectively an adjustable electricity consumer.
Economic scheduling of aggregators is a hot issue in research related to aggregators, generally intending to minimize operating costs. Smaller operating costs with constant revenues imply higher profits (Iria et al., 2020; Kim et al., 2022). Zhang et al. developed a two-stage optimization model for industrial load aggregators considering the uncertainty of load response and the satisfaction of users (Zhang et al., 2018). Xu et al. established an optimal scheduling model for an electric vehicle charging aggregator to solve the profit maximization of the aggregator by genetic algorithm (Xu et al., 2020). With the development of distributed energy sources, energy storage, etc., aggregators contain not only industrial and residential loads but also distributed power output from photovoltaic, wind power, etc., and the stochastic nature of load power consumption brings challenges to the operation of aggregators (Sheikhahmadi et al., 2018). How to effectively cope with the uncertainties within the aggregator and achieve reliable and economical operation has become the key to the study of the economic scheduling problem of aggregators (Xu et al., 2020). For such problems, stochastic programming is often used to model uncertain variables and simulate the impact of uncertainty on the operation of aggregators’ stochastic programming which uses random variables to describe uncertain information and optimizes to obtain the scheduling solution with the minimum expected cost (Kim et al., 2021). The key to stochastic programming is to model uncertain variable properties with a limited number of scenarios (Wang and Nie, 2022). Vahid-Ghavidel proposed a hybrid stochastic optimization model to deal with electricity market price and consumer participation rate uncertainty (Vahid-Ghavidel et al., 2021). Vatandoust described the joint optimization of electric vehicles and energy storage aggregators in the day-ahead electricity market to improve the profitability of the aggregators with a stochastic mixed integer linear programming model considering the uncertainty of energy and frequency regulation prices (Vatandoust et al., 2019). Since stochastic programming methods seek the solution set with the maximum/minimum expected value of the objective function, the risk of irrational decision making exists for a certain scenario. Nguyen combined stochastic programming and conditional value-at-risk constraint methods so that the expected return in the corresponding scenario is not lower than the given confidence level, thus reducing the system risk (Nguyen and Le, 2015). However, both stochastic programming and scenario analysis methods require deterministic probability curves to generate scenarios, which may lead to models that are not accurate enough to reflect the actual situation (Wang et al., 2015a).
Compared with the aforementioned methods, robust optimization replaces the exact probability distribution of random variables with an uncertainty set and obtains the scheduling solution of the system under the “worst-case” scenario through optimization, which is more suitable for practical engineering needs (Alvim et al., 2021). Lu considered the uncertainty of charging and discharging of EV aggregators, built a two-stage robust optimization model, used distributed robust optimization to improve the average economic performance of the model, and applied Farkas’ Lemma and robust optimization to ensure the safety of the distribution system operation (Lu et al., 2021). Najafi proposed a hybrid decentralized robust optimization-stochastic programming (DRO-SP) model based on the multiplicative alternating direction method to coordinate the optimization of load aggregators, using a stochastic programming approach to model the uncertainty of the electric vehicle model and a robust optimization approach to model the uncertainty of the location marginal price (Najafi et al., 2021). Wang proposed a distribution uncertainty model where the probability distribution of load power can vary around a given reference distribution (Wang et al., 2015b). However, the robust models in the aforementioned literature do not allow for flexible adjustment of the conservativeness of the scheduling scheme.
The main contributions of this research can be summarized as follows.
1. To solve the problem that small- and medium-sized adjustable users on the load side are difficult to enter the electricity market, this paper proposes the concept of generation load aggregators for the first time. The basic framework of the generation load aggregator is built, and a robust optimization model of a two-stage generation load aggregator with a min–max–min structure is established.
2. The model considers the coordinated control of PV power sources, load uncertainty, energy storage, two types of industrial transferable loads, and distributed power sources within the generating load aggregator. Using a column-constrained generation algorithm and strong pairwise theory obtains an economic dispatch scheme for the worst-case scenario under different conservatisms. Uncertainty adjustment parameters have been added to the scheme to provide flexibility in choosing the degree of conservatism in the scheduling scheme.
3. The solved results are compared with other sets of results to determine that the generation load aggregator model has the effect of relieving the peak and valley pressure on the grid, reducing the cost of electricity for loads, and promoting the consumption of renewable energy. The dispatch program obtained can withstand the risk of real-time market price fluctuations in electricity. We derive the boundary conditions for the analytical model to use energy storage for peak shaving and valley filling under the time-of-day tariff mechanism, which will provide a theoretical basis for the future construction planning of generation load aggregators as well as the entry of small- and medium-sized adjustable users into the electricity market.
The main study of this paper is as follows. The first part, as the introductory part of the article, briefly introduces the background of the study as well as the research progress on the issues related to generation load aggregators in recent years. The second part builds the framework of the generation load aggregator system. The third part is to develop a two-stage robust optimization model for generation load aggregators. The fourth part is the numerical simulation and the related discussion and analysis of the results. The fifth part is the summary of the paper and the prospect of future research.
Figure 1 shows the basic framework of a generation load aggregator, which consists of a collection of distributed PV, self-provided generator, energy storage, transferable load, and other components. The transferable load can be divided into the start/stop time delay-type transferable load and power sizing-type transferable load due to the actual needs of the industry. Generation load aggregators provide an opportunity for small- and medium-sized customers to participate in the regulation of the electricity market. Small- and medium-sized customers do not reach the minimum level of load elasticity to participate in demand response and cannot find a way to participate in power trading. As an intermediary, a generation load aggregator can integrate customer demand response resources and bring them into the market for trading, making idle load resources useful while relieving the pressure on the power system from the load side during special times such as peak and valley. On the other hand, power generation load aggregators fully explore the potential of load demand response, under the help and guidance of power generation load aggregators, and form a scientific and economic way of electricity consumption, to reduce the cost of electricity for users. The generation load aggregator needs to summarize the electricity consumption curve of the load on D-1, the generation curve of each power source, and the curve of the need to buy or sell electricity from the external grid before day D. If the reported curve is different from the actual curve, it needs to buy or sell electricity from the external grid.
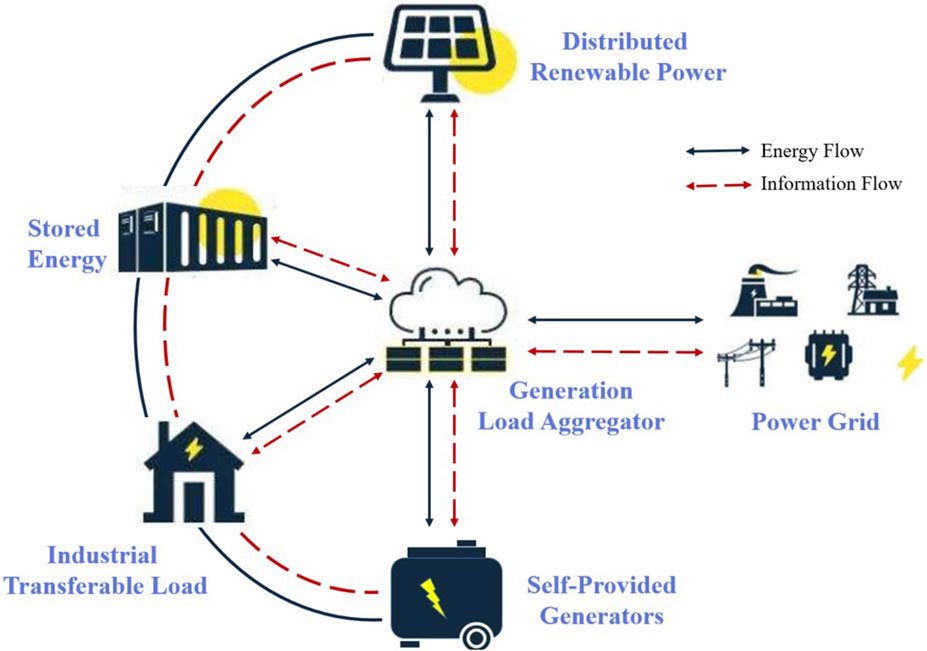
FIGURE 1. Structure of generation load aggregators.
The self-provided generator of the generation load aggregators are mainly micro-gas turbines, and the cost of micro-gas turbine generation
where
where
The cost of energy storage
where
Equation 4 and Equation 5 are the charging/discharging power constraints of energy storage, which are the maximum charging/discharging power of energy storage, mainly limited by the capacity of the grid-connected inverter, respectively.
Industrial loads have some differences in control and scheduling methods due to different factors such as industry, production shift system, and operation of power-using equipment. Most industrial transferable loads can be divided into two categories: start–stop time delay and power size regulation (Kumar et al., 2022).
The start–stop time delay of transferable load is a more common type of transferable load. Except for the start–stop periods, the start–stop time delay class of transferable loads consumes relatively flat power for most of the work cycle. And with thermal inertia, starting after a short delay does not affect production. However, the load curve must shift in time as a whole, as shown in Figure 2A.
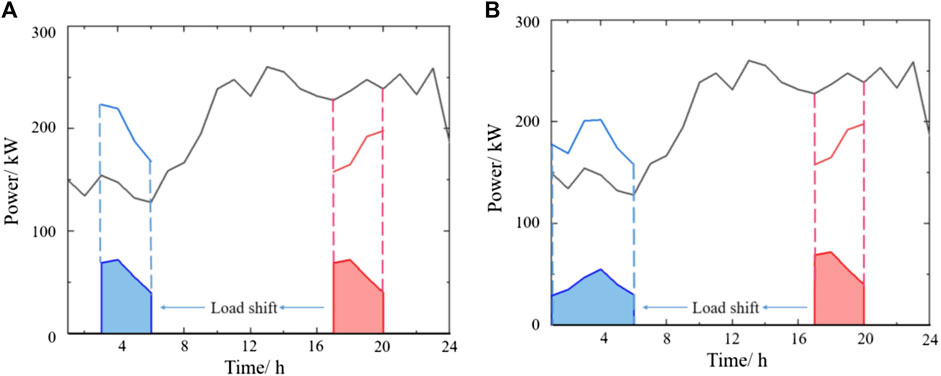
FIGURE 2. (A) Schematic diagram of start–stop time delay transferable load and (B) schematic diagram of power sizing transferable load.
The power consumed by the start–stop time delay type of transferable loads is shown as follows:
where
Considering the case where the generation load aggregator contains a start–stop time delay type of transferable load, its electricity consumption characteristics in providing load regulation services can be expressed by the following constraint:
where
Since the daily load of the start–stop time delay transferable load is relatively stable, the starting and interruption time of each start–stop time delay transferable load is relatively fixed. The power plan of the transferable load can be adjusted, and the regulation of the transferable industrial load can be achieved by appropriately advancing or delaying the start/stop time. However, the change in the schedule will affect the industrial customers’ habitual use of electricity. Therefore, the generation load aggregator needs to be compensated appropriately, and the dispatch cost
where
Power sizing transferable load is another common type of regulated industrial load. This type of load reduces the peak-to-valley load difference and reduces operating costs by transferring the power size during peak hours to other load hours, as shown in Figure 2B.
The power of the transferable load of the power sizing type can be expressed by the following equation:
where
Considering the case of a generation load aggregator that contains a transferable load of the power sizing regulation type, its electricity consumption characteristics during the provision of load regulation services can be expressed by the following constraint:
where
The power sizing transferable load can also flexibly adjust the demand response load schedule, but the generation load aggregator also needs to compensate the transferable load enterprise, and the dispatch cost
where
When the self-provided generator, renewable energy, and energy storage within the generation load aggregator cannot meet the load demand, it needs to purchase power from the external grid; conversely, the generation load aggregator can sell the surplus power to the external grid to obtain revenue (Jiang et al., 2021). The interactive power between the generation load aggregator and the external grid is subject to the following balancing constraints:
where
The interactive power between the generation load aggregator and the external grid needs to satisfy
where
where
The generation load aggregator model has the minimum daily operating cost as the optimization objective, as shown in Eq. 22, and the model constraints include Eq. 2, Eq. 4–Eq. 7, Eq. 9–Eq. 14, Eq. 16–Eq. 21, and Eq. 23–Eq. 24.
When the uncertainties of PV and load are not considered, the deterministic optimization model for the aforementioned generation load aggregator economic dispatch problem can be formulated in a compact form as
where
where
where
The aforementioned model is a mixed-integer linear programming problem, which can be solved by deterministic optimization methods, and the optimal solution depends on the accuracy of the predicted values. However, generation load aggregators are affected by many stochastic factors, which makes it difficult to guarantee prediction accuracy. In summary, deterministic optimization schemes often appear to be too “risky."
Therefore, in practice, the impact of uncertainty on the model needs to be accounted for. The box uncertainty set
where
The objective of the two-stage robust optimization model for generation load aggregators constructed in this paper is to find the economically optimal scheduling solution for the worst-case scenario of uncertain variables
where the outer layer is minimized to the first stage master problem with the optimization variable
where
For each set of uncertain variables
For the aforementioned two-stage robust optimization model of the generation load aggregator, the column constraint generation algorithm (C and CG) is chosen to solve the model (Fanzeres et al., 2020). The C and CG algorithm is similar to the Benders decomposition algorithm in that the problem is first decomposed into a master problem and a subproblem and solved alternatively to obtain the optimal solution to the original problem (Alvarez et al., 2020). The difference between the two algorithms is that the C and CG algorithm continuously introduces variables and constraints related to the subproblems in the process of solving the master problem to obtain more compact lower bounds on the objective function values, thus reducing the number of iterations (Shi et al., 2020).
The decomposition of Equation 31 yields a master problem of the form
where
The decomposed subproblem takes the form
From the aforementioned analysis, the inner minimization of Eq. 34 is a linear problem for a given set of
where there exists a bilinear term
where
where
After the aforementioned derivation and transformation, the two-stage robust optimization model for the generation load aggregator is decoupled into the main problem and subproblem with a mixed integer linear form, and the model is solved by the C and CG algorithm, shown in Figure 3.
1) The uncertain variable
2) The first stage of a two-stage robust optimization: The master problem in Eq. 33 for the optimal solution
3) The second stage of a two-stage robust optimization: The solution
4) The convergence threshold is set to
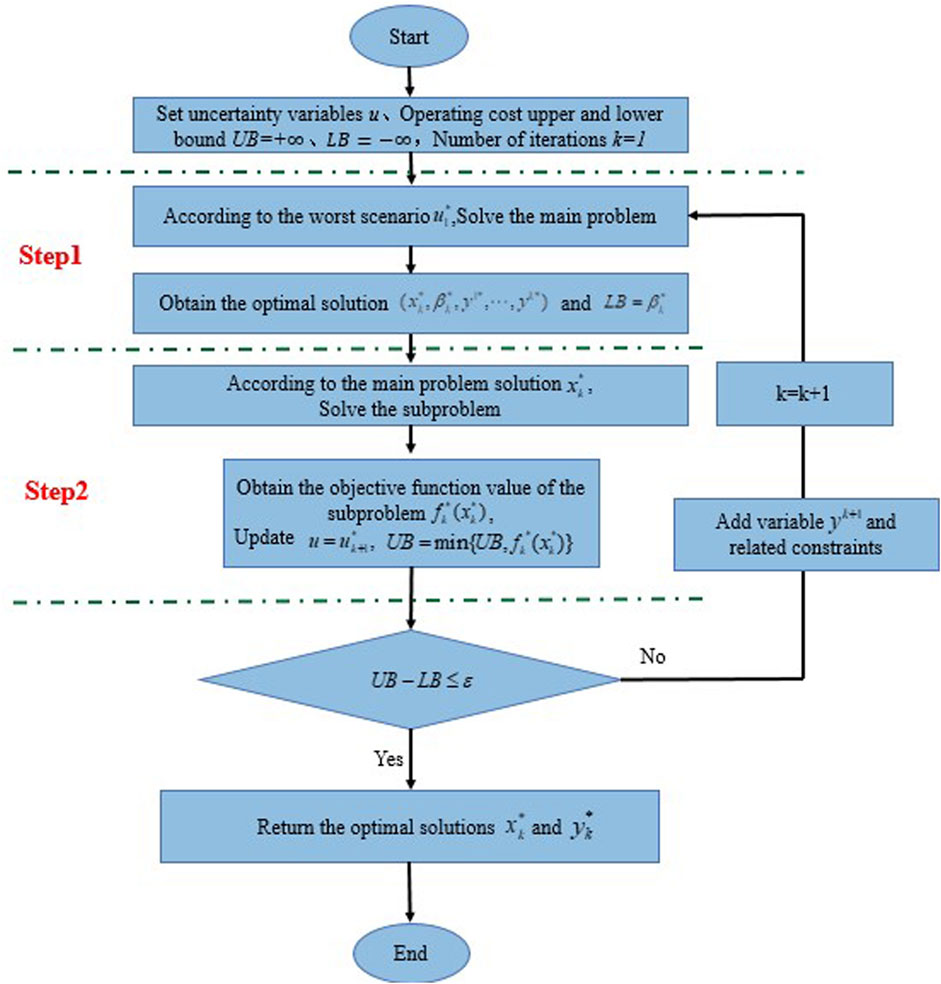
FIGURE 3. Flow chart of the two-stage robust optimization model.
Let
The generation load aggregator shown in Figure 1 is used as an example for this study. The simulation analysis includes three aspects: economic scheduling of generation load aggregator, comparison among optimization models, and boundary conditions of energy storage scheduling.
In the economic scheduling scheme of the generation load aggregator, the uncertainty regulation parameter of the load power is set to 12, which means that the load power will reach the maximum value of the forecast interval for at most 12 periods during the scheduling optimization process (Liu et al., 2018). The uncertainty regulation parameter of the PV output is set to 6, which means that the minimum value of the forecast interval will be reached for at most six periods during the optimization process and the rest of the periods will be equal to the forecast value. The operating parameters of the generation load aggregator during the simulation are shown in Table 1(Li, 2020).
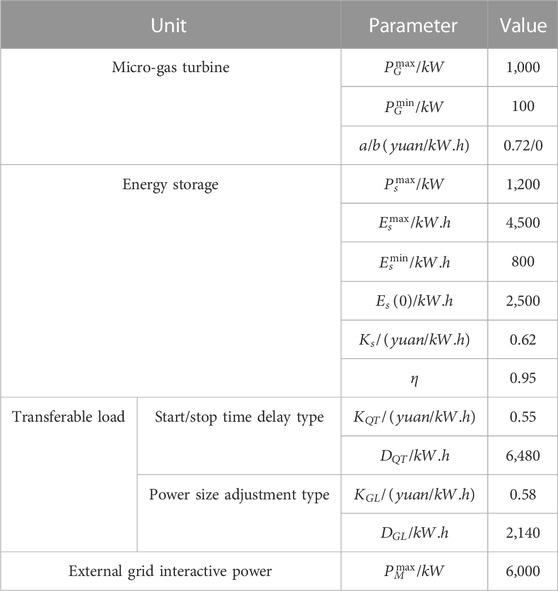
TABLE 1. Operating parameters of generation load aggregators.
In practice, the maximum allowed fluctuation deviation of load power and PV output within the generation load aggregator can be set based on the historical forecast deviation in the past. This article takes as an example a typical weekday on a sunny spring day in Yongqiang Industrial Park in Shenyang, Liaoning Province, China. The predicted curves and actual curves of its load power and photovoltaic output are shown in Figures 4A,B, respectively. Also, the shaded parts are the uncertainty sets considered in this paper with values of 10% and 15% of the predicted values of load power and PV output (China, National Education Association, 2013). The residential electricity step tariff of a city in China is used as the day-ahead trading tariff for power exchange between the external grid and the generation load aggregator, as shown in Figure 4C.
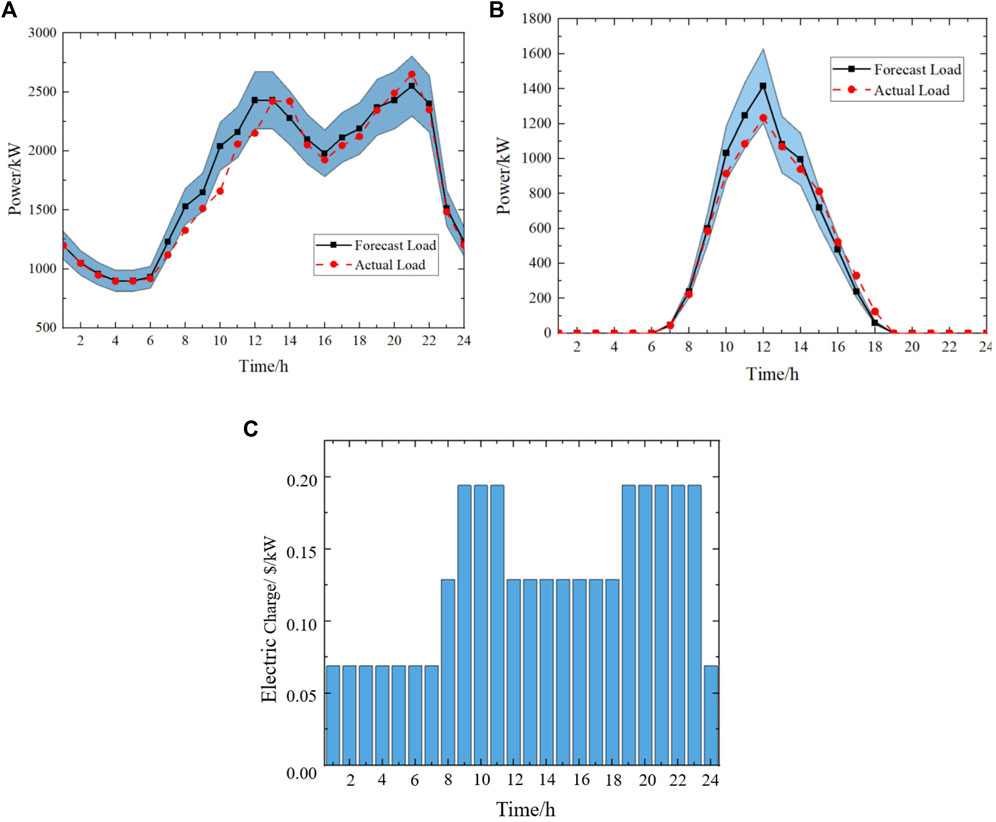
FIGURE 4. (A) Forecast/actual load power curve of a typical working day at Yongqiang Industrial Park in Shenyang, (B) forecast/actual PV output curve for a typical working day at Yongqiang Industrial Park in Shenyang, and (C) external grid day trading tariff.
The two-stage robust generation load aggregator scheduling optimization process used in this example is shown in Figure 5A, and it stabilized in the 2nd iteration.
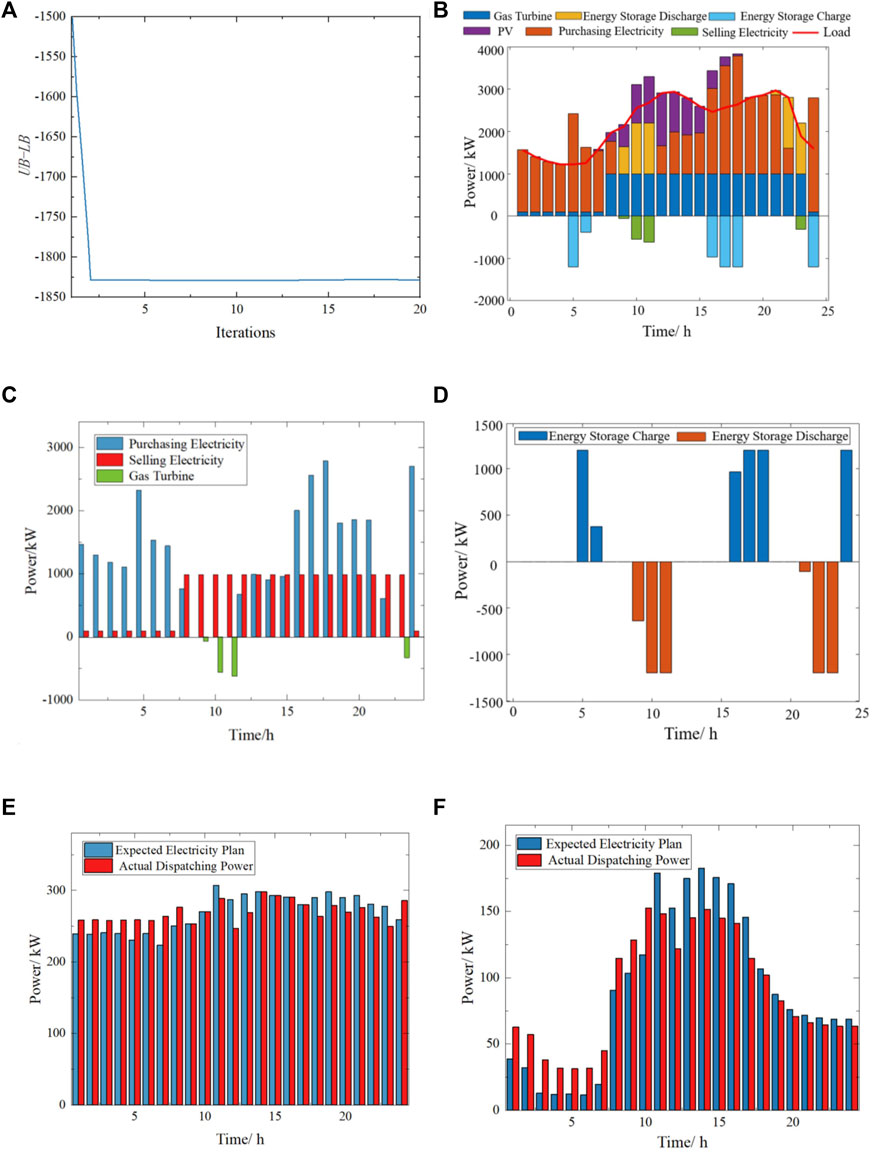
FIGURE 5. (A) Two-stage robust generation load aggregator scheduling optimization process, (B) power of each component within the generation load aggregator after two-stage robust optimization, (C) micro-gas turbine output power and generation load aggregation commercial power purchase and sale, (D) energy storage charging and discharging power, (E) start/stop time delay type transferable load actual/desired power consumption plan, and (F) power sizing-type transferable load actual/desired electricity usage plan.
The scheduling results are shown in Figures 5A-E. Figure 5B shows the overall results of the two-stage robust generation load aggregator optimized scheduling. Figure 5C shows the micro-gas turbine output power and the power purchased and sold by the generating load aggregator to the external grid, taking negative values when the generating load aggregator purchases power from the external grid. Figure 5D shows the energy storage charging and discharging power, negative when charging and positive when discharging. Figure 5E shows the start–stop time delay transferable load actual and desired power usage schedule. Figure 5F shows the power sizing transferable load actual and desired power usage schedule.
As shown in Figure 5B, in 1–7 h and 19–24 h, the PV output is 0, and the load of the generation load aggregator relies entirely on the micro-gas turbine, energy storage, and external grid supply. At this time, when the day-ahead traded tariff of the external grid is lower than the unit power generation cost of the micro-gas turbine, the micro-gas turbine operates at the minimum output power, as shown in Figure 5C for 1–7 h and 24 h. During the rest of the period, the micro-gas turbine outputs maximum power, reducing the purchased power to the external grid (e.g., 8 h, 12–22 h, and 24 h) and selling power to the external grid during peak tariff hours (e.g., 9–11 h and 23 h), thus reducing operating costs.
As can be seen in Figure 5D, under the time-sharing tariff mechanism and the periodic conditions of PV output, the charging of energy storage units during lower tariff hours or PV output hours, such as 5–6 h, 16–18 h, and 24 h, and discharging during peak tariff hours, such as 9–11 h and 21–23 h, can achieve not only peak shaving and valley filling but also lower operating costs. As shown in Figure 5E, the expected electricity consumption plan for the start–stop time delay type of transferable load is not much different from the peak and valley values of the load compared to the conventional load due to the three shifts. However, the system reformulates the production plan without affecting the conditions of production, advance, or stagger part of the load. The system will arrange as many loads with large power as possible during the period of low electricity prices, such as transferring part of the electricity power from 11–13 h to 6–8 h and transferring part of the electricity power from 18–23 h to 24–5 h. Because the system works 24 h a day, the operational space for load shifting is not very large. This observation was also made by Chen (2020). As shown in Figure 5F, the desired electricity consumption schedule for the power sizing type of transfer loads is similar to that of conventional loads, with electricity consumption mainly concentrated in peak tariff hours. Under the premise of satisfying the total electricity demand and the electricity consumption constraint of each period, the power consumption in the 11–24 h period is reduced and the power consumption in the 1–10 h period is increased, thus reducing the power that the generation load aggregator needs to purchase in the peak tariff period.
In the absence of a generation load aggregator, small- and medium-sized transferable loads can only be purchased from the external grid as non-regulated loads, without subsidies for peak and valley shifting, because their electricity consumption and regulation do not meet the requirements for participation in the electricity market. Power generation and energy storage cannot participate in power market trading due to the small installed capacity, and the electricity generated will not be sold to the external grid and can only be used as a self-provided generator for the load (Khan et al., 2021; Wu et al., 2022a). Its daily operating cost is shown in Eq. 39, with constraints as in Eq. 2, Eq. 4–Eq. 7, and Eq. 23.
where

TABLE 2. Comparison of operating costs of systems optimized with and without generation load aggregators.
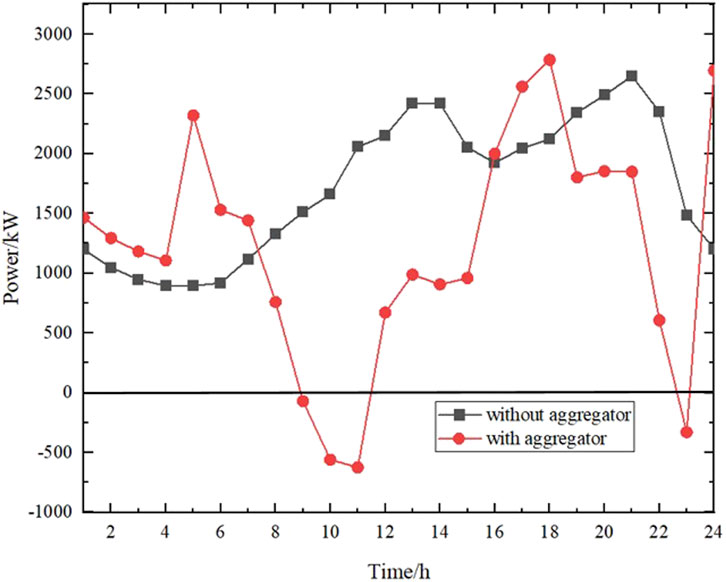
FIGURE 6. Comparison of power purchased from the grid by loads with and without generation load aggregator.
Table 3 shows the comparison of the cost of electricity consumption for each type of load with and without generation load aggregators. The costs of electricity consumption for the start/stop time delay-type transferable load, power sizing-type transferable load, and the non-regulated load are $696, $229, and $3,796, respectively, in the absence of a generation load aggregator. With load aggregators, the cost of electricity drops to $563, $84, and $3,786, respectively. Power sizing-type transferable load has the largest percentage reduction in electricity costs due to its deeper involvement in peak shaving and valley filling. The non-regulated load does not participate in peak and valley reduction, but the cost of electricity consumption is reduced due to the presence of generation and storage components. In summary, the rationale for the participation of each type of load in the generation load aggregator and the function of the generation load aggregator to reduce the cost of electricity for the load can be demonstrated.
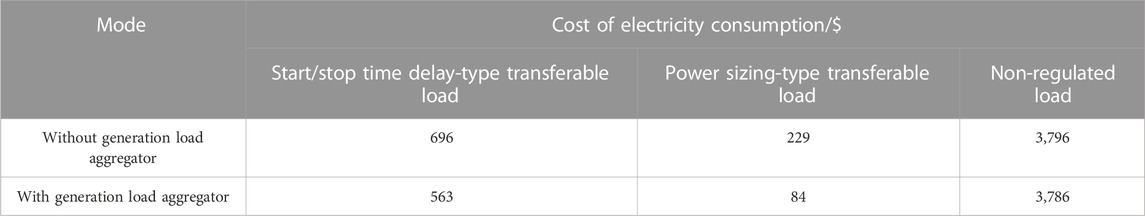
TABLE 3. Comparison of electricity costs for various types of loads with and without generation load aggregators.
The two-stage robust generation load aggregator optimization model proposed in this paper and the deterministic optimization model (Hansen et al., 2015) are compared in two dimensions: the effectiveness of determining the worst-case scenario and the performance of the chosen method.
The two-stage robust generation load aggregator optimization model is based on the uncertainty regulation parameters
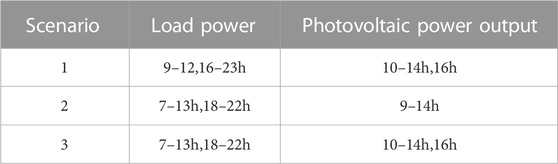
TABLE 4. Parameterization of deterministic optimization models in three scenarios.
The two-stage robust generation load aggregator optimization model and three deterministic optimization models were used to solve the day-ahead operating costs of the generation load aggregators, and the results are shown in Table 4. In Scenario 1, the load power is taken to all peak hour tariff periods as the maximum period of the forecast interval. In Scenario 2, the PV output minimum period of the deterministic optimization model increases the peak tariff period by 9 h compared to the robust model. However, the day-ahead operating costs of both scenarios are lower than the results of Scenario 3. The time selected for Scenario 3 is the same as that for the deterministic optimization model, and the day-ahead operating cost is also the same.
To verify the flexibility of the two-stage robust generation load aggregator optimization model to adjust the conservativeness of the scheduling scheme, five sets of uncertainty regulation parameters, as well as a set of deterministic optimization models, are selected to compare the results. The parameter settings, corresponding day-ahead operating costs, purchased power, and sold power are shown in Table 5.
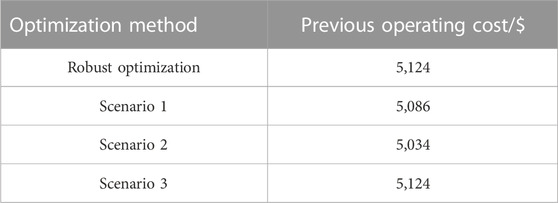
TABLE 5. Comparison of operation cost between the robust optimization model and deterministic optimization model.
As can be seen from Table 6, the results of the uncertainty robust optimization model are the same as those of the deterministic optimization model with a day-ahead operating cost of $4,575 for the uncertainty adjustment parameter. As the uncertainty in the regulation parameters increases, the operating cost of the generation load aggregator increases as well, amounting to $5,346 for groups
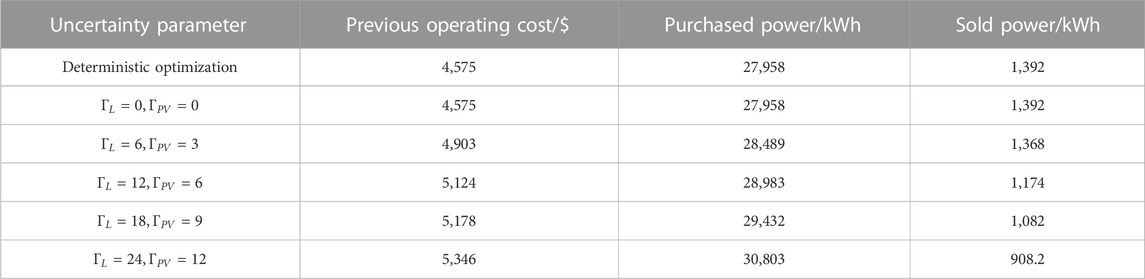
TABLE 6. Day-ahead operating costs and purchased/sold power for generation load aggregators with different uncertainty regulation parameters.
The operating cost of the generation load aggregator using the deterministic optimization model in Table 6 is smaller than that of the robust optimization model, but this does not mean that the deterministic optimization model is “better” than the robust model. The generation load aggregator needs the corresponding generation and consumption plan submitted in the day-ahead market, and the inequality between the planned generation and the actual volume on day 2 caused by the forecast error needs to be purchased in the real-time market (Lankeshwara et al., 2022). Electricity purchase prices in the real-time market are generally higher than those in the day-ahead market, and electricity sales prices are generally lower than those in the day-ahead market (Agrawal, 2022), so forecast errors can lead to higher final transaction costs. In summary, the scheduling scheme obtained from the robust optimization model has stronger robustness and the ability to resist the risk of real-time market price fluctuations. To verify the aforementioned conclusions, the performance of the two-stage robust optimization method and the deterministic optimization method proposed in this paper is compared with
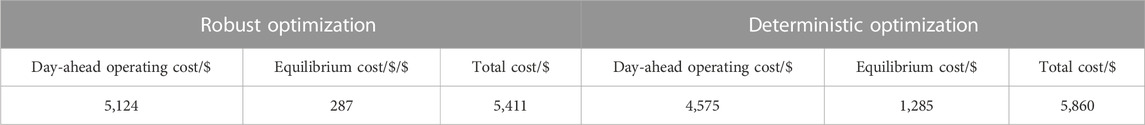
TABLE 7. Comparison of the final operating costs of the system after optimization by robust and deterministic optimization methods.
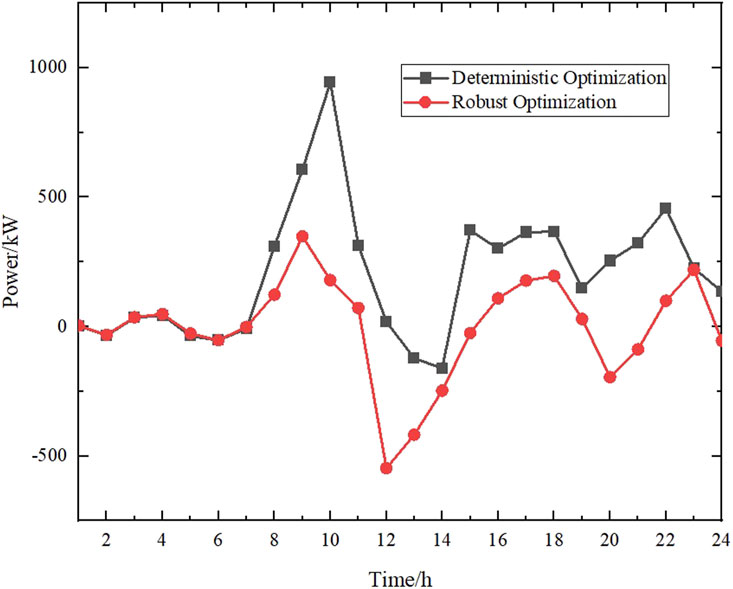
FIGURE 7. Imbalance power generated by real-time power markets.
The time-sharing tariff mechanism between the generation load aggregator and the external grid shown in Figure 7 allows the generation load aggregator to use energy storage to utilize the power purchased in the valley hours in the peak hours under the condition that the energy storage portion of the generation load aggregator needs to meet the constraint (Agrawal, 2022). Based on this premise, the boundary conditions for the use of energy storage for peak shaving by generation load aggregators can be further deduced; in other words, generation load aggregators will use energy storage only under the condition that energy storage can reduce the operating cost of the system. The dispatch cost of energy storage is less than or equal to the difference between the revenue from power sales during peak hours and the cost of power purchases during valley hours (Yang et al., 2020).
where
Equation 41 is the boundary condition for the use of energy storage for peak and valley reduction by generation load aggregators, and its value depends on the relationship between the unit charge and discharge cost of energy storage and the peak and valley tariffs (Talluri et al., 2021). Using the parameters in Table 1 as an example, the generation load aggregator dispatches energy storage boundary conditions as shown in Figure 8A. When the value of
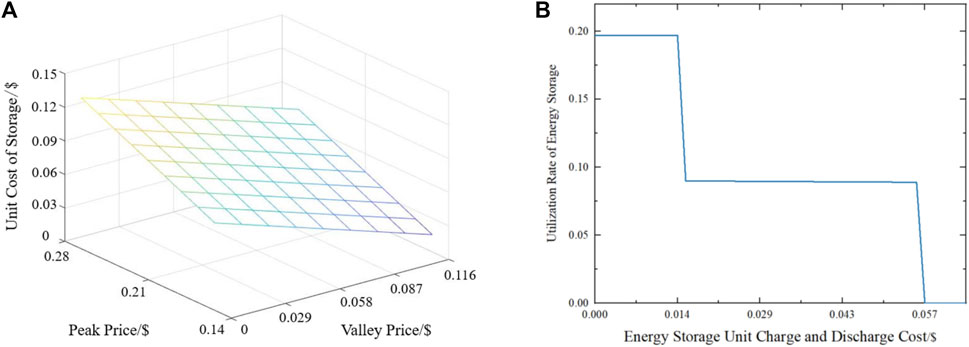
FIGURE 8. (A) Generation load aggregator scheduling energy storage boundary conditions and (B) energy storage utilization.
In the time-sharing tariff mechanism shown in Figure 6, the peak hour tariff is $0.194/(kW⋅h) and the valley hour tariff is $0.069/(kW⋅h), and the boundary condition for energy storage dispatched by the generation load aggregator can be obtained from Eq. 41 as
where
As can be seen in Figure 8B, when the unit charge/discharge cost of energy storage is greater than $0.057/(kW⋅h), the generation load aggregator will no longer charge/discharge energy storage. In other words, in practical application, if the unit charging and discharging cost of energy storage is higher than the boundary condition of energy storage dispatch under the corresponding time-sharing tariff mechanism, energy storage can be installed without other incentive mechanisms.
In this paper, the concept of generation load aggregator is proposed to address the problem that small- and medium-sized regulating customers have fewer ways to participate in the electricity market. A generation load aggregator framework is established that can internally include self-provided generator, energy storage, renewable distributed power, two types of transferable loads, and non-regulated loads. Considering the uncertainty of renewable power sources and loads within the generation load aggregator, this paper establishes a two-stage robust generation load aggregator model to optimize its economic dispatch. To relieve the pressure on the power system from the load side during special hours such as peak and valley and to provide a theoretical basis for future investment and construction planning by generation load aggregator investors and for small- and medium-sized adjustable users to enter the electricity market, the results are analyzed as follows:
(1) The proposed model of generation load aggregator considering uncertainty can be solved by column constraint generation algorithm to obtain the most economical scheduling scheme under the “worst-case” scenario. In this scheme, the generation load aggregator can make full use of self-provided generator, energy storage, and transferable load to reduce the power cost of the system.
(2) A comparison of the results with and without generation load aggregators illustrates the rationality of the generation load aggregator framework by relieving peak and valley pressure on the external grid from the load side, reducing the cost of electricity for loads, and promoting the consumption of renewable energy.
(3) The optimization method used in this paper reduces the operating cost from $5,860 to $5,411 compared to the deterministic optimization method, and the resulting day-ahead scheduling scheme is more robust and resilient to the risk of real-time market price fluctuations. Also, the optimization algorithm used in this paper can adjust the conservativeness of the generation load aggregator optimization scheme by varying the uncertainty regulation parameters to accommodate the use of generation load aggregator operators with different mental risk-taking capabilities. The power generation load aggregators with weak psychological risk-taking ability choose the scheme with high conservative type and the uncertainty regulation parameters are larger.
(4) The scheduling plan for energy storage by the generation load aggregator depends on the relationship between the peak tariff, the valley tariff, and the unit charge/discharge cost of energy storage under the time-sharing tariff mechanism. By analyzing the utilization rate curve of energy storage, the energy storage will no longer be meaningful for generation load aggregators when the unit charge/discharge cost of energy storage is greater than $0.057/(kW⋅h) under the existing tariff conditions. The findings can provide a reference for generation load aggregator investors when planning whether to install energy storage or the scale of energy storage installation and also help the power market management to design reasonable incentive mechanisms.
The original contributions presented in the study are included in the article/supplementary material; further inquiries can be directed to the corresponding author.
HZ: conceptualization, data curation, formal analysis, funding acquisition, investigation, methodology, project administration, resources, software, validation, visualization, writing–original draft, and writing–review and editing. YT: conceptualization, funding acquisition, resources, supervision, validation, and writing–review and editing. YZ: conceptualization, methodology, project administration, and writing–review and editing. QL: formal analysis, validation, visualization, and writing–review and editing. NZ: funding acquisition and writing–review and editing.
The authors declare that financial support was received for the research, authorship, and/or publication of this article. This study was supported by a grant from the National Natural Science Foundation of China-Liaoning Joint Fund (No. 61903264).
The authors declare that the research was conducted in the absence of any commercial or financial relationships that could be construed as a potential conflict of interest.
All claims expressed in this article are solely those of the authors and do not necessarily represent those of their affiliated organizations, or those of the publisher, the editors, and the reviewers. Any product that may be evaluated in this article, or claim that may be made by its manufacturer, is not guaranteed or endorsed by the publisher.
Agrawal, A. (2022). Real Time Market (RTM) at Indian power exchanges: need, short term assessment and opportunities. Energy Policy 162, 112810. doi:10.1016/j.enpol.2022.112810
Alvarez, E. F., Paredes, M., and Rider, M. J. (2020). Semidefinite relaxation and generalised benders decomposition to solve the transmission expansion network and reactive power planning. IET Generation, Transm. Distribution 14, 2160–2168. doi:10.1049/iet-gtd.2019.0331
Alvim, A. C., Ferreira, J. R., and Pereira, R. B. D. (2021). The enhanced normalized normal constraint approach to multi-objective robust optimization in helical milling process of AISI H13 hardened with crossed array. Int. J. Adv. Manuf. Technol. 119, 2763–2784. doi:10.1007/s00170-021-08259-w
Bertsimas, D., Litvinov, E., Sun, X. A., Zhao, J., and Zheng, T. (2013). Adaptive robust optimization for the security constrained unit commitment problem. IEEE Trans. Power Syst. 28, 52–63. doi:10.1109/tpwrs.2012.2205021
China, National Education Association (2013). Technical requirement of power forecasting system for PV power station.
Chen, X., Xu, X., Dai, X., Hu, Q., Quan, X., and Yang, S. (2021). Strategic interaction to reduce customer fatigue in load aggregation. Energy Rep. 7, 339–348. doi:10.1016/j.egyr.2021.08.039
Fanzeres, B., Street, A., and Pozo, D. (2020). A column-and-constraint generation algorithm to find nash equilibrium in pool-based electricity markets. Electr. Power Syst. Res. 189, 106806. doi:10.1016/j.epsr.2020.106806
Hansen, T. M., Roche, R., Suryanarayanan, S., Maciejewski, A. A., and Siegel, H. J. (2015). Heuristic optimization for an aggregator-based resource allocation in the smart grid. IEEE Trans. Smart Grid 6, 1785–1794. doi:10.1109/tsg.2015.2399359
Iria, J., Scott, P., and Attarha, A. (2020). Network-constrained bidding optimization strategy for aggregators of prosumers. Energy 207, 118266. doi:10.1016/j.energy.2020.118266
Jiang, M., Wang, X., Dai, F., Xu, L., Wen, X., and Shen, R. (2021). Operation control strategy of load aggregator based on new energy consumption in power grid. J. Phys. Conf. Ser. 1894 (6pp), 012026. doi:10.1088/1742-6596/1894/1/012026
Karimi, S., and Kwon, S. (2021). Comparative analysis of the impact of energy-aware scheduling, renewable energy generation, and battery energy storage on production scheduling. Int. J. Energy Res. 45, 18981–18998. doi:10.1002/er.6999
Khan, S. U., Mehmood, K. K., Haider, Z. M., Rafique, M. K., Khan, M. O., and Kim, C.-H. (2021). Coordination of multiple electric vehicle aggregators for peak shaving and valley filling in distribution feeders. Energies 14, 352. doi:10.3390/en14020352
Kim, D., Cheon, H., Choi, D. G., and Im, S. (2022). Operations research helps the optimal bidding of virtual power plants. Inf. J. Appl. Anal. 52, 344–362. doi:10.1287/inte.2022.1120
Kim, H. J., Kim, M. K., and Lee, J. W. (2021). A two-stage stochastic p-robust optimal energy trading management in microgrid operation considering uncertainty with hybrid demand response. Int. J. Electr. Power and Energy Syst. 124, 106422. doi:10.1016/j.ijepes.2020.106422
Kumar, T., Kumar, N., Thakur, T., and Nema, S. (2022). Charge scheduling framework with multiaggregator collaboration for direct charging and battery swapping station in a coupled distribution-transportation network. Int. J. Energy Res. 46, 11139–11162. doi:10.1002/er.7915
Lankeshwara, G., Sharma, R., Yan, R., and Saha, T. K. (2022). A hierarchical control scheme for residential air-conditioning loads to provide real-time market services under uncertainties. Energy 250, 123796. doi:10.1016/j.energy.2022.123796
Li, J. (2020). Research on the optimization model of purchase and sale of electricity retailers considering demand response.
Li, S., Zhang, L., Nie, L., and Wang, J. (2022). Trading strategy and benefit optimization of load aggregators in integrated energy systems considering integrated demand response: a hierarchical stackelberg game. Energy 249, 123678. doi:10.1016/j.energy.2022.123678
Li, X., and Wang, D. (2021). Does transfer payments promote low-carbon development of resource-exhausted cities in China? Earth's Future 10. doi:10.1029/2021ef002339
Liu, Y., Guo, L., and Wang, C. (2018). Two-stage robust optimal economic dispatching method for microgrid. Proc. CSEE 14, 4013–4022. doi:10.13334/j.0258-8013.pcsee.170500
Lu, X., Xia, S., Gu, W., Chan, K. W., and Shahidehpour, M. (2021). Two-stage robust distribution system operation by coordinating electric vehicle aggregator charging and load curtailments. Energy 226, 120345. doi:10.1016/j.energy.2021.120345
Najafi, A., Pourakbari-Kasmaei, M., Jasinski, M., Lehtonen, M., and Leonowicz, Z. (2021). A hybrid decentralized stochastic-robust model for optimal coordination of electric vehicle aggregator and energy hub entities. Appl. Energy 304, 117708. doi:10.1016/j.apenergy.2021.117708
Nguyen, D. T., and Le, L. B. (2015). Risk-constrained profit maximization for microgrid aggregators with demand response. IEEE Trans. Smart Grid 6, 135–146. doi:10.1109/tsg.2014.2346024
Pistikopoulos, E. N. (1998). C.A. Floudas, nonlinear and mixed-integer optimization. Fundamentals and applications. J. Glob. Optim. 12, 108–110.
Sambodo, M. T., Yuliana, C. I., Hidayat, S., Novandra, R., Handoyo, F. W., Farandy, A. R., et al. (2022). Breaking barriers to low-carbon development in Indonesia: deployment of renewable energy. Heliyon 8, e09304. doi:10.1016/j.heliyon.2022.e09304
Sheikhahmadi, P., Mafakheri, R., Bahramara, S., Damavandi, M., and CatalãO, J. (2018). Risk-based two-stage stochastic optimization problem of micro-grid operation with renewables and incentive-based demand response programs. Energies 11, 610. doi:10.3390/en11030610
Shi, S., Chen, J., Zhang, Y., and Huang, G. 2020. Optimal operation strategy for micro-energy grid based on the C&CG algorithm. 2020 IEEE 3rd student conference on electrical machines and systems (SCEMS). 04-06 December 2020. Jinan, China. doi:10.1109/SCEMS48876.2020.9352423
Talluri, G., Lozito, G. M., Grasso, F., Iturrino Garcia, C., and Luchetta, A. (2021). Optimal battery energy storage system scheduling within renewable energy communities. Energies 14, 8480. doi:10.3390/en14248480
Vahid-Ghavidel, M., Javadi, M. S., Santos, S. F., Gough, M., Mohammadi-Ivatloo, B., Shafie-Khah, M., et al. (2021). Novel hybrid stochastic-robust optimal trading strategy for a demand response aggregator in the wholesale electricity market. IEEE Trans. Industry Appl. 57, 5488–5498. doi:10.1109/tia.2021.3098500
Vatandoust, B., Ahmadian, A., Golkar, M. A., Elkamel, A., Almansoori, A., and Ghaljehei, M. (2019). Risk-averse optimal bidding of electric vehicles and energy storage aggregator in day-ahead frequency regulation market. IEEE Trans. Power Syst. 34, 2036–2047. doi:10.1109/tpwrs.2018.2888942
Wang, C., Jiao, B., Guo, L., Tian, Z., Niu, J., and Li, S. (2016). Robust scheduling of building energy system under uncertainty. Appl. Energy 167, 366–376. doi:10.1016/j.apenergy.2015.09.070
Wang, C., Zhou, Y., Wu, J., Wang, J., Zhang, Y., and Wang, D. (2015a). Robust-index method for household load scheduling considering uncertainties of customer behavior. IEEE Trans. Smart Grid 6, 1806–1818. doi:10.1109/tsg.2015.2403411
Wang, Q., and Nie, X. (2022). A stochastic programming model for emergency supply planning considering transportation network mitigation and traffic congestion. Socio-Economic Plan. Sci. 79, 101119. doi:10.1016/j.seps.2021.101119
Wang, R., Wang, P., and Xiao, G. (2015b). A robust optimization approach for energy generation scheduling in microgrids. Energy Convers. Manag. 106, 597–607. doi:10.1016/j.enconman.2015.09.066
Wu, H., Wang, J., Lu, J., Ding, M., Wang, L., Hu, B., et al. (2022a). Bilevel load-agent-based distributed coordination decision strategy for aggregators. Energy 240, 122505. doi:10.1016/j.energy.2021.122505
Wu, H., Wang, L., Peng, D., and Liu, B. (2022b). Input–output efficiency model of urban green-energy development from the perspective of a low-carbon economy. Clean. Energy 6, 141–152. doi:10.1093/ce/zkab061
Xu, N., Xu, N., Ling, Y., Liu, Q., Ma, H., Zhou, B., et al. (2020). Electric vehicles charging management based on flexible load aggregation. in Earth and environmental science. Editor T. I. C. SERIES
Xu, Y., Xie, L., and Singh, C. (2010). Optimal scheduling and operation of load aggregator with electric energy storage in power markets. North American Power Symposium (NAPS), Boston, MA, USA, 04-06 August 2011.
Yang, H., Hao, Z., Ma, Y., and Dabo, Z. (2020). An inverse proportion technique based scheduling strategy of energy storage system considering electrical load demand difference. CSEE J. Power Energy Syst.
Keywords: generation load aggregator, two-stage robust optimization, uncertainty optimization, economic dispatch, column constraint generation algorithm
Citation: Zhang H, Tian Y, Zhao Y, Liu Q and Zhang N (2023) Economic dispatch of generation load aggregators based on two-stage robust optimization. Front. Energy Res. 11:1258689. doi: 10.3389/fenrg.2023.1258689
Received: 14 July 2023; Accepted: 14 August 2023;
Published: 31 August 2023.
Edited by:
Jianli Zhou, Xinjiang University, ChinaCopyright © 2023 Zhang, Tian, Zhao, Liu and Zhang. This is an open-access article distributed under the terms of the Creative Commons Attribution License (CC BY). The use, distribution or reproduction in other forums is permitted, provided the original author(s) and the copyright owner(s) are credited and that the original publication in this journal is cited, in accordance with accepted academic practice. No use, distribution or reproduction is permitted which does not comply with these terms.
*Correspondence: Youwen Tian, eW91d2VuX3RpYW4xMEAxNjMuY29t
Disclaimer: All claims expressed in this article are solely those of the authors and do not necessarily represent those of their affiliated organizations, or those of the publisher, the editors and the reviewers. Any product that may be evaluated in this article or claim that may be made by its manufacturer is not guaranteed or endorsed by the publisher.
Research integrity at Frontiers
Learn more about the work of our research integrity team to safeguard the quality of each article we publish.