 Musharrat Chowdhury
 Joseph Gross
 Casey Allen
 Adam Dempsey
- Department of Mechanical Engineering, Marquette University, Milwaukee, WI, United States
Due to the projected decline of demand for gasoline in light duty engines and the advent of ethanol as a green fuel, the use of gasoline/ethanol blend fuels in heavy duty applications are being investigated as they are projected to have lower cost and lower lifecycle green house gas (GHG) emissions. In heavy duty engines, the primary mode of combustion is mixing controlled combustion where wide range of mixture conditions (equivalence ratio) exist. Soot emissions of these fuels in richer conditions are not well understood. The goal of this research is to evaluate some commercially available soot modeling codes for the particulate matter emissions from gasoline/ethanol fuel blends, especially at fuel rich conditions. A Rapid Compression Machine (RCM) is modeled in a three-dimensional numerical simulation using CONVERGE computational software using a reduced chemical kinetic mechanism with SAGE chemistry solver and a RANS k-ϵ turbulence model with a sector model including the creviced piston. The creviced piston is used in the experimental setup to reduce boundary layer effects and to maintain a homogeneous core in the reaction cylinder. Computational fluid dynamics simulations are conducted for different gasoline-ethanol fuel blends from E10 (10% ethanol v/v) to E100. The fuel blend is modeled as a surrogate mixture of toluene, iso-octane, n-heptane for gasoline content, and ethanol. The computational results were validated against experimental results using pressure measurements and laser extinction diagnostics. Different soot models are investigated to evaluate their capability of predicting the sooting tendencies of fuel blends, especially in richer conditions experienced during mixing-controlled combustion. The experimental combustion characteristics such as the ignition delay of different blends of fuel are reasonably well predicted. The Particulate Size Mimic (PSM) model accurately predicts the soot generation characteristics of the different fuels, but the Hiroyasu-NSC model falls short in this regard. For accurate prediction of soot with the PSM model, the thermodynamic conditions during combustion must be accurately modeled. While the current computational modeling tools can produce accurate results for the prediction of particulate matter emissions, there is much work to be done in improving our understanding of the underlying fundamental processes.
1 Introduction
The internal combustion engine (ICE) has been an integral part of human development for over a 150 years with wide applications in personal and commercial transportation on land, air and sea, energy production, agriculture, construction and various other fields. The traditional fossil fuels used in IC engines, like diesel and gasoline, form many harmful pollutants such as Nitrogen Oxides (NOx), unburned hydrocarbons (UHC), carbon monoxide (CO), carbon dioxide (CO2) and particulate matter (PM). According to the Intergovernmental Panel on Climate Change (IPCC) and the United States Environmental Protection Agency (EPA), carbon dioxide alone accounts for nearly 80% of the global greenhouse gas emissions. Use of fossil fuels and industrial processes make up around 85% of the total carbon dioxide emissions (Edenhofer et al., 2014; EPA, 2016). Nitrous oxides account for another 6% of greenhouse gas emissions.
All of these pollutants have major effects on local and global climate as well as human health. In the face of these issues and in the pursuit of higher efficiency and lower emissions, there has been a continuous push to find solutions with lesser environmental effects. According to the Outlook for Energy Report published by ExxonMobil (ExxonMobil, 2022) the heavy duty transportation sector will see massive growth along with other commercial transportation sectors (aviation, marine, and rail) while the energy demand of the light duty will see a decline as illustrated in Figure 1A. The US EPA meanwhile is predicting a rise of biofuel production over that same period of time mostly driven by a large increase in ethanol production (Figure 1B). Combining the outlook from these two figures it can be seen that there likely will be an imbalance in the fuel demand; as light duty demand winds down there is going to a surplus of lighter fuel like gasoline/ethanol blends, while the increase in heavy duty sector can result in a increase of cost in heavy duty fuels like diesel. Using gasoline/ethanol blends can help with this fuel demand imbalance while keeping the cost of operating heavy duty equipment low.
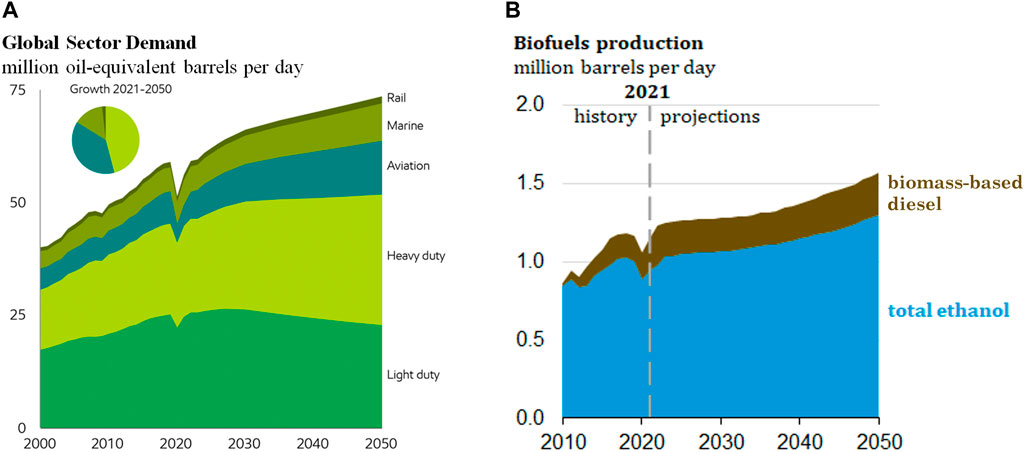
FIGURE 1. Energy outlook to the future. (A) Energy demand by sectors highlighting decline in light duty sector and increase in heavy duty sectors. (B) Projection of biofuel production by the EPA.
In response to climate change as well as depleting petroleum resources, focus has shifted to finding alternative solutions, such as renewable energy sources, electrification of the transportation sector, etc. There has also been an increased focus from combustion researchers and manufacturers on developing advanced combustion strategies improving upon the existing IC engine platform offering reduced emissions and higher efficiency. Many of these strategies also aim at using alternative renewable fuels such as alcohols (ethanol, methanol) or a blend of these fuels with gasoline or diesel which help closing the carbon life cycle and reduce the CO2 and Green House Gas (GHG) emissions (Lee et al., 2021).
These advanced combustion strategies often use some variation of compression ignition due to advantages associated with globally lean operations. Due to the lower reactivity of gasoline/ethanol blend fuels many strategies using ignition assistant devices like glowplugs (Mueller and Musculus, 2001; Zhou et al., 2017), pre-chambers (Dempsey et al., 2022) or even spark plugs (Chiodi et al., 2017; Robertson and Prucka, 2019) are being developed to initiate combustion in a compression-ignition-like manner. In these mixing controlled combustion strategies a wide range of equivalence ratios are present in cylinder. The particulate matter emissions characteristics of alternative light fuels such as gasoline, ethanol, methanol or a blend of these fuels are not well understood at the richer conditions seen within a mixing controlled combustion event. Some research has been done in an attempt to understand the sooting tendencies of pure gasoline or ethanol fuels as well as their blends (Chishty et al., 2018; Ya et al., 2020; Kalvakala et al., 2022; Kempf et al., 2022) in various engine like conditions.
This study aims to understand how gasoline/ethanol blend fuels behave under fuel rich conditions. The two pronged approach uses experiments with an optical rapid compression machine (RCM) and a numerical simulation model for fundamental understanding of soot formation process for these fuels. A rapid compression machine provides a highly repeatable experimental process isolating the fuel chemical kinetics from the inherent complexities associated with engines such as effects turbulence chemistry interactions, cycle to cycle variability, engine breathing, etc. (Sung and Curran, 2014). The homogeneous mixture also removes variables associated with spray modeling, e.g., fuel evaporation, atomization, air entrainment, etc. These qualities make the RCM an ideal candidate for building a CFD model using appropriate chemical kinetics mechanisms and soot models that can accurately capture the sooting tendencies of gasoline-ethanol blend fuels at different conditions starting from fairly low temperature/pressure conditions in the RCM to heavy duty engine like conditions.
2 Experimental setup
An optical Rapid Compression Machine (RCM) was used to study the chemical kinetics and soot formation behaviour of different blends of gasoline ethanol fuels from E10 to E100. The RCM used in the experiments is pneumatically driven via a cam with fixed displacement profile to drive the piston. This process results in a fast compression of charge to a suitable auto-ignition condition. The cam used for the RCM has a constant stroke length of 8. The compression ratio can be varied through the movement of the test cylinder. This provides a fine control over the compression ratio and provides a wide range of testing conditions. Figure 2 shows a dimensional drawing of the RCM highlighting the stroke and compression profile as well as the laser diagnostic setup. The piston of the RCM is a creviced design which helps maintain a homogeneous core after full compression by scooping up the boundary layer during compression (Mittal and Sung, 2006). The creviced piston improves the homogeneity of temperature and pressure of the compressed charge at the core of the cylinder.
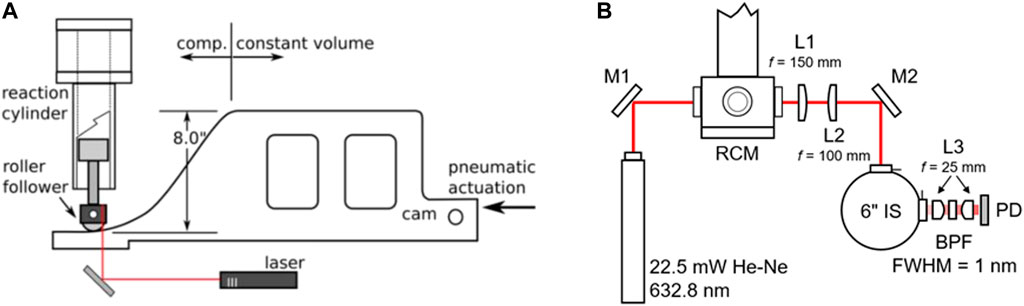
FIGURE 2. Diagram of the RCM experimental setup. (A) Dimensional illustration of the RCM highlighting the stroke and compression profile; (B) Laser extinction diagnostic setup.
In cylinder pressure data is recorded through a Kistler 6045A piezoelectric pressure transducer installed in the head of the RCM. The pressure transducer samples at a rate of 100 kHz. The RCM is fully heated at a steady temperature through a series of heating bands and thermocouples operating under a PID controller. A custom insulation blanket provides insulation and ensures thermal equilibrium throughout the test domain. This well designed heating system ensures that any gas inside the RCM reaches a thermal equilibrium. The initial temperature of the RCM can be varied from 40°C to 120°C.
Soot formation inside the RCM is quantified with a liner-of-sight laser extinction diagnostic setup (Kempf et al., 2022). In this setup, the laser passes through the cylinder via two fused silica windows at opposite sides of the cylinder. The windows are located near the cylinder head to ensure the higher compression ratios would not obstruct the view. The laser used for the setup is a 22.5 mW He-Ne laser (λ = 632.8 mm). Figure 2 shows the path of the laser through the RCM and the associated collection optics.
As the laser passes through the cylinder, it is attenuated due to absorption and scattering by the soot particles, which results in a reduction of the incident intensity which is captured by the photodetector. One concern due to the high temperature and density gradients created in the cylinder is beam steering. Beam steering refers to bending of the laser from the changes in the refractive index of the gas due to high temperature and density gradients. To mitigate any effects of the beam steering, the exiting beam is passed through a pair of plano-convex lenses which focus the beam path to the entrance of the integrating sphere. At the exit of the integrating sphere a narrow band pass filter centered at the laser beam wevelength ensures that no light from other sources (room lighting, soot incandescence, chemiluminescence, etc.) are reaching the photodetector.
Figure 3 shows a sample data trace for an RCM experiment. The soot volume fraction data is averaged over a period of 100 ms, starting 25 ms after ignition. By comparing the laser transmittance before ignition and after ignition a calculation is made to infer the average line-of-sight soot volume fraction that must exist for that level of laser attenuation. For this example trace, the RCM makes around 3 ppm of soot volume fraction. The soot volume fraction is calculated using the following equation:
here, SVF(t) is the soot volume fraction at time t, Io is the laser transmittance before ignition, I is the laser transmittance after ignition, λ is the laser wavelength, L is the path length of the laser and ke is the optical extinction coefficient (Gross et al., 2023). The optical extinction coefficient is based on the findings of Skeen et al. (Skeen et al., 2018).
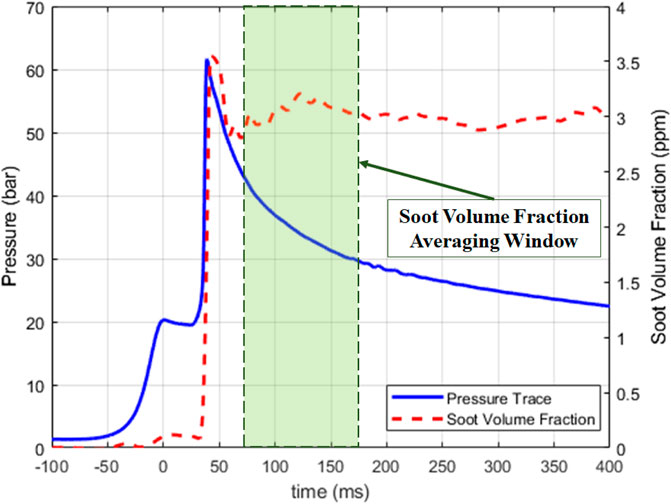
FIGURE 3. Sample data trace for an RCM experiment.
3 CFD model setup
CFD simulations were conducted using an axisymmetric RCM configuration using CONVERGE 3.0. The axisymmetric configuration was chosen due to the considerable reduction in computation time while still retaining the essential details of the system. It was also based on the fact that the RCM is axially symmetric and the combustion process is assumed to be relatively homogeneous. To further reduce resource costs the RCM model was divided into sectors. Two sector geometries as well as the full size model were validated against the experimental data. Figure 4 shows the results of these cases. All three models show very good agreement. The 60° model has the best balance between accuracy of results and resource cost for modeling as it needed less half the time to run as compared to the full size model and 40% less time compared to the 180° model. Thus the 60° sector model was chosen to be used for all future simulations. Figure 4A also shows the CFD model overpredicting the combustion pressure compared to the experimental results, which will be discussed in detail in later sections. Figures 4B, C show the maximum and mean temperatures; the difference between the temperature distribution allude to temperature inhomogeneity in the CFD domain which dictates the combustion development in the RCM which is illustrated in Figure 7 and discussed in a later section.
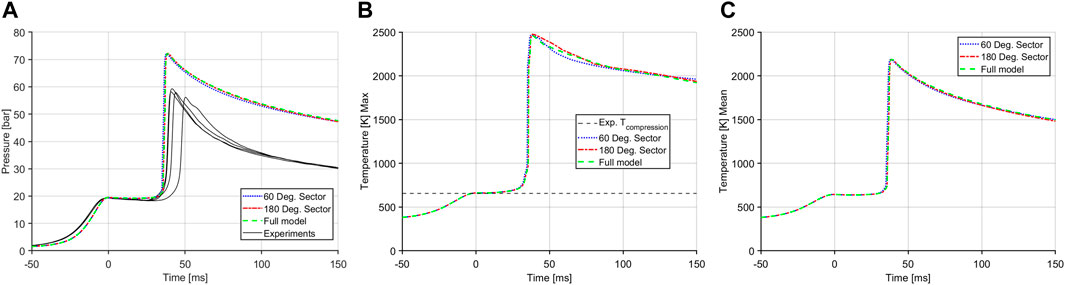
FIGURE 4. Case results with different sector geometries. (A) Main chamber pressure traces. (B) Maximum temperature in the main chamber. (C) Mean temperatures in the main chamber.
3.1 Turbulence model
For this study the Re-Normalization Group (RNG) Reynolds Averaged Navier-Stokes (RANS) k-ϵ model was chosen. Model constants recommended by CONVERGE are used throughout all cases (Richards et al., 2021).
3.2 Combustion and chemistry models
This study uses the SAGE detailed chemical kinetics solver (Senecal et al., 2003) built into CONVERGE to model combustion. Finding an appropriate mechanism to model gasoline-ethanol blend fuels was one of the primary focuses of this study. A reduced kinetic mechanism proposed for numerical analysis of soot formation from gasoline and biofuel blend fuels such as gasoline-ethanol or gasoline-butanol blends under gasoline compression ignition (GCI) conditions developed by Kalvakala et al. (2022) was chosen for this study. This mechanism describes the combustion chemistry of n-heptane, iso-octane, n-butanol, ethanol, and toluene and contains 273 species and 1637 reactions. It also incorporates PAH chemistry up to acepyrene (A4R5) for detailed soot formation calculations. The mechanism was not further simplified.
Another point of focus in simulating a real fuel is the development of the surrogate fuel model. Real fuels such as gasoline or diesel, are a complex mixture of an almost continuous spectrum of hydrocarbons. They are also affected by the source and refining processes which make it tremendously difficult to ascertain the exact molecular composition of a real fuel. Hence a common practice in computational modeling is the use of a surrogate fuel which is a known blend of a finite number of selected species. In the RCM experiments a 85 AKI BOB (Blendstock for Oxygenate Blending) gasoline was splash blended with fuel grade denatured ethanol to create the gasoline-ethanol blend fuels. Different levels of ethanol blends were investigated, widely commercially available E10 and E85, limitedly available E100 and a middle of the road E30 blends were tested in the experiments; the numbers corresponding to the fuel name refer to the volume percentage of ethanol in the fuel blend, e.g., E30 means that by volume there is 30% ethanol in the fuel. Some specifications for the experimental gasoline BOB are detailed in Table 1.
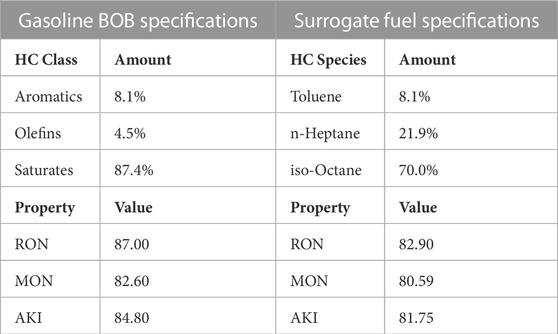
TABLE 1. Fuel species specification for Gasoline BOB fuel used in the experiment and surrogate fuel used in the CFD model.
The surrogate fuel was modeled as a toluene primary reference fuel (TPRF). The fuel grade ethanol was modeled as pure ethanol for the blended gasoline-ethanol fuels. Some properties of the surrogate gasoline fuel used with the Kalvakala mechanism are presented in Table 1. The ratio of n-heptane and iso-octane in the saturate content can be adapted to adjust the experimental ignition delay. The surrogate fuels were generated in a way to have closest matches to the combustion characteristics.
3.3 Mesh
CONVERGE offers fully automated mesh generation which makes it easier to build an appropriate mesh for a given geometry. There are also some user defined mechanisms to optimize and refine the mesh as necessary. In this study two such tools, adaptive mesh refinement and fixed embedding were used to increase the fidelity of the geometric model. The base grid size was fixed at 2 mm for all the cases. An example of the mesh alongside the various refinements are illustrated in Figure 5.
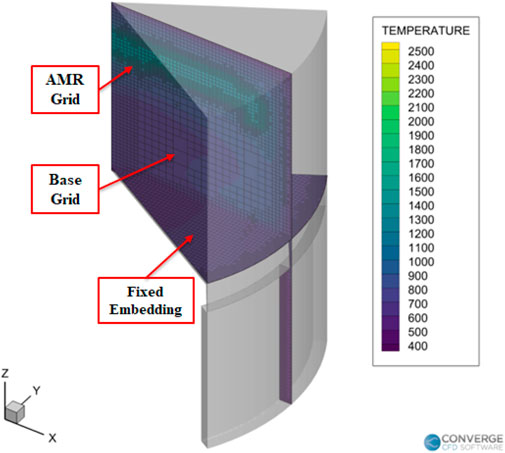
FIGURE 5. RCM simulation mesh.
In this study, Adaptive Mesh Refinement (AMR) was done based on temperature and velocity gradients. Fixed embedding mesh refinements were also used to increase the mesh resolution in specific areas of interest in the simulation domain. The mesh setting schemes are detailed in Table 2.
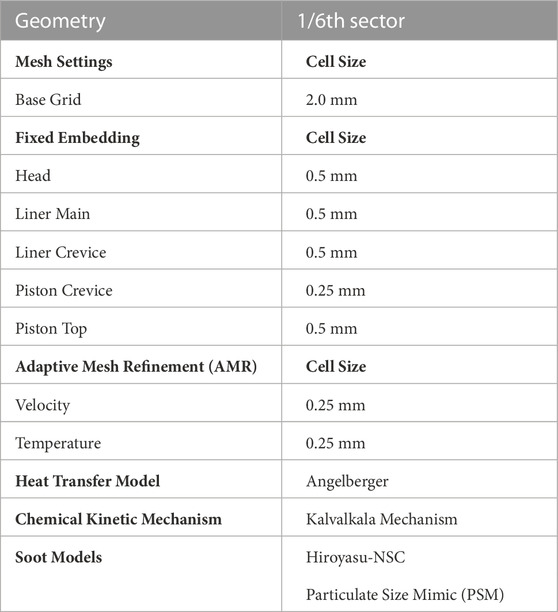
TABLE 2. Settings for final CFD model.
3.4 Emissions model
CONVERGE has several different models for calculations of NOx and particulate matters or soot emissions. Other emissions species of interest such as CO, CO2, unburned hydrocarbons, etc. are calculated through the combustion models, given that these species exist in the mechanism. In this project the primary interest for emissions is on soot for different gasoline-ethanol blend fuels and as such no other emissions calculations are presented. Details about NOx modeling or other species can be found in the CONVERGE 3.0 manual (Richards et al., 2021).
3.5 Soot models
There are multiple options in CONVERGE for modeling soot starting from simple empirical models to more complex models that model the physical phenomenon of soot formation, growth and oxidation along with the interaction between soot and gas-phase chemistry. In this work, to frame the current state of soot modeling capabilities available the two bookend models available in CONVERGE were used. The simplest available model is the Hiroyasu-NSC soot model and the most detailed model Particulate Size Mimic. There are also phenomenological models available in CONVERGE but no such models were evaluated in this study.
3.5.1 Hiroyasu-NSC model
The simplest soot model available in CONVERGE 3.0 is the Hiroyasu-NSC two step model, the only empirical soot model available. The Hiroyasu empirical model is coupled with the Nagle and Strickland-Constable Model (Nagle and Strickland-Constable, 1962) to simulate soot oxidation. This model basically consists of two competing processes, soot formation and soot oxidation. This model does not interact with the combustion chemistry model, and is thus considered a passive model. It also does not consider soot surface growth processes or particle coagulation.
According to Hiroyasu and Kadota (Hiroyasu and Kadota, 1976) the rate of soot generation (Ms) in a computational cell is calculated from the difference between the soot formation (Msf) and soot oxidation (Mso) rates.
The formation rate can be expressed as a pressure-dependent Arrhenius expression as follows
here Asf is the Arrhenius pre-exponential factor, Mform is the mass of the soot formation species predicted by the combustion chemistry, p is the local cell pressure, Esf is the activation energy, R is the ideal gas constant, and T is the local cell temperature.
The soot formation species has two options that can be defined by the user, the first option uses the total hydrocarbon mass from the fuel vapor as the soot formation species mass. The second option only uses acetylene (C2H2) as the soot formation species. Using this option requires the use of a detailed chemistry solver like the SAGE detailed chemical kinetics solver used in this study. This study uses acetylene as the soot formation species as previous research has shown that acetylene is an important soot precursor species (Tree and Svensson, 2007). Additionally with the use of detailed kinetics, fuel vapor is rapidly transformed into intermidiate hydrocarbon species (Kong et al., 2005).
With this model in CONVERGE, soot oxidation is modeled using the Nagle and Strickland-Constable model. This model considers carbon oxidation through two mechanisms dependent on surface chemistry at two sites, the more reactive A site, and the less reactive B site. The total rate of soot oxidation is given as:
Here, Aso is a scaling factor for soot oxidation, MWc is the molecular weight of carbon in g/mol, ρs is soot density in g/cm3 and Ds is the soot particle diameter with units of μm. The soot density, ρs is set to 2 g/cm3 and the soot diameter, Ds was set at 0.25 μm for this study following the prescribed settings in CONVERGE.
Rox is the total soot oxidation rate given by,
Where X is the proportion of A sites as given by
In the above equations,
3.5.2 Particulate Size Mimic model
The Particulate Size Mimic (PSM) is the most advanced soot model implemented in CONVERGE 3.0. This model was developed based on the discrete sectional method (Kumar and Ramkrishna, 1996; Wen et al., 2005). This model provides the particle size distribution function (PSDF) of each cell in addition to the detailed soot information such as cell averaged soot number density and mass. The PSM model divides the particles into bins, called sections in CONVERGE, containing particles of similar volume. The first bin is populated through nucleation of soot particles. The particles can then move from one bin to another depending on the changing size of the particles through surface growth, condensation, coagulation, oxidation or fragmentation. The boundaries of each section is given by:
For increased computational efficiency, the maximum boundary is extended using the a nonlinear formulation (Netzell, 2006) given by:
Here vMIN is the minimum volume defined by the soot precursor, which can be specified by the user. The maximum soot volume, vMAX is preset by CONVERGE as the biggest soot particles with an approximate diameter of 100 nm. The maximum volume of the biggest soot particle can also be specified by the user. vC2 is the volume of two carbon atoms in soot calculated to be 7.176e4 nm3.
Given the distribution function qi(v) for each section, the total volume fraction Qi is:
Following Equation (9) soot formation in each section in the PSM model is calculated by the following equation where
Here,
CONVERGE uses the Hydrogen Abstraction Acetylene Addition Ring Closure (HACARC) (Mauß, 1998). The surface reactions rates for surface growth and oxidation are
Here θ is the fractional dimension of soot and k is the reaction rate coefficient specified in Marchal (Marchal, 2008) and α is the fraction of soot surface site utilized for these surface reactions ranging from 0 to 1. For the PSM model, this factor is defined based on the size of the soot particle. Soot sizes from precursor species up to 40 nm size are binned with the first factor and particles bigger than 40 nm are binned at the second alpha correction factor. CONVERGE also allows the α correction factors to automatically calculated based on local conditions.
The PSM model also allows defining custom soot precursors as the exact set of species that will be used as a precursor for soot inception and growth. For this study, the biggest PAH (polycyclic aromatic hydrocarbon) available with the Kalvakala mechanism, Cyclopenta-Pyrene (A4R5) was chosen to be the soot precursor. CONVERGE calculates the rate of soot inception as (Smoluchowski, 2010; Richards et al., 2021):
Here, vPAH is the volume of the PAH species, βfm,pi is the collision coefficient and NPAH is the number density of the PAH species. With a higher number of soot precursor species, more PAHs participate in the inception reaction and affect the subsequent soot formation stages increasing the overall soot yield.
4 Results and discussion
4.1 Model development
The computational model was compared to the experimental data by comparing the pressure trace data and the ignition delays of the different fuels at different equivalence ratios. Figure 6 shows an example data trace from a CFD model for E30 fuel at an equivalence ratio of 1.5. The CFD model closely follows the compression process of the RCM. It also does a good job of capturing heat transfer losses post compression, but before ignition. The ignition delay is also well predicted as the pressure rise rates take off at the same time as the experiments. This plot shows several replicates taken at this condition to illustrate the repeatability of the RCM experiments. One thing where the CFD model does fall a little short is predicting the peak combustion pressure; the peak pressure is slightly higher than the experiments. This discrepancy was investigated in detail in trying to improve the model prediction. Existing research does show that RCM CFD models have had trouble with overpredicting the peak combustion pressure as shown by Gholamisheeri et al. (Gholamisheeri et al., 2017).
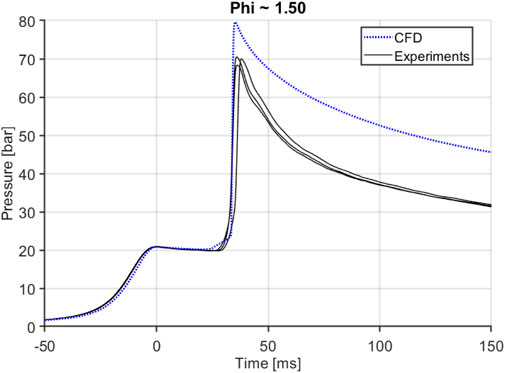
FIGURE 6. Example data trace from the CFD Model.
Based on the fact that the CFD model overpredicts the pressure, it can be assumed that the model overpredicts the temperature as well. The source of the higher peak pressure was investigated through both computational and experimental methods. The pressure transducer used in the experimental setup was calibrated and no discrepancy was found. The RCM was also thoroughly checked for leaks; there is no indication of any leaks during the ignition delay period, but the results were inconclusive as to the exact reason of the model over predicting pressure at ignition. It is suspected that heat transfer losses are not being represented accurately in the CFD model due to the fast pace of combustion in the RCM as well as ringing due to the nature of the combustion process as ringing and HCCI like combustion can increase the heat flux (Grandin and Denbratt, 2002; Tsurushima et al., 2002). Several different heat transfer models available in CONVERGE were tested in the CFD model as illustrated on the Supplementary Figure S3. The Angelberger (Angelberger et al., 1997) heat transfer model was chosen to be used through the study. The effects, if any, of different kinetic mechanisms were also evaluated; all tested mechanisms showed the overprediction of pressure in the CFD model shown in Supplementary Figures S1, S2.
A grid resolution study was done to evaluate the effect of the grid; discussed in the Supplementary Material. It was found that although the grid resolution had some effect on the peak pressure and ignition delay, the soot formation converges with grid resolution finer than a base grid of 2 mm. With the focus of the work being on the formation of soot for ethanol/gasoline blend fuels, base grid size of 2 mm was chosen as a good balance between accuracy and resource cost.
The ignition process was also looked at closely to see the development of the combustion in-cylinder. Figure 7 illustrates the combustion process inside the RCM at various time steps after reaching Top Dead Center (TDC). The initial combustion starts at the upper portion of the cylinder and then progresses to the outer periphery before engulfing the center. This step-by-step combustion process inside the RCM is supported by existing literature (Clarkson et al., 2001; Walton et al., 2007; Guibert et al., 2010). As the piston is compressed a cold plug of gas is pushed into the center which creates a temperature stratification at the core of cylinder which affects the reaction speed. This results in the combustion developing in a toroidal manner as seen in the CFD model. The model also shows combustion in the near wall region which might not be the case in the experiments which could also influence the overprediction of pressure in the CFD model.
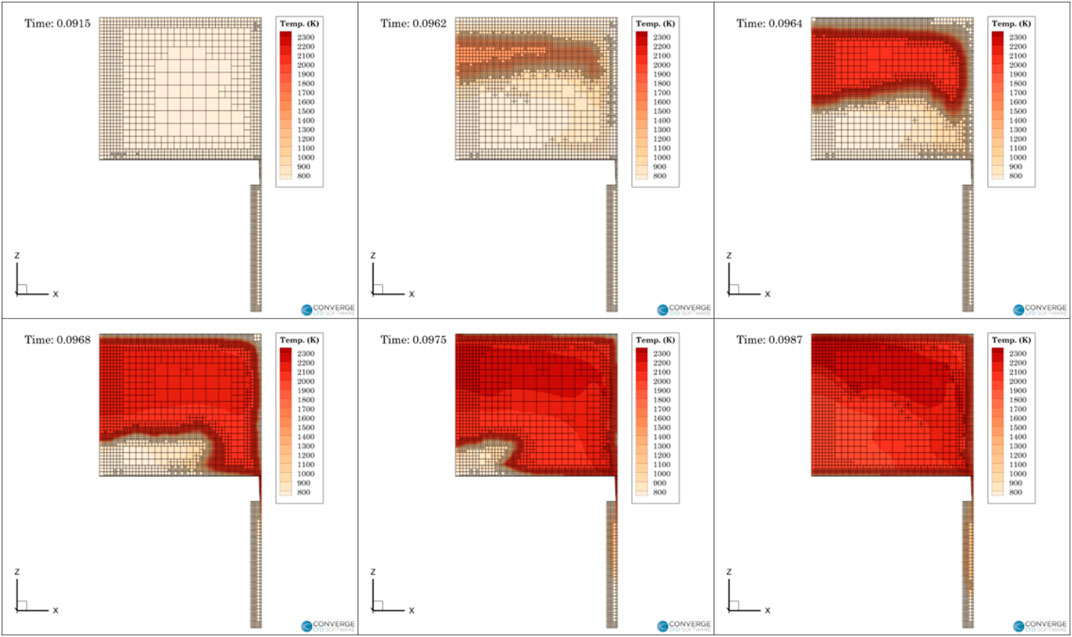
FIGURE 7. Progression of combustion in the RCM CFD model after reaching TDC.
As soot is heavily dependent on temperatures (Kitamura et al., 2002) it was of importance to investigate the effect of higher pressures and temperatures on the RCM soot yields. On that pursuit, a novel approach was taken by modifying the mechanism to include an aborbent species molecule. This molecule works as the inert component of the oxidizer (i.e., N2 in air) under the threshold temperature prescribed by the user. Once this threshold temperature is reached, the specific heat capacity and thus the heat absrobance of the molecule is increased which soaks the heat generated by the combustion and brings the temperature and pressure down. The use of absorbent molecule is a simple method to perturb the in-cylinder conditions, especially the temperature, during the combustion process. Perturbation of the peak combustion temperature and pressure enables us to understand the affect of these factors on the soot modeling techniques. Figure 8 shows some of the case results from a sweep of absorbent molecule percentage in the oxidizer for the E30 fuel at the equivalence ratio of 2.0. As the amount of absorbent molecule is increased the peak pressure and temperature inside the main chamber of RCM is decreased.
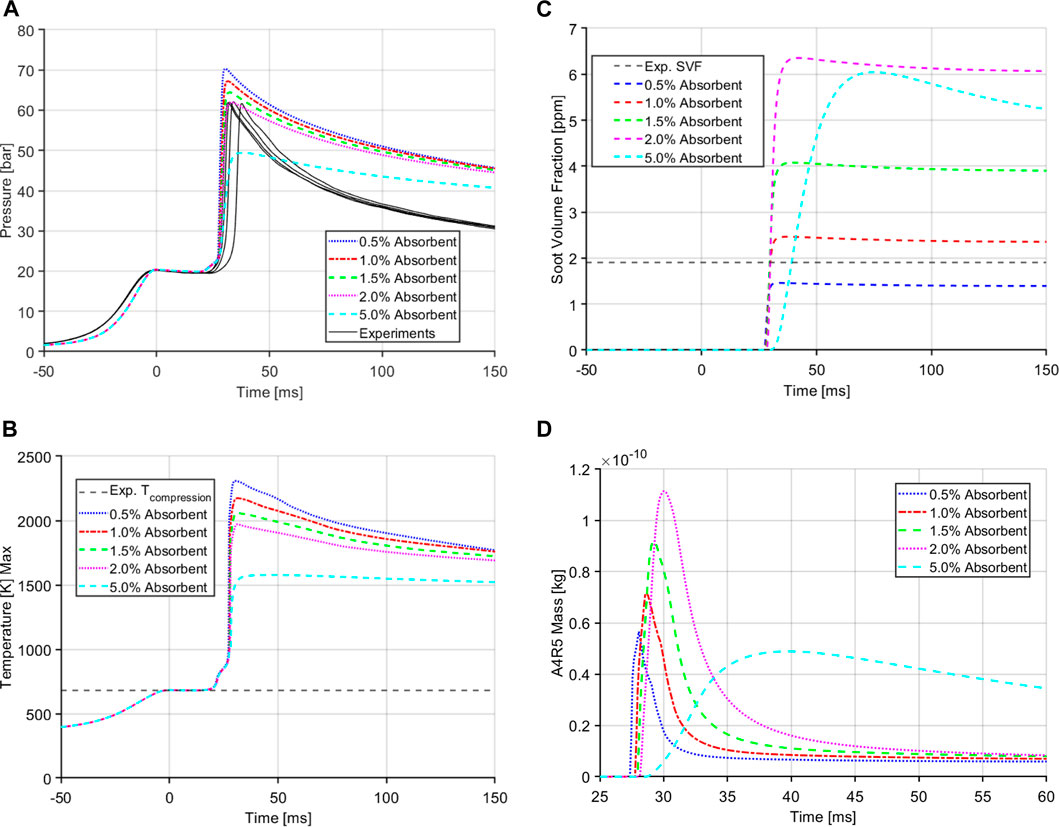
FIGURE 8. Case results with different amounts of absorbent molecule for E30 at ϕ = 2.0. (A) Main chamber pressure traces. (B) Maximum temperature in the main chamber. (C) Soot volume fraction. (D) A4R5 mass.
The soot yield, illustrated in 8c, shows an opposite trend where with increasing amount of absorbent molecule and lower temperatures, the soot yield is increased but only up to a certain point, if the temperature is decreased too much, the soot yield also drops. This temperature dependence of soot follows the results found by Kitamura et al. (2002) where soot is not just dependent on the equivalence ratio of the fuel but also the combustion temperatures. The absorbent molecule also does not affect the pressure or temperature decay characteristics of the CFD model. The soot yield reaches a quasi steady state after combustion which is also seen with the experimental results. Soot is formed right after ignition as the soot precursor species, A4R5 is formed (Figure 8D) and converted to soot but since these cases are run at fuel rich conditions, there is no excess oxygen to oxidize the soot post ignition. The soot yield follows a similar trend as the precursor species. With decreasing temperature the amount of A4R5 yield is increased generating more soot. With the use of the absorbent species, the CFD can match the peak pressure from the experiment. Also of note, the A4R5 is consumed very fast in the soot formations processes and gives the RCM the characteristic quasi-steady soot generation.
A closer look at the individual soot generation processes is shown in Figure 9. The left axis denote the total soot mass yield and the right axis shows the process rates. For both cases the soot inception and condensation are the dominant processes for soot formation in the RCM. The fuel rich environment of the RCM inhibits soot oxidation; other soot process such as soot growth, fragmentation, and coagulation are also nearly zero. The soot inception and condensation processes also change depending on the amount of absorbent molecule; with lower amounts of absorbent (Figure 9A) there is a sharp rise in soot inception and condensation coincident with ignition and A4R5 formation. As the A4R5 is consumed, the soot mass generated through these processes also reach a steady state in absence of any oxidation. A similar trend can be observed in Figure 9B with the higher amount of absorbent molecule where the soot processes of inception follow a slower rise of A4R5 formation.
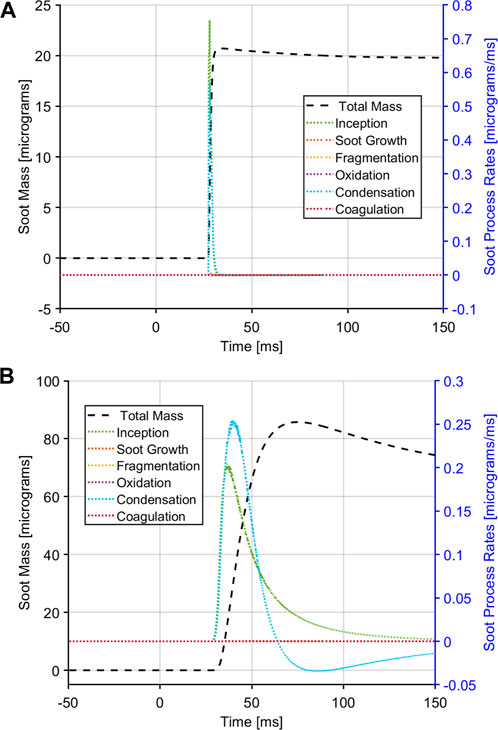
FIGURE 9. Soot processes in the PSM model for E30 fuel at a equivalence ratio of 2.0, illustrating the total soot mass as well as the individual processes. (A) soot processes for a case with 0.5% absorbent molecule. (B) soot processes for a case with 5.0% absorbent molecule.
4.2 Soot yield results
Based on the findings of the previous section an absorbent percentage of 1.5% was selected to model the four different gasoline-ethanol blend fuels, starting from E10 (10% v/v) to E100. The CFD simulation mimics the process in the experiments where it averages the soot volume fraction for a period of 100 ms, starting 25 ms after ignition. This process provides an average soot volume fraction number for each equivalence ratio. The detailed settings of the CFD model used are illustrated in Table 2.
It is important to note that this work focues on readily available soot models as the first step in understanding the fundamental soot formation characteristics of gasoline/ethanol fuel blends. Further investigation of chemical mechanism pathways as well as improvements of the heat transfer in the CFD model is in the pathway of future research.
The fuels were tested at various equivalence ratio range starting from stoichiometric to richer conditions. The experiments were limited by the laser diagnostics to optically thick conditions, richer conditions where laser transmittance dropped to zero and no further meaningful data could be taken. Since the CFD is not limited by this, richer cases than the experimental optical thick conditions were run to extend the soot formation curve. Table 3 details the conditions used for all the different fuels for experiments and CFD simulations. To maintain similar ignition delay times, the compressed temperatures had to be increased with the increase in ethanol content in the fuel. Note, with increasing amount of ethanol in the fuel the rich limit in experiments were extended, showing that increasing amounts of ethanol in the fuel blend correspond with decreasing levels of soot formation.
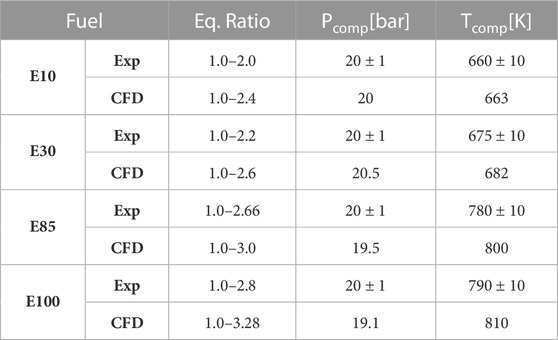
TABLE 3. Test conditions for different fuels in experiment and simulation.
The soot volume fraction for the different fuel blends at varying equivalence ratios are presented in Figure 10 compared to experimental results from Gross et al. (2023); Gross et al. (2023). Results from the two soot models, Hiroyasu-NSC and PSM, both using the absorbent molecule, are illustrated. For a fair comparison to the experimental results, the soot volume fraction results from the CFD were averaged for a duration of 100 ms, starting 25 ms post ignition, hence every single data point represents an equivalence ratio (phi)—soot volume fraction pairing. For all fuel blends the Hiroyasu model falls short in predicting the soot yield, especially at higher equivalence ratios. The PSM model, on the other hand, performs quite well in this regard. It captures the trend of soot formation of the four different fuel blends accurately. It should also be noted that at the higher soot yield conditions, the experiments themselves have a higher level of uncertainty as denoted with the error bars.
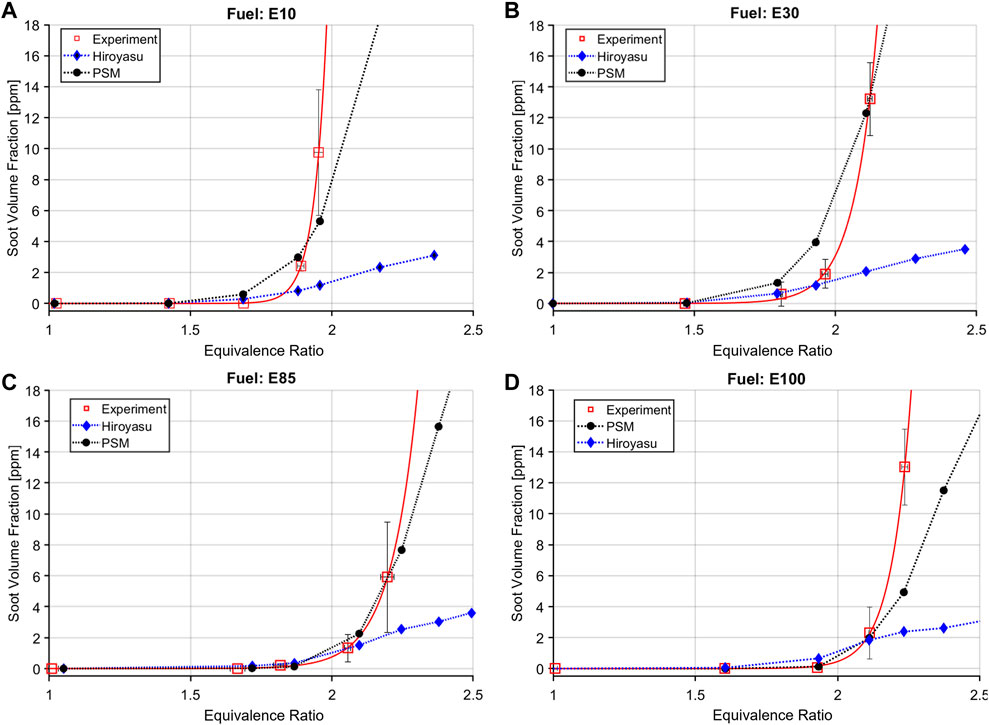
FIGURE 10. Soot formation for various gasoline-ethanol fuel blends with PSM and Hiroyasu soot models compared to experimental results. (A) E10 fuel. (B) E30 fuel. (C) E85 fuel. (D) E100 fuel.
One key consideration about these results are the importance of getting the thermodynamic conditions correct at ignition and through the combustion process. To highlight the soot models sensitivity to temperature and equivalence ratio, “single-cell” CFD simulations were conducted. Here, a single CFD cell is simulated at constant volume. A homogeneous fuel-air mixture is initialized in the cell, and the well-stirred reactor chemistry and soot model are solved simultaneously forward in time, predicting the ignition, combustion, and soot formation processes. A wide variety of initial temperature and equivalences are evaluated. The soot yield is documented 2 ms after ignition. This results in a characteristic contour plot for a given fuel and soot model—known as the soot island. The strong temperature dependence of soot formation are clearly illustrated in Figure 11. At any given equivalence ratio soot yield can be drastically different depending on the burned gas temperature. It is also interesting to note that with the lower ethanol content E10 fuel Figure 11A, the soot map is distributed more widely compared to E100 Figure 11B. The overall soot yield is also much lower with the higher ethanol content fuel which is also seen in the full scale CFD models. For the full CFD models the absorbent molecule helps perturb the in-cylinder temperature and show a similar effect of temperature on the soot formation. In the experiments, the soot yield is also quite sensitive to compressed pressure for both E10 and E100 fuels as shown in Figure 12. The PSM model does a good job of showing the pressure sensitivity of soot formation especially with the E10 case whereas the Hiroyasu model falls shorts. As the compressed pressure is increased, soot yield also increases linearly for both fuels shown. If the pressure and temperature are not predicted accurately the soot yield will also be inaccurate as it will place the burned gases at the wrong location on the soot island.
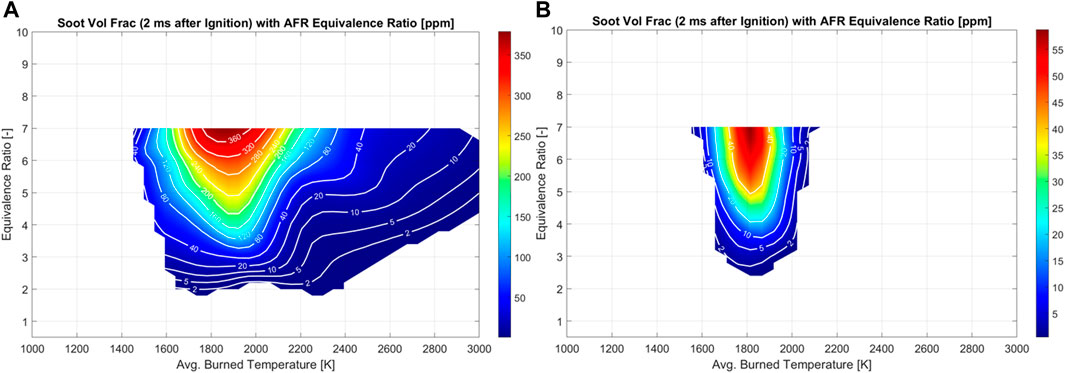
FIGURE 11. Soot formation map based on equivalence ratio and combustion temperature. (A) E10 soot formation map. (B) E100 soot formation map.
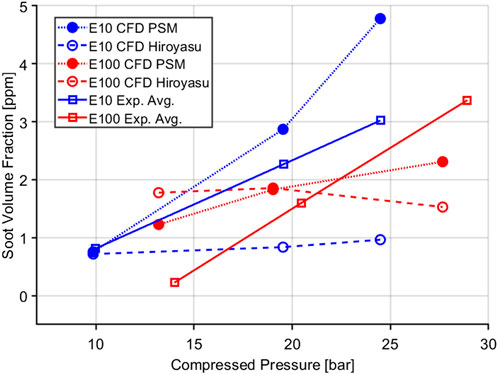
FIGURE 12. Pressure sensitivity of E10 and E100 fuels for RCM experiments and CFD simulations showing both the PSM and Hiroyasu model.
The two different soot models with the different fuel blends illustrate the current capabilities of three dimensional CFD models in predicting soot. It is also of note from Figure 10 that with the increase of ethanol content in the fuel, the soot vs. equivalence ratio curve progressively shifts to the right indicating that with higher ethanol content, the fuels are less likely to soot at a specific equivalence ratio.
5 Conclusion
Several different soot models available in commercial CFD solver CONVERGE 3.0 with publicly available chemical kinetics models were evaluated for the CFD models capabilities in predicting the sooting tendencies of gasoline-ethanol blend fuels. The model was found to be adequate at predicting the combustion characteristics of real fuel but overpredicted the peak combustion pressure. With pressure correction using a absorbent species the soot formation was well predicted across all the fuel blends and equivalence ratios. There is still a lot of progress to be made to in modeling soot formation, especially for these lighter fuels. The models performed well qualitatively in terms of capturing the general trend of soot formation for gasoline-ethanol blend fuels at richer conditions. Two key behavioural characteristics of gasoline-ethanol fuel blends that have been observed in both the experiment and the computational model is that at a certain equivalence ratio the fuels start making exponentially more soot; and soot yield dependency on ethanol percentage in fuel, more ethanol in the fuel blend yields less soot under the tested conditions.
Future work will continue to investigate these soot models with tuning of the chemical mechanisms themselves to bring the fuel reactivity of ethanol more in line with experimental results as well as to improve the fidelity in predicting the formation of PAH species. The peak pressure discrepancy between the experiments and the CFD model will also be further investigated, both numerically and experimentally. To further validate the CFD model, experimental temperature measurements through water absorption spectroscopy is being worked on. A possible upgrade to the RCM, an optical head will enable us to image the combustion process more closely and can be another source of validation of the combustion models of the CFD. It can also shed more light on the assumption of an homogeneous soot cloud formation post ignition.
The natural progression of this research will also see development of engine CFD model with soot prediction capabilities and engine experiments with gasoline-ethanol blend fuels under mixing controlled combustion. This will test the capabilities of the CFD model in the complex environment inside an engine as well as further develop knowledge of the sooting tendencies of lighter fuels in heavy duty engines and advanced combustion strategies.
Data availability statement
The raw data supporting the conclusion of this article will be made available by the authors, without undue reservation.
Author contributions
MC: Formal Analysis, Investigation, Software, Visualization, Writing–original draft. JG: Investigation, Software. CA: Supervision, Writing–review and editing. AD: Supervision, Writing–review and editing.
Funding
The authors declare financial support was received for the research, authorship, and/or publication of this article. This material is based upon work funded by the U.S. Department of Energy’s Office or Energy Efficiency and Renewable Energy (DOE-EERE) under award number DE-0009872.
Acknowledgments
The authors would like to acknowledge Convergent Science Inc. for granting academic licenses for CONVERGE CFD and Tecplot. A special thanks to the Marquette University HPC Team for maintaining the cluster computing system used for this work.
Conflict of interest
The authors declare that the research was conducted in the absence of any commercial or financial relationships that could be construed as a potential conflict of interest.
Publisher’s note
All claims expressed in this article are solely those of the authors and do not necessarily represent those of their affiliated organizations, or those of the publisher, the editors and the reviewers. Any product that may be evaluated in this article, or claim that may be made by its manufacturer, is not guaranteed or endorsed by the publisher.
Supplementary material
The Supplementary Material for this article can be found online at: https://www.frontiersin.org/articles/10.3389/fenrg.2023.1258304/full#supplementary-material
References
Angelberger, C., Poinsot, T., and Delhay, B. (1997). Improving near-wall combustion and wall heat transfer modeling in SI engine computations. 972881. doi:10.4271/972881
Chiodi, M., Kaechele, A., Bargende, M., Wichelhaus, D., and Poetsch, C. (2017). Development of an innovative combustion process: spark-assisted compression ignition. SAE Int. J. Engines 10, 2486–2499. doi:10.4271/2017-24-0147
Chishty, M. A., Bolla, M., Hawkes, E. R., Pei, Y., and Kook, S. (2018). Soot formation modelling for n-dodecane sprays using the transported PDF model. Combust. Flame 192, 101–119. Publisher: Elsevier Inc. doi:10.1016/j.combustflame.2018.01.028
Clarkson, J., Griffiths, J., MacNamara, J., and Whitaker, B. (2001). Temperature fields during the development of combustion in a rapid compression machine. Combust. Flame 125, 1162–1175. doi:10.1016/S0010-2180(01)00236-X
Dempsey, A., Chowdhury, M., Kokjohn, S., and Zeman, J. (2022). Prechamber enabled mixing controlled combustion - a fuel agnostic Technology for future low carbon heavy-duty engines. SAE Tech. Pap. 2022-01-0449. doi:10.4271/2022-01-0449
Edenhofer, O., Pichs-Madruga, R., Sokona, Y., Farahani, E., Kadner, S., Seyboth, K., et al. (2014). Climate change 2014: Mitigation of climate change: Working Group III contribution to the fifth assessment Report of the intergovernmental Panel on climate change.
Gholamisheeri, M., Thelen, B., and Toulson, E. (2017). CFD modeling and experimental analysis of a homogeneously charged turbulent jet ignition system in a rapid compression machine. SAE Tech. Pap. (SAE Int. 2017. Issue: March ISSN: 01487191. doi:10.4271/2017-01-0557
Grandin, B., and Denbratt, I. (2002). The effect of knock on heat transfer in SI engines. 2002–01–0238. doi:10.4271/2002-01-0238
Gross, J., Chowdhury, M., Dempsey, A., and Allen, C. (2023a). Soot Formation and ignition characteristics of ethanol/gasoline blends in a rapid compression machine. Detroit, Michigan, United States. 2023–01–0385. doi:10.4271/2023-01-0385
Gross, J. R., Dempsey, A. B., Kempf, J. R., and Allen, C. M. (2023b). Experimental measurements of soot formation in fuel-rich homogeneous mixtures using an optical rapid compression machine. Int. J. Engine Res. 24, 3197–3213. 146808742211444. doi:10.1177/14680874221144483
Guibert, P., Keromnes, A., and Legros, G. (2010). An experimental investigation of the turbulence effect on the combustion propagation in a rapid compression machine. Flow. Turbul. Combust. 84, 79–95. doi:10.1007/s10494-009-9225-z
Hiroyasu, H., and Kadota, T. (1976). Models for combustion and formation of nitric oxide and soot in direct injection diesel engines. 760129. doi:10.4271/760129
Kalvakala, K. C., Pal, P., Gonzalez, J. P., Kolodziej, C. P., Seong, H. J., Kukkadapu, G., et al. (2022). Numerical analysis of soot emissions from gasoline-ethanol and gasoline-butanol blends under gasoline compression ignition conditions. Fuel 319, 123740. Publisher: Elsevier Ltd. doi:10.1016/j.fuel.2022.123740
Kempf, J., Dempsey, A., and Allen, C. (2022). Autoignition and sooting characteristics of iso -octane and ethanol in an optical rapid compression machine. 2022–01–0419. doi:10.4271/2022-01-0419
Kitamura, T., Ito, T., Senda, J., and Fujimoto, H. (2002). Mechanism of smokeless diesel combustion with oxygenated fuels based on the dependence of the equivalence ration and temperature on soot particle formation. Int. J. Engine Res. 3, 223–248. doi:10.1243/146808702762230923
Kong, S.-C., Sun, Y., and Reitz, R. D. (2005). Modeling diesel spray flame lift-off, sooting tendency and NOx emissions using detailed chemistry with phenomenological soot model. ASME 2005 Intern. Combust. Engine Div. Spring Tech. Conf. (ASMEDC), 149–157. doi:10.1115/ICES2005-1009
Kumar, S., and Ramkrishna, D. (1996). On the solution of population balance equations by discretization—II. A moving pivot technique. Chem. Eng. Sci. 51, 1333–1342. doi:10.1016/0009-2509(95)00355-X
Lee, U., Kwon, H., Wu, M., and Wang, M. (2021). Retrospective analysis of the U.S. Corn ethanol industry for 2005 – 2019: implications for greenhouse gas emission reductions. Biofuels, Bioprod. Biorefining 15, 1318–1331. doi:10.1002/bbb.2225
Marchal, C. (2008). Modélisation de la formation et de l’oxydation des suies dans un moteur automobile. Theses, Univ. d’Orléans.
Mauß, F. (1998). Entwicklung eines kinetischen Modells der Rußbildung mit schneller Polymerisation (Göttingen: Cuvillier), 1. aufl edn.
Mittal, G., and Sung, C.-J. (2006). Aerodynamics inside a rapid compression machine. Combust. Flame 145, 160–180. doi:10.1016/j.combustflame.2005.10.019
Mueller, C. J., and Musculus, M. P. (2001). Glow plug assisted ignition and combustion of methanol in an optical DI diesel engine. 2001–01–2004. doi:10.4271/2001-01-2004
Nagle, J., and Strickland-Constable, R. (1962). Oxidation of carbon between 1000–2000°C. Proc. Fifth Conf. Carbon 154, 154–164. doi:10.1016/B978-0-08-009707-7.50026-1
Netzell, K. (2006). Development and applications of detailed kinetic models for the soot particle size distribution function. thesis/doccomp. Lund University.
Robertson, D., and Prucka, R. (2019). A review of spark-assisted compression ignition (SACI) research in the context of realizing production control strategies. 2019–24–0027. doi:10.4271/2019-24-0027
Senecal, P. K., Pomraning, E., Richards, K. J., Briggs, T. E., Choi, C. Y., Mcdavid, R. M., et al. (2003). Multi-dimensional modeling of direct-injection diesel spray liquid length and flame lift-off length using CFD and parallel detailed chemistry. doi:10.4271/2003-01-1043
Skeen, S., Yasutomi, K., Cenker, E., Adamson, B., Hansen, N., and Pickett, L. (2018). Standardized optical constants for soot quantification in high-pressure sprays. SAE Int. J. Engines 11, 805–816. doi:10.4271/2018-01-0233
Smoluchowski, M. v. (2010). Versuch einer mathematischen Theorie der Koagulationskinetik kolloider Lösungen. Z. fuer Phys. Chem. <Leipzig> 92, 129–168. doi:10.1515/zpch-1918-9209
Sung, C. J., and Curran, H. J. (2014). Using rapid compression machines for chemical kinetics studies. Prog. Energy Combust. Sci. 44, 1–18. Publisher: Elsevier Ltd. doi:10.1016/j.pecs.2014.04.001
Tree, D. R., and Svensson, K. I. (2007). Soot processes in compression ignition engines. Prog. Energy Combust. Sci. 33, 272–309. doi:10.1016/j.pecs.2006.03.002
Tsurushima, T., Kunishima, E., Asaumi, Y., Aoyagi, Y., and Enomoto, Y. (2002). The effect of knock on heat loss in homogeneous charge compression ignition engines. 2002–01–0108. doi:10.4271/2002-01-0108
Walton, S., He, X., Zigler, B., Wooldridge, M., and Atreya, A. (2007). An experimental investigation of iso-octane ignition phenomena. Combust. Flame 150, 246–262. doi:10.1016/j.combustflame.2006.07.016
Wen, J. Z., Thomson, M., Park, S., Rogak, S., and Lightstone, M. (2005). Study of soot growth in a plug flow reactor using a moving sectional model. Proc. Combust. Inst. 30, 1477–1484. doi:10.1016/j.proci.2004.08.178
Ya, Y., Nie, X., Peng, L., Xiang, L., Hu, J., Dong, W., et al. (2020). Effects of ethanol blending on the formation of soot in n-heptane/air coflow diffusion flame. J. Chem. 2020, 1, 10. doi:10.1155/2020/8403940Publisher: Hindawi Limited
Keywords: particulate emissions, computational modeling, soot modeling, rapid compression machine, renewable fuels
Citation: Chowdhury M, Gross J, Allen C and Dempsey A (2023) Simulation of a rapid compression machine for evaluation of ignition chemistry and soot formation using gasoline/ethanol blends. Front. Energy Res. 11:1258304. doi: 10.3389/fenrg.2023.1258304
Received: 13 July 2023; Accepted: 22 September 2023;
Published: 18 October 2023.
Edited by:
Xiongbo Duan, Central South University, ChinaReviewed by:
Huaiyu Wang, Beijing Institute of Technology, ChinaTianfang Xie, Purdue University, United States
Chong Li, QPS, LLC, United States
Copyright © 2023 Chowdhury, Gross, Allen and Dempsey. This is an open-access article distributed under the terms of the Creative Commons Attribution License (CC BY). The use, distribution or reproduction in other forums is permitted, provided the original author(s) and the copyright owner(s) are credited and that the original publication in this journal is cited, in accordance with accepted academic practice. No use, distribution or reproduction is permitted which does not comply with these terms.
*Correspondence: Musharrat Chowdhury, bXVzaGFycmF0LmNob3dkaHVyeUBtYXJxdWV0dGUuZWR1