 Jia Lu
 Yaxin Liu
- Hubei Key Laboratory of Intelligent Yangtze and Hydroelectric Science, China Yangtze Power Co. Ltd., Yichang Hubei, China
Cascade hydropower producers face two stages of risk when participating in medium and long-term market transactions: transaction risk during the bidding stage; and the operational risk during the scheduling and operation stage due to the uncertainty of runoff and market-clearing prices. Therefore, how to measure the above risks and make corresponding decisions has become an urgent problem for producers.This paper combines the real market structure and rules of a certain hydropower dominated market in Southwest China, and establishes a mid-term operation and trading decision-making method based on the Joint Information Gap Decision Theory (IGDT) and Prospect Theory. To address the main uncertainty variables that producers face in participating in transactions, this paper obtains the maximum fluctuation range of variables that satisfy the expected revenue in a robust model based on IGDT. Then, using Prospect Theory, a bidding strategy model that takes into account the psychological factors of producers is constructed within this range.To solve the nonlinear programming problem and address the accuracy issues caused by curve fitting during the solution process, a nonlinear programming combined with an improved stepwise optimization hybrid algorithm is employed.Using actual data from a hydropower grid in southwest China participating in the market as an example. The results indicate that the method provides the fluctuation range of runoff and market prices under different expected return targets, and can formulate reasonable bidding decisions and operation plans based on producers different risk preferences within this range.
1 Introduction
As the new round of power market reform gradually enters deep water area, China’s provinces and cities have established well-regulated and well-structured medium- and long-term power markets (Cheng et al., 2018; Liu et al., 2019; Yao et al., 2020).Because medium- and long-term transactions have relatively low risks and stable returns, they have become a “ballast stone” for market participants to avoid risks (Li et al., 2022). At the same time, they also plays a role in anchoring the spot market prices. For cascade hydropower producers, the medium and long-term market can effectively mitigate operational risks caused by hydrological uncertainty, especially for long-term operation and transaction plans with large errors. Hydropower producers can adjust long-term plans and make trading strategies through mid-term optimization scheduling based on more accurate forecasting results. However, when participating in monthly medium- and long-term markets, there will inevitably be errors in the predicted values of runoff and prices which may lead to insufficient generation output, failure to fulfill contracts, or high bidding prices that result in failed clearing. Therefore, how to formulate corresponding operation plans and bidding strategies has become an urgent practical demand for cascade hydropower producers.
In the market, the traditional dispatching method has been significantly impacted as well (Li et al., 2012). Unlike other power generation, when participating in the market, hydropower producers needs to consider not only the transaction risks caused by market structure, rules, and bidding strategies, but also the operation risks caused by uneven and uncertain distribution of runoff. In addition, when participating in the market every month, producers usually take two approaches to pursue higher profits: increasing power generation and bidding higher prices. However, there are inevitable errors in their predicted runoff and prices, which may lead to insufficient generation output that cannot be fulfilled or high bidding prices that result in failed clearing. Therefore, when participating in mid-to-long-term trading, producers face a two-stage risk that needs to be considered: 1) transactional risk in the mid-to-long-term market bidding stage; and 2) operational risk in the mid-term dispatch stage due to the uncertainty of market-clearing electricity prices and the randomness of daily runoff. How to jointly consider the above risks and make reasonable decisions in the corresponding stages has become the main practical and theoretical challenge currently faced by hydropower producers in China.
At present, there has been some research on the above issues. In response to the risk decision-making issue during the bidding stage, a methodology to design an optimal bidding strategy for a generator according to his or her degree of risk aversion is established (Rodriguez and Anders, 2004).Based on the coordinated interaction between units output and market clearing prices, the benefit/risk/emission comprehensive generation optimization model with objectives of maximal profit and minimal bidding risk and emissions is established (Peng et al., 2012).The uncertainty model of market price is considered based on the concept of weighted average squared error using a variance–covariance matrix. IGDT is used to develop the bidding strategy of a generation company (Za et al., 2013). Introducing evolutionary game theory into the bidding strategy of thermal power units, a thermal power peak shaving bidding model based on the bidding mechanism of the auxiliary service market of Northeast China Power Grid was established (Lu et al., 2021).A robust optimization approach is proposed to obtain the optimal bidding strategy of retailer, which should be submitted to pool market (Nojavan et al., 2015a).A hybrid approach based on IGDT and modified particle swarm optimization (MPSO) is used to develop the optimal bidding strategy (Nojavan et al., 2015b).Proposes a bilevel stochastic optimization model to obtain the optimal bidding strategy for a strategic wind power producer in the short-term market (Dai and Qiao, 2015).
However, from the perspective of usage scenarios, current research still has some shortcomings, mainly manifested in the following three aspects: 1) Most research focuses on thermal and wind power, which is not applicable to risk decision-making problems for cascaded hydropower stations with close water-electricity connections. 2) When using scenario analysis to handle uncertainty, a sufficient number of scenarios are usually required to make the description more accurate and comprehensive, which can lead to low solution efficiency and overly conservative results. 3) Current research mostly considers decision-making risks in the bidding stage or performance risks in the operational stage separately, while in practical use, these two types of risks need to be coupled together. 4) Most studies use solvers to improve computational efficiency, but this approach requires fitting some curves, resulting in a decrease in computational accuracy.
In order to solve the above problems, this paper introduces the power market structure and rules of a certain hydropower dominated market in Southwest China. The trading varieties in this market are divided into three time categories: annual, monthly, and daily. The annual trading is bilateral, and the monthly trading is carried out in the order of bilateral, matchmaking, and listing. Considering the risks in the bidding stage and the dispatching operation stage, a method for cascade hydropower producers is proposed by combining the IGDT and prospect theory. Firstly, considering the risk in the medium-term operation stage, the IGDT is used in conjunction with a robust optimization model to solve for the maximum deviation range of runoff and clearing prices from the predicted values when satisfying the producer’s predetermined revenue. Then, considering the trading decision risks in market bidding stage based on the fluctuation range of uncertain variables, the prospect theory is used to analyze and study the bidding strategy of producer’s in the market from the perspective of limited rationality and establish a corresponding bidding decision model. Considering the precision problem caused by curve fitting due to the use of optimization solvers for solving nonlinear programming problems, this paper chooses to use a nonlinear programming and improved stepwise optimization hybrid algorithm to solve the problem. Finally, a cascade hydropower station is used as an example to verify that the method provided in this paper provides the fluctuation range of runoff and clearing prices under different expected revenue targets, and develops reasonable bidding decision-making and operation plans based on different risk tolerance levels within this range.
2 Introduction to prospect theory
Prospect theory (Tversky, 1979; Amos Tversky and Kahneman, 2016) is a method that takes into account the subjective feelings of decision-makers, where they exhibit risk aversion when facing gains and risk-seeking behavior when facing losses, and are more sensitive to losses than gains. In practice, decision-makers face a highly complex and dynamic electricity market, and the many uncertainties and risks associated with it make it difficult for decision-makers to meet the assumption of a “perfectly rational person". This means that their information is limited, and their predictions of the market are always subject to some level of error. In addition, limited insight into the essence of the problem makes it difficult for decision-makers to maintain consistent risk preferences, highlighting the characteristic of changing risk preferences. Therefore, in contrast to assuming decision-makers are perfectly rational using the mean-variance or value-at-risk/conditional value-at-risk methods, prospect theory assumes that decision-makers are boundedly rational, meaning their information is limited and risk preferences can change with different objective factors, and typically uses prospect value as a basis for decision-making. Prospect value is determined by both the value function and decision weights, and the calculation formula is as follows:
Where V represents prospect value; k represents a certain event and K represents all possible events; (prok) is the probability weight function; v (xk) is the value function; prok is the probability of event k occurring; and xk is the index value of event k. In prospect theory, the decision-making process of a decision-maker is influenced by two subjective factors: their subjective value perception of the benefits obtained from the decision and their subjective perception of the probability of achieving those benefits.
The value function is a subjective representation of value formed by the decision-maker, and commonly used forms of the value function include the following:
Where the parameters a and b represent the concavity and convexity of the power functions for gains and losses, respectively, reflecting the decision-maker’s sensitivity to gains and losses. Generally, a and b are greater than 1. The parameter λ reflects the decision-maker’s aversion to losses, and is generally greater than 1.
The probability weight function represents the decision-maker’s subjective judgment of the probability p of an event occurring, and commonly used forms of the probability weight function include the following:
Where (prok)+ and (prok)- represent the probability weight functions when the decision-maker perceives gains and losses, respectively. θ is the coefficient of the attitude towards risk for gains, and σ is the coefficient of the attitude towards risk for losses.
3 The risk decision model based on the joint information gap decision theory and prospect theory
When market participants evaluate a decision as a gain or a loss, they usually consider the change in wealth rather than the total wealth. The carrier of subjective value is the change in wealth, not the final state of wealth. Therefore, when evaluating market risks for a cascaded hydropower producer, expected gains must be set in advance. Next, different bidding decisions and operating plans are evaluated based on the electricity sales revenue. Finally, the optimal decision is chosen based on the decision-maker’s attitude towards risk.
3.1 Medium and long term market income model of cascade hydropower producers
The market share of each power producer studied in this paper is relatively small, and their bidding method has no impact on the transaction results, indicating that they can be considered price takers. Transactions in the market are settled according to pay-as-bid (PAB), which is a payment based on the offer (Federico and Rahman, 2001; Kahn et al., 2001). When participating in market, corresponding application decisions and operation plans will be formulated based on the predicted runoff and the clearing price. As the decision-makers of cascade hydropower stations are limited rational price takers who cannot obtain unbiased estimates of uncertain variables. Therefore, the bidding based on the predicted clearing price may lead to excessively high bids due to prediction error, which will eventually lead to bidding failure. In this case, the settlement is based on the on grid price. At the same time, due to the strong volatility of natural runoff, there are often errors in the prediction results, resulting in the transaction contracts in the medium-term dispatching operation stage can not be completed or overfulfilled, so it is necessary to consider the assessment of the default part. Therefore, the revenue for a hydropower producer is shown as follows:
Where B1,i and e1,i represent the medium- and long-term market revenue and settlement electricity quantity, respectively, for station i; p1 is the settlement electricity price for the mid-to-long-term market. B2,i and e2,i represent the excess power generation revenue and excess electricity quantity, respectively, for station i when the bid is successful; p2 is the settlement electricity price for excess electricity quantity. B3,i and e3,i represent the default loss and default power quantity, respectively, ei is the power generation of station i; p3 is the default electricity price used for assessment.
3.2 Medium term optimal operation model of cascade hydropower producers
3.2.1 Objective function of optimal scheduling in operation stage
Considering that the generation cost of cascaded hydropower stations mainly consists of fixed costs and does not affect model optimization, this paper will ignore it. With a monthly scheduling cycle and 1 day as a time period, the optimization goal for a producer in the market is to maximize total revenue, as shown in the following formula.
Where, B0 refers to the total revenue of the producer; N is the number of cascaded hydropower stations. B+ and B− correspond to the total revenue of the producer when overcompleted and in contract breach, respectively. β is a binary variable where β = 1 represents overgeneration and β = 0 represents an uncompleted contract.
According to formulas (5) to (10), the generation revenue of a producer mainly depends on the total electricity generation of the current month. This is calculated as follows:
Where: ei is the total power generation of station i for the period j; T is the total number of time periods; Qi,j, Hi,j, Zi,j, Zdi,j, and Hdi,j represent the average power generation, average discharge, water head, decision-making reservoir water level, downstream tail water level, and head loss of station i on the jth day, respectively; ηi is the output coefficient of station i; and Δtj is the time step length.
3.2.2 Objective function
To avoid repetition, this article follows the conventional hydro constraints of the hydropower station as shown in reference (Lu et al., 2021). This paper only demonstrates the relevant market-based power constraints, which are shown below:
Where M is a sufficiently large constant.
3.3 Robust optimization modeling and solution based on IGDT
3.3.1 Objective function
To mitigate the impacts of uncertain runoff and prices during the bidding and operation stages of cascaded hydropower producers, this paper adopts the IGDT (Wright, 2004) robust model for modeling. The model calculates the maximum deviation range between the predicted values of runoff and clearing prices for the mid-term operation stage to achieve expected revenue. To avoid repetition with Section 3.2, only unique content is presented below:
Where ‾α represents the maximum fluctuation range of runoff and prices compared to the predicted values. In order to better describe the basic idea of IGDT and its applicability in solving the problem at hand, it is assumed that the predicted errors for both prices and runoff are the same. B* represents the optimal selling revenue of the producers in the robust model, while Bc represents the expected selling revenue. σ represents the risk tolerance level, which is the degree of deviation between the expected revenue target Bc and the actual revenue B0.‾ pi represents the predicted values of various prices, while ‾qi,j represents the predicted values of runoff. α represents the fluctuation range of runoff and prices compared to the predicted values.
3.3.2 Model solving method
According to the established model, the goal of the lower layer of the model is to calculate the market revenue of the producers based on the maximum revenue model when the uncertain variable fluctuates within [1-α,1+α]. The goal of the upper layer of the model is to solve for the maximum deviation range of the uncertain variable α and obtain the corresponding power bidding strategy e1,i when the market revenue meets the model’s predetermined target. This paper analyzes the market participation goals of the producers and performs an equivalent transformation on the two-layer model constructed according to literature (Moradi-Dalvand et al., 2015). The transformation steps and solving process are outlined in literature (Li et al., 2021). In order to use the Lingo or Gurobi solver to solve the problem of maximum monthly power generation, literature (Li et al., 2021) performed corresponding fitting on the relationship curves between the storage capacity-water level and the runoff rate-downstream water level of the cascade reservoir. However, since these curves are not smooth and regular, the curve fitting inevitably led to calculation results that deviate from the actual operating conditions.
In order to solve the calculation error problem caused by fitting, this article adopts a nonlinear programming and improved stepwise optimization hybrid algorithm for solution. Firstly, the initial scheduling process of a cascade hydropower station, which satisfies the constraints related to water level, flow rate, and reservoir capacity, is obtained using nonlinear optimization. And then, building upon the initial scheduling process, a stepwise optimization algorithm is employed, which converts the multi-stage optimization problem into several two-stage optimization subproblems. In each successive two-stage optimization subproblem, a combination set is formed by drawing random values for the variable values of each power station within their respective ranges. The combination that yields the optimal objective function value is then used to replace the original variable values. And last, this process is repeated sequentially for all subproblems, completing one iteration. The process is iterated iteratively until the termination condition is met, resulting in the maximum power generation of the cascade hydropower producer for the current month under operational constraints.
The objective function of the two-stage optimization subproblem is defined as:
Where E’ is the objective function value of the subproblem. γi,1, γi,2,γi,3 and γi,4 are the penalty coefficients for station i violating the minimum discharge constraint, maximum discharge constraint, discharge ramp constraint, and minimum power output constraint, respectively.
When generating the water level combination set, if there is no reserved storage capacity constraint for the cascade hydropower stations, the water level combination is generated by randomly selecting n mutually exclusive random numbers within each power station’s water level range. The Cartesian product is then used to generate the cascade hydropower station’s water level combination set. If there is a reserved storage capacity constraint for the cascade hydropower stations, the water level combination set is composed of combinations that satisfy the storage capacity constraint.
The specific implementation method is as follows:
①Sort the power stations in
②For each power station
③For each reservoir storage level
④Similarly, until the Kth power station is reached, there will be nK combinations of reservoir storage levels. Based on the relationship between reservoir storage and water level, the combinations of reservoir storage levels are converted to combinations of water levels.
⑤For the N-K power stations without reservoir capacity constraints, randomly select n different water level combinations from their respective water level ranges and use the Cartesian product with the water level combination set in step ④ to generate the water level combination set for the cascaded hydropower stations.
The problem-solving process is shown in Figure 1.
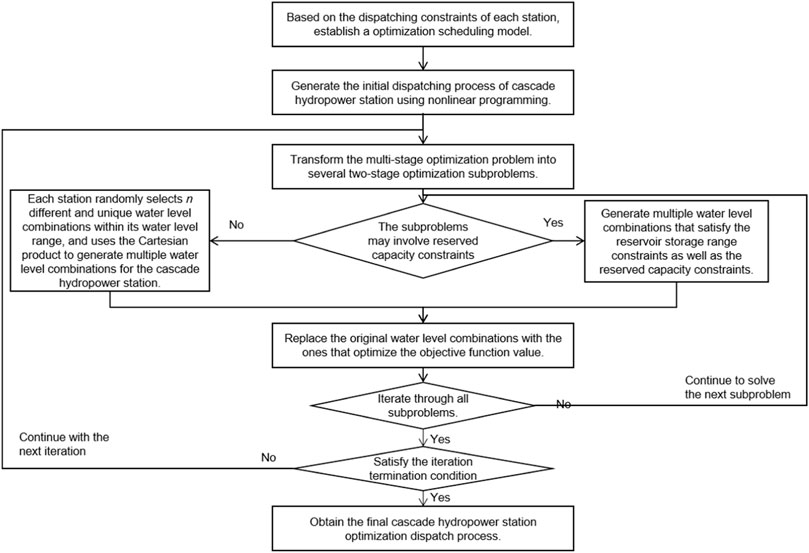
FIGURE 1. Flow chart of the model solution.
3.4 Decision making model of mid long term market bidding based on prospect theory
3.4.1 Modeling
The Prospect theory suggests that a decision-maker’s decision depends on the difference between the outcome and the expected value, rather than the outcome itself, based on different reference points. Based on this fundamental idea, Bc = (1-σ)*B0 in 3.3 is used as the expected revenue during the bidding phase. Therefore, the psychological perception revenue deviation ΔB between the revenue of selling electricity from cascade hydropower producers and Bc is:
where B (xk) is the revenue function of producers for proposal k during the bidding phase, considering both successful and failed bidding scenarios; p4 is the on-grid electricity price of power station i, which is set to a uniform value for convenience of calculation in this paper.
The value function reflects the subjective value perception of the decision-maker of the producers towards the revenue deviation ΔB. When the electricity sales revenue exceeds its expected revenue, that is, ΔB>0, according to the characteristics of the value function, the decision-maker is psychologically “gain-oriented” and tends to avoid risks. Conversely, they have risk-seeking characteristics. Therefore, combined with formulas 25 and 26, the value function is modified as follows:
where v (xk)s is the value function when scheme k is successfully declared, and v (xk)d is the value function when scheme k is unsuccessfully declared.
As the market adopts the PAB settlement method in this paper, the higher the bidding prices of decision-makers for the producers, the greater the revenue obtained when the bid is successfully submitted. However, at the same time, the higher the bidding prices, the greater the risk of bid failure faced by them. Therefore, when bidding, decision-makers need to fully consider the risk of their decision-making programs and modify formulas 3 and 4 based on the successful bidding probability, as shown below:
where ω(prok)s is the probability weight for scheme k when it is successfully cleared, and ω(prok)d is the probability weight for scheme k when it is unsuccessfully cleared; pmax and pmin are the maximum and minimum predicted clearing prices, respectively; pk is the bidding price for the kth scheme; F (pmax), F (pmin) and F(p) represent the probabilities corresponding to pmax, pmin and pk under a certain distribution, respectively; F (pmax)- F (pk) and F (pk)- F (pmin) represent the probabilities of successful and failed bidding, respectively.
Based on the analysis of the value function and probability weight function for producers during successful and failed bidding as described above, the bidding decision-making model is as follows:
where Vk is the comprehensive prospect value under the kth proposal; v (xk)s and v (xk)d are the value functions for the kth scheme when the bid is successful and unsuccessful, respectively.
3.4.2 Model solving method
The calculation process of the bidding decision-making model for the producers in the market based on prospect theory during the bidding stage is shown in Supplementary Appendix Figure A1. According to the objective function in Section 3.4.1, the optimization process is as follows:
①Using the expected revenue Bc obtained in Section 3.3 and the range of market clearing prices and daily discharge changes from [1-α,1+α] that satisfy the expected revenue as the reference point and the range of bidding prices for the prospect theory model.
②Select a representative daily flow process and use the maximum power output model to calculate the power output of the cascade hydropower station. Then, starting from pk = pmin, increase the bidding price by a fixed step, and calculate the revenue of the cascade hydropower station under various bidding decisions according to formulas (25) to (26).
③Calculate the value function v (xk)s and v (xk)d for each scheme when the bid is successful and unsuccessful based on the predetermined revenue Bc and formulas (27) and (28). Then, using formulas (29) and (30), calculate the probability weights ω(prok)s and ω(prok)d for each proposal when the bid is successful and unsuccessful. Finally, obtain the prospect value Vk for each scheme.
④Calculate the prospect value Vk for all scheme, and find the scheme with the maximum Vk. This scheme is the optimal bidding strategy for the producers.
4 Example analysis
The research background and examples of this paper are shown in reference (Li et al., 2021). Based on actual operation data, the historical average is used as the predicted value. The predicted market clearing price is 0.2553 yuan/kWh, the excess completion price is 0.19358 yuan/kWh, and the default assessment price is 0.2734 yuan/kWh. The on-grid price of 0.2 yuan/kWh is a constant. The basic information of each power station and the predicted storage level are shown in Appendices A1-A2. For the uncertainty of runoff, this paper only considers the leading hydropower station A. The interval runoff of downstream stations with weak regulation performance is calculated using the multi-year average runoff value. The reason is that the generation of cascade hydropower stations in the dry season is mainly affected by the generation flow of upstream leading station which is not at the same level as that of the interval runoff.
4.1 Accuracy verification of solving algorithm
When the inflow forecast deviation α = At 0.151, the calculation results of the two algorithms are shown in Figure 2. The results of the hybrid algorithm are 14.417 billion kW hours, and the results of the solver are 14.325 billion kW hours.From the operation process of the cascade hydropower stations, the hybrid solution algorithm has a smoother process, and there are significant fluctuations in the output of the b and c stations in the solver’s calculation results. Overall, the results of the hybrid algorithm are better than those of the solver.To verify the improvement in solving accuracy of the nonlinear programming and improved stepwise optimization hybrid algorithm used in this article.The generation results of the two algorithms are rechecked based on the method of controlling the water level process, and then the operating water level process is rechecked based on the method of controlling the outflow flow. If the difference between the recheck results and the original calculation results is smaller, it indicates that the corresponding algorithm has higher solution accuracy.According to the method of controlling water level, the review result of the hybrid algorithm is 14.42 billion kW hours, and the review result of the solver is 13.52 billion kW hours. From the results of the generation review, the calculation accuracy of the hybrid algorithm is higher. Due to the linear function of the water balance equation of the reservoir, it is only necessary to convert the water level into water volume in advance to perform linear calculations in the solution. Therefore, there is no deviation in the results of both algorithms when rechecking the water level process using the method of controlling the outflow. Overall, the hybrid algorithm has higher solving accuracy.
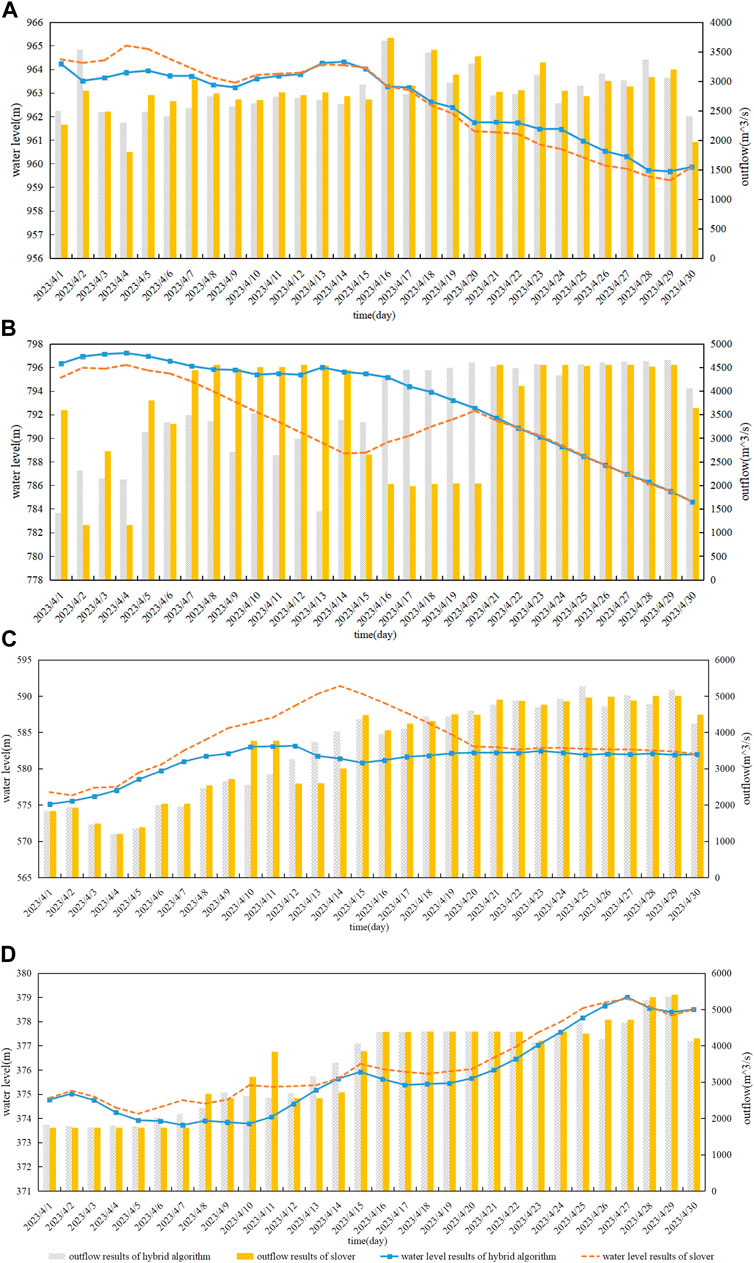
FIGURE 2. Display of calculation results of two algorithms. (A) Operating Process of Station A, (B) Operating Process of Station B, (C) Operating Process of Station C, (D) Operating Process of Station D.
4.2 Risk analysis of cascade hydropower stations in operation stage
Based on the research in reference (Li et al., 2021), the predicted clearing price and runoff are substituted into the maximum revenue model to solve the problem of maximizing the revenue of producers participating in markets. The revenue B0 at this time is 3349.02 million yuan. The model established in this paper assumes that the actual runoff and clearing price in the future will fluctuate around the predicted values, with a fluctuation range of α. According to the different expected revenue targets or risk tolerance σ of producers, the curve of robust model objective ‾α(Bc) varying with risk tolerance or preference degree σ can be obtained, as shown in Figure 3. The calculation results are shown in Supplementary Appendix Table A3. The robust region refers to the maximum fluctuation range of price and runoff that satisfies the robust solution when the minimum expected revenue is met.
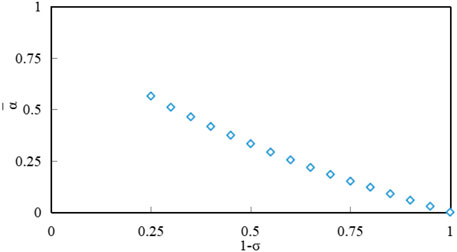
FIGURE 3. Variation curve of the robust region with the risk tolerance factor 1-σ.
As can be seen from the model proposed in this paper, with the increase of the risk tolerance of producers, the maximum fluctuation range of uncertain variables also increases. That is, when the expected revenue is lower, the greater the fluctuation range of runoff and market price, the better the robustness of the power distribution strategy obtained, which is more resistant to larger runoff fluctuations. It is worth noting that no feasible solution can be obtained when σ< 0.25. Analysis of the reasons shows that the end water level of station C is 581.98 m, which is higher than the initial water level of 575.27 m. However, σ< 0.25 represents that the actual forecast inflow is significantly lower than the predicted value. In the current situation of low inflow, it is impossible to meet the initial and final water level requirements of station C.
After obtaining the maximum fluctuation range of clearing price and runoff, in order to facilitate producers formulating corresponding medium-term operation plans based on predetermined revenue, this paper draws the medium-term water level operation and output range of cascade hydropower stations when the robust region is [1-α,1+α].The specific results are shown in Figure 4. Figures 4A–D depict the operating water level range of stations A, B, and C when the runoff and market clearing price fluctuate by α = 0.151 around the predicted value. That is, when operating within this water level range, as long as the predicted error of electricity price and runoff does not exceed 15.1%, the marketized revenue of stations will not be lower than the expected revenue. Therefore, decision-makers can formulate corresponding operation and output plans within this range according to their own risk preferences, optimize medium-term dispatch plans, and avoid risks.
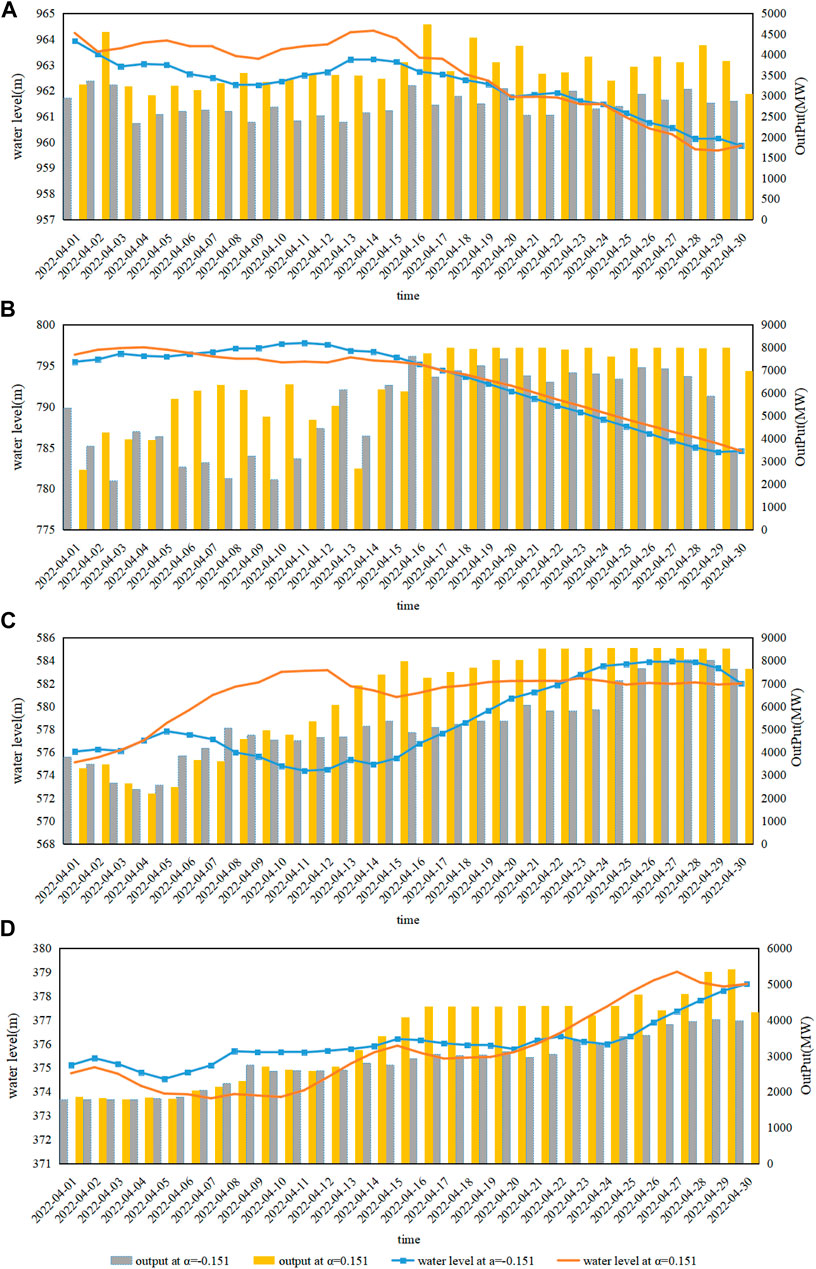
FIGURE 4. Operation range of cascade hydropower stations meeting the predetermined revenue. (A) Operating Process of Station (A) (B) Operating Process of Station (B) (C) Operating Process of Station (C) (D) Operating Process of Station (D).
4.3 Risk analysis of cascade hydropower station bidding decision in bidding stage
Using the calculation results from the previous section, when 1-σ = 0.75, the expected revenue of the station is Bc = 2511.86 million yuan. The maximum fluctuation range of the actual values of runoff and clearing price relative to the predicted values is α = 0.151.That is, when the actual daily runoff and clearing price fluctuate by no more than 15.1% around the predicted values, the station’s revenue can be guaranteed to be at least Bc = 2511.86 million yuan in the worst case. Based on Kahneman and Tversky’s experimental measurements, the risk preference coefficient a is set to 0.88, the risk aversion coefficient b is set to 0.88, the risk attitude coefficients θ and θ are set to 0.61 and 0.67, respectively, and the sensitivity coefficient λ is set to 1.25. Different scenarios are then analyzed and solved.
4.3.1 Model solving method
With a fixed expected revenue of Bc = 2511.86 million yuan and a clearing price ranging from 0.2168 to 0.2939, due to the limited data and potential fitting errors, it is assumed that the market clearing price follows a normal distribution of N (0.2553,0.016). The daily runoff is set to (1-α)*qi,t, and the generation output of the station is 11.59 billion kW hours. The bidding price is fixed at a step size of 0.005 yuan/kWh, and the prospect value of different bidding strategies is calculated. Then, by varying the mean and variance of the market clearing price, the prospect value is calculated and plotted as shown in Figure 3.
From Figure 5A, it can be seen that the variance represents the degree of fluctuation in predicted market clearing price. The smaller the variance, the smaller the price fluctuation, leading to a more concentrated price distribution and a higher probability of falling within the given [1-α,1+α] interval. Conversely, the larger the variance, the greater the price fluctuation, leading to a more dispersed price distribution and a lower probability of falling within the given interval.When the variance is 0.016, the price distribution is mostly concentrated within the interval specified by the IGDT robust model. To avoid losses from quoting too high and not being able to successfully cleared, the optimal bidding price for the decision-makers is 0.2368 yuan/kWh. When the variance is 0.064 and 0.144, the proportion of price distribution within the interval specified by the IGDT robust model is relatively small and dispersed. At this time, the optimal bidding prices for the decision-makers are 0.2568 yuan/kWh and 0.2618 yuan/kWh, slightly higher than the prices when the variance is 0.016.
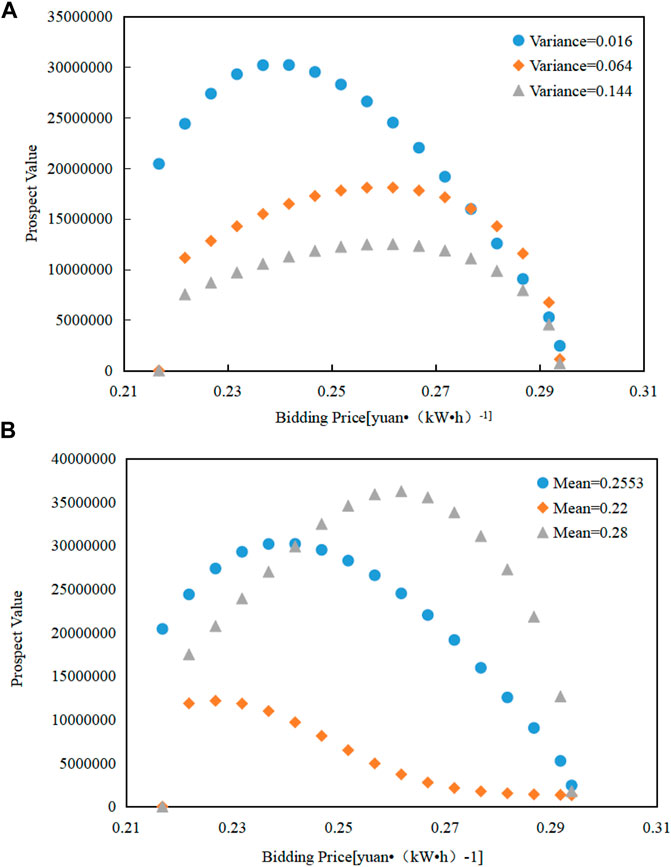
FIGURE 5. Optimal bidding price under different parameters with fixed expected return. (A) Influence of variance on optimal decision. (B) Influence of mean value on optimal decision.
As can be seen from Figure 5B, the mean has a greater impact on the bidding strategy than the variance.The mean represents the central location of the predicted market clearing price and affects the probability of a successful cleared. Within the price interval specified by the IGDT robust model, if the mean is closer to the lower bound, the optimal bidding price to ensure a successful cleared will also decrease. For example, when the mean is 0.22 yuan/kWh, the optimal bidding price for the decision-makers is 0.2168 yuan/kWh, and the prospect is negative, representing that this bidding strategy cannot meet the expected revenue of the decision-making, and its psychology is “loss”. When the mean is larger, the optimal bidding price also increases. For example, when the mean is 0.2553 yuan/kWh and 0.28 yuan/kWh, the optimal bidding price is 0.2368 yuan/kWh and 0.2568 yuan/kWh, respectively, and the model results are consistent with the facts.
4.3.2 Impact of bidding volume change on bidding strategy
When the daily runoff varies within [(1-α)*qi,t, (1+α)*qi,t], the generation output of the cascade hydropower station changes within [9.96878, 15.36877] billion kW hours, while other parameters remain unchanged. The optimal bidding price for the decision-maker is calculated under different generation outputs, as shown in Figure 6.
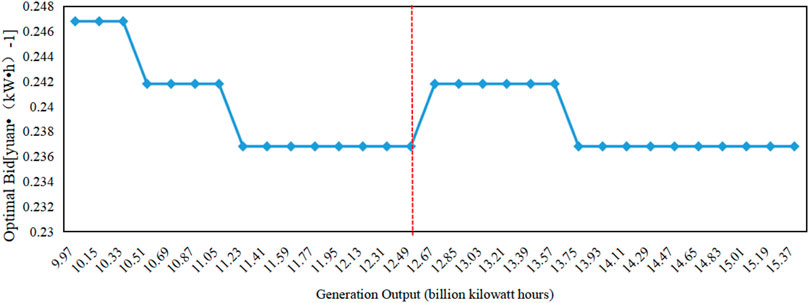
FIGURE 6. Influence of expected return on generation in IGDT robust model.
As shown in Figure 4, the expected revenue of the station is Bc = 2511.86 million RMB. According to the transaction settlement rules, when the power generation company fails to bid, the settlement price shall be 0.2 yuan/kWh.The producers needs to ensure at least 12.5 billion kW hours of electricity to meet its own expected revenue, even if the bidding fails.Therefore, when the generation output is less than 12.5 billion kW hours, that is, the sales revenue is less than the expected revenue, the decision-maker is “loss-averse” in terms of psychology. When facing a “loss-averse” situation, decision-maker often have a strong risk appetite and will choose higher-risk prices for bidding. As the generation output increases, the revenue increase from only relying on the on-grid tariff settlement, that is, the “loss” from failed bidding decreases, and the risk appetite of decision-maker weakens, so they will choose relatively lower-risk prices for clear. When the generation output is in the range of 12.5–12.6 billion kW hours, the optimal bidding price will increase slightly, that is, as the decision-maker transitions from “loss” to “gain” in terms of psychology, the comprehensive prospect value of slightly increasing the bidding price is greater than that only relying on the on-grid tariff settlement. When the generation output is greater than 12.5 billion kW hours, that is, the sales revenue is greater than the expected revenue, the decision-maker is “gain-seeking” in terms of psychology, and has a strong risk aversion tendency. They will choose lower-risk prices for bidding. However, after the generation output increases to a certain degree, the optimal bidding price of decision-maker remains unchanged. The model in this paper reflects the characteristic of decision-maker being loss-averse and gain-seeking in terms of risk appetite when facing different psychological expectations, which makes the decision results more in line with the psychological desires of decision-maker.
5 Conclusion
Based on IGDT and prospect theory, this paper proposes a mid-term optimization scheduling and trading decision-making method for cascade hydropower producers in the power market that jointly considers the bidding stages and the dispatching and operation risks. The optimization scheduling model for the dispatching stage is conceptually clear, operationally simple, and the results are intuitive, enabling the calculation of the maximum deviation range of daily runoff and market clearing prices from the predicted values when satisfying the decision-maker’s predetermined revenue. From the perspective of limited rationality, the model considers the decision-maker’s risk appetite for different revenue reference points in bidding stages, which is more in line with the facts, and obtains the optimal bidding strategy within a given range of clearing price changes. In order to solve the calculation error problem caused by fitting, this article adopts a nonlinear programming and improved stepwise optimization hybrid algorithm for solution. The research indicates that:
①When analyzing the risks of cascade hydropower producers in the power market environment, it is not sufficient to solely rely on the total revenue of each scenario. Instead, evaluations need to be conducted based on their psychological reference points. Therefore, the degree of risk preference held by operators is a key factor in determining both bidding and operating strategies. Furthermore, an operator’s risk appetite can vary depending on their changing psychological expectations.
②This method provides robust models that can withstand fluctuations in daily runoff and market clearing prices for mid-term scheduling and operation plans that meet different expected revenue targets for producers. Then, using prospect theory, the optimal bidding strategy in the long-term and medium-term markets within a given range of expected revenue and electricity price changes is obtained. Risk-averse and risk-seeking entities can evaluate different plans and adopt corresponding strategies to ensure expected revenue targets.
③The IGDT method requires little information about uncertain factors and does not require obtaining the probability distribution of uncertain parameters, making it suitable for dealing with risk decision-making problems with severe uncertainty. The robustness of the model is reflected in the maximum deviation range of the uncertain variables from the predicted values when ensuring that the expected target is not worse than a certain minimum preset result. Prospect theory takes into account the decision-maker’s psychology, making electricity price bidding decisions more in line with the actual decision-maker’s behavioral patterns.
Data availability statement
The original contributions presented in the study are included in the article/Supplementary Material, further inquiries can be directed to the corresponding author.
Author contributions
All authors listed have made a substantial, direct, and intellectual contribution to the work and approved it for publication.
Funding
This study is supported by the National Key Research and Development Program of China (No. 2019YFC0409000).
Acknowledgments
The authors are very grateful to the anonymous reviewers and editors for their constructive comments.
Conflict of interest
Authors JL, YL, HC, YX, HM, ZZ, TW, and YY were employed by China Yangtze Power Co. Ltd.
Publisher’s note
All claims expressed in this article are solely those of the authors and do not necessarily represent those of their affiliated organizations, or those of the publisher, the editors and the reviewers. Any product that may be evaluated in this article, or claim that may be made by its manufacturer, is not guaranteed or endorsed by the publisher.
Supplementary material
The Supplementary Material for this article can be found online at: https://www.frontiersin.org/articles/10.3389/fenrg.2023.1252624/full#supplementary-material
References
Cheng, C., Chen, F., Li, G., Ristić, B., Mirchi, A., Qiyu, T., et al. (2018). Reform and renewables in China: the architecture of yunnan's hydropower dominated electricity market. Renew. Sustain. Energy Rev. 94, 682–693. doi:10.1016/j.rser.2018.06.033
Dai, T., and Qiao, W. (2015). Optimal bidding strategy of a strategic wind power producer in the short-term market. IEEE Trans. Sustain. energy 6 (3), 707–719. doi:10.1109/TSTE.2015.2406322
Federico, G., and Rahman, D. M. (2001). Bidding in an electricity pay-as-bid auction. J. Regul. Econ. 24 (2), 175–211. doi:10.2139/ssrn.271700
Kahn, A. E., Porter, C., Robert, R. H., and Tabors, R. D. (2001). Uniform pricing or pay-as-bid pricing. Electr. J. 14 (6), 70–79. doi:10.1016/S1040-6190(01)00216-0
Li, G., Lu, J., Yang, R., and Chuntian, C. (2021). IGDT-based medium-term optimal cascade hydropower operation in multimarket with hydrologic and economic uncertainties. J. Water Resour. Plan. Manag. 147 (10), 1–11. doi:10.1061/(asce)wr.1943-5452.0001444
Li, S., Liao, S., Li, G., Cheng, C., and Li, X. (2012). Integrated power generation scheduling compilation method for large-scale small hydropower station group. Proc. Csee 32 (13), 29–35. doi:10.13334/j.0258-8013.pcsee.2012.13.003
Li, T., Gao, C., Chen, T., and Zhang, T. (2022). Medium and long-term electricity market trading strategy considering renewable portfolio standard in the transitional period of electricity market reform in Jiangsu, China. Energy Econ. 57, 107–112. doi:10.3760/cma.j.cn112144-20211009-00457
Liu, S., Yang, Q., Cai, H., Yan, M., Zhang, M., Wu, D., et al. (2019). Marketreform of yunnan electricity in southwestern China: practice,challenges and implications. Renew. Sustain. Energy Rev. 113, 109265. doi:10.1016/j.rser.2019.109265
Lu, J., Li, G., Cheng, C., and Liu, B. (2021). A long-term Intelligent operation and management model of cascade hydropower stations based on chance constrained programming under multi-market coupling. Environ. Res. Lett. 16 (5), 055034. doi:10.1088/1748-9326/abef90
Moradi-Dalvand, M., Mohammadi-IvatlooAmjady, B., Zareipour, H., and Mazhab-Jafari, A. (2015). Self-scheduling of a wind producer based on information gap decision theory. Energy 81, 588–600. doi:10.1016/j.energy.2015.01.00
Nojavan, S., Mohammadi-Ivatloo, B., and Zare, K. (2015a). Retracted: robust optimization based price-taker retailer bidding strategy under pool market price uncertainty. Int. J. Electr. Power & Energy Syst. 73, 955–963. doi:10.1016/j.ijepes.2015.06.025
Nojavan, S., Zare, K., and Ashpazi, M. A. (2015b). A hybrid approach based on IGDT–MPSO method for optimal bidding strategy of price-taker generation station in day-ahead electricity market. Int. J. Electr. Power & Energy Syst. 69, 335–343. doi:10.1016/j.ijepes.2015.01.006
Peng, C., Sun, H., Guo, J., and Liu, G. (2012). Multi-objective optimal strategy for generating and bidding in the power market. Energy Convers. Manag. 57, 13–22. doi:10.1016/j.enconman.2011.12.006
Rodriguez, C. P., and Anders, G. J. (2004). Bidding strategy design for different types of electric power market participants. Power Syst. IEEE Trans.19 (2), 964–971. doi:10.1109/TPWRS.2004.826763
Tversky, A., and Kahneman, D. (1992). Advances in prospect theory. J Risk Uncertain. 5 (4), 297–323. doi:10.1007/bf00122574
Tversky, K. A. (1979). Prospect theory: an analysis of decision under risk. Econometrica 47 (2), 263–291. doi:10.2307/1914185
Wright, L. F. (2004). Information gap decision theory: decisions under severe uncertainty. J. R. Stat. Soc. 167 (1), 185–186. doi:10.1111/j.1467-985x.2004.298_4.x
Yao, Y., Gao, C., Tian, H., and Zhang, H. (2020). Review of mid-to long-term trading mechanism for renewable electricity consumption in Ningxia, China. Renew. Sustain. Energy Rev. 134, 110325. doi:10.1016/j.rser.2020.110325
Keywords: power market, information gap decision theory, prospect theory, robust optimization, cascade hydropower stations, risk decision
Citation: Lu J, Liu Y, Cao H, Xu Y, Ma H, Zhang Z, Wang T and Yang Y (2023) Mid-term scheduling and trading decisions for cascade hydropower stations considering multiple variable uncertainties. Front. Energy Res. 11:1252624. doi: 10.3389/fenrg.2023.1252624
Received: 04 July 2023; Accepted: 18 September 2023;
Published: 13 October 2023.
Edited by:
Yongxin Xiong, Aalborg University, DenmarkReviewed by:
Xu Xu, Xi’an Jiaotong-Liverpool University, ChinaZhiqiang Jiang, Huazhong University of Science and Technology, China
Copyright © 2023 Lu, Liu, Cao, Xu, Ma, Zhang, Wang and Yang. This is an open-access article distributed under the terms of the Creative Commons Attribution License (CC BY). The use, distribution or reproduction in other forums is permitted, provided the original author(s) and the copyright owner(s) are credited and that the original publication in this journal is cited, in accordance with accepted academic practice. No use, distribution or reproduction is permitted which does not comply with these terms.
*Correspondence: Jia Lu, NDQyODk1NTQ5QHFxLmNvbQ==