
95% of researchers rate our articles as excellent or good
Learn more about the work of our research integrity team to safeguard the quality of each article we publish.
Find out more
ORIGINAL RESEARCH article
Front. Energy Res. , 26 October 2023
Sec. Wind Energy
Volume 11 - 2023 | https://doi.org/10.3389/fenrg.2023.1252623
This article is part of the Research Topic Advances in Wind Turbine Rotor Design View all 8 articles
 Huawu Zhang
 Yihuai Hu*
Wind power generation is considered an effective way for ships to harness wind energy, and the aerodynamic characteristics of wind turbines determine wind energy utilization and efficiency. However, traditional vertical axis wind turbines have intermediate shafts and support rods, which result in large negative effects in the research of the wind turbine aerodynamic characteristics. To address this issue, a Straight-Bladed Vertical Axis Wind Turbine (SB-VAWT) without intermediate support axes is proposed. The turbine can flexibly change the number of blades, rotor diameter, and installation position of blades. The static aerodynamic performance of the wind turbine with different combinations was tested in a wind tunnel laboratory at 10 m/s. The results show that the radius of the wind turbine has a greater effect on the drag coefficient for the same number of blades, with an inverse relationship between the drag coefficient and radius, and a positive association between lift coefficient, static torque coefficient, and radius. The drag coefficient is proportional to the number of blades at the same radius, while the static torque coefficient is inversely proportional to the number of blades. According to the results, placing the initial location in the azimuth range between 30° and 50° can obtain the maximum initial starting torque. Moreover, a wind turbine with a radius of 16 cm can achieve a higher average torque. Changes in the number of blades can significantly impact turbine properties, resulting in wind turbines with distinct features.
As the global energy constraint and environmental degradation become more apparent, the search for renewable energy to replace fossil fuels such as coal and oil for power generation has become an unavoidable trend. Wind energy, being a clean and easily accessible renewable energy source, has many advantages over other forms of energy. It produces no pollution, has a small footprint, and a lower environmental impact, making it an important solution to replace the use of fossil fuels and is widely valued globally (Hand et al., 2021).
The maritime industry is currently evolving towards “smart, low-carbon, and sustainable.” As a result, intelligent and green technologies are becoming more prevalent in numerous sectors of the maritime industry. Wind energy offers a vital alternative to the usage of fossil fuels, being a clean and easily accessible renewable energy source. Wind energy has emerged as a critical technological approach for lowering ship emissions.
Wind-assisted propulsion and wind power generation are the two primary applications of wind energy in today’s shipping industry (Pan et al., 2021; Xiang and Sun, 2022). Wind turbines capture wind energy and convert it into electrical energy for wind power generation. There are two types of wind turbines: horizontal axis wind turbines (HAWTs) and vertical axis wind turbines (VAWTs) (Azadani and Saleh, 2022; Tong et al., 2023). HAWTs are commonly used in large wind farms and offshore wind farms due to their larger application scales and more mature research (Eltayesh et al., 2021; Bošnjaković et al., 2022). On the other hand, VAWTs face more difficult research problems due to their blades cutting the flow field back and forth, a wide range of changes in angle of attack (AOA), and complex aerodynamics in one rotation cycle (Zhang and Hu, 2020; Li et al., 2023). However, VAWTs have several advantages over HAWTs, such as not requiring yawing into the wind, having a low center of equipment gravity, being simple in structure, low in cost, low aerodynamic noise, easy to install and maintain, and having high safety (Guo et al., 2022; Ni et al., 2022; Pietrykowski et al., 2023). VAWTs are also more easily adapted to complex environments (Howell et al., 2010; Rezaeiha et al., 2018; Guevara et al., 2021), making them a hot topic of research in recent years. VAWTs, especially straight-bladed VAWTs (SB-VAWTs), a Darrieus type VAWT, are ideal for utilization of wind energy on board ships due to their lower complexity, ease of operation, lower costs, and superior ship stability. SB-VAWT is one of the most investigated VAWTs in the world due to their regular blade shape, ease of fabrication, low cost, and great aerodynamic characteristics (Wang et al., 2018; Guevara et al., 2021; Li et al., 2023). Figure 1 illustrates practical applications of SB-VAWTs on ships (Hand and Cashman, 2020; Zhang and Hu, 2020).
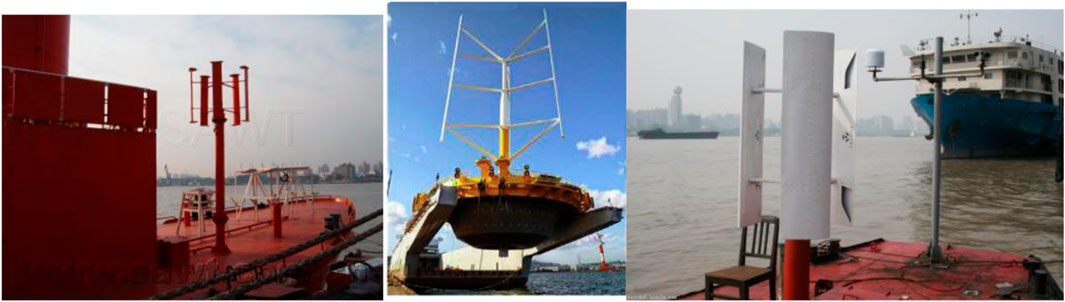
FIGURE 1. Utilizations of SB-VAWTs on board.
VAWTs are now designed with intermediate support shafts and struts (Li et al., 2023; Wilberforce and Alaswad, 2023), which are regarded as critical components that must not be disregarded when bearing loads (Li et al., 2015). Several studies have been conducted to investigate the impact of these support structures on the VAWTs’ aerodynamic performance. Zhang et al. (2018a) investigated the effect of various wind turbine settings on the polarization effect of the support axis and the force on the support axis during wind turbine operation. The results show that the synthetic force generated by the blade on the main shaft during a cycle of operation is wavy and cannot be counteracted. Zhang Lidong et al. (Zhang et al., 2018b) discovered that the shedding vortices released by the shaft have a negative effect on the aerodynamic performance of the blades passing the wake of the wind shaft, resulting in lower power output. Aya Aihara et al. (Aihara et al., 2022a) used the Reynolds-averaged Navier-Stokes (RANS) model to determine that the support structure has a significant negative effect on the total tangential force of the wind turbine at high tip speed ratios (TSRs). Van Stratan et al. (Stratan et al., 2023) studied the aerodynamic characteristics of support arm in 3D numerical predictions on the performance of a two-bladed VAWT with dual support arm configuration. Results with arms were compared against an ideal turbine with no support arms. In the comparison of the power coefficients, the predicted power coefficients are significantly reduced due to the parasitic effect of the turbine arm.
To minimize the adverse effects of the support system on wind turbines, many researchers have studied the optimization of support systems from aspects such as the arrangement of support systems, the shape of support arms and structural forms. Philip Marsh et al. (Marsh et al., 2015) studied three vertical-axis turbines with different strut profiles, blade-strut joints, and strut position by using three-dimensional Unsteady Reynolds-averaged Navier-Stokes (URANS) simulations. The strut profile and blade-strut joint design were found to significantly influence the total power output while the strut position had a smaller but still significant effect. Bayram et al. (Bayram et al., 2022) used numerical modeling to investigate the characteristics of vertical axis hydroelectric power facilities with various blade support arrangements. Huang Huilan et al. (Huang et al., 2022) investigated the effect of different diameters of embedded cylinders on the aerodynamic performance of H-type VAWTs by numerical simulation and experimental validation, and the study revealed that all the embedded entities of different diameters are detrimental to the wind energy utilization of wind turbines, and the larger the diameter the more obvious the effect. Weipao Miao et al. (Miao et al., 2023) investigated thirty strut profiles of a SB-VAWT by a three-dimensional computational fluid dynamics (3D CFD) approach, to find the appropriate strut design parameters that minimize the impact on the aerodynamic performance. The results show that the power loss of a VAWT has a relatively linear relationship with the dimensionless absolute thickness of the strut within a certain range. Thierry Villeneuve et al. (Villeneuve et al., 2021) investigated the impact of the blade support structures on the performance of VAWTs form 25 three-dimensional URANS simulations of a single-blade VAWT with various strut configurations. The results suggested that well-designed struts can be highly beneficial to the efficiency of VAWTs.
To further quantify the adverse effects of the support system, such as power loss, researchers have conducted comparative analyses with and without support systems, using various computational fluid dynamics (CFD) numerical simulation methods to provide accurate quantitative data. Benjamin Strom et al. (Strom et al., 2018) introduced the analytical models for the power loss due to mounting structure drag and examined the interactions between turbine blades and mounting structures. Yutaka Hara et al. (Hara et al., 2019) attached three types of support arms with different cross-sectional shapes to a small SB-VAWT rotor without support arms. The surface pressure and friction distribution on the blades and support arms were analyzed using CFD. The differences in tangential force and drag torque caused by the addition of support arms with different cross-sectional shapes were calculated. Siddiqui et al. (Siddiqui et al., 2015) discovered that disregarding the wind turbine’s support system in the computation can result in a 10%–12% deviation in the estimated value of the power coefficient. In a study on the numerical simulation analysis of the non-constant aerodynamic characteristics of VAWTs, Lei Hang et al. (Lei, 2019) discovered that ignoring the wind turbine main shaft and support axis modeling results in a higher power coefficient calculated by the model than the experimental value, with a maximum deviation of 9.03%. Abdolrahim Rezaeiha (Rezaeiha et al., 2017) used URANS equations to compute the power loss in wind turbines caused by the presence of a central shaft. The computations were performed on a high-resolution computational grid with different ratios of shaft diameter to rotor diameter (δ) ranging from 0% to 16%. The study found that as the ratio of shaft diameter to rotor diameter increased, the width and length of the wake behind the shaft increased, resulting in a progressive increase in power loss. Compared to the case without a shaft, the maximum power loss was found to be 5.5% when δ = 16%. Aya Aihara (Aihara et al., 2022b) conducted 3D URANS simulations to study the effects of support arms and intermediate shaft on the flow patterns, blade loading distribution, and rotor performance of a 12 kW, 3-bladed H-VAWT under a TSR of 4.16. A comparison between the cases with and without support arms revealed significant differences in the force distribution on the blades. Due to the interaction between the wake generated by the support arms and the blades, the tangential force decreased on the downwind side, resulting in a 43% decrease in power coefficient. Zhang Yanfeng et al. (Zhang et al., 2023) used a Reynolds Time-averaged Turbulence Model (SST K-ω) to perform CFD simulations of a VAWT to qualitatively analyze the influence of blade support on the aerodynamic performance of a linear-wing VAWT. The study’s findings demonstrated that the blade support had a significant impact on the complex flow separation phenomenon at large AOA, that the support’s rotational disturbance increased the airflow inside the wind turbine’s turbulence intensity, and that the support was responsible for a 47.5% reduction in the VAWT’s maximum power coefficient.
The studies mentioned above have shown that the support system has a significant impact on wind turbine performance, and without a specific optimization design, it can have a detrimental effect on the turbine’s performance. However, the optimization effect of the support system is not always apparent, and positive optimization can only be achieved for the single-blade wind turbine with minimal disturbance of aerodynamic characteristics. The actual wind turbines used in practice show huge differences, making further breakthroughs in improving the support system difficult. As a result, researchers have developed wind turbines without support systems to avoid the adverse effects, successfully circumventing this adverse effect and opening up new research directions.
Wu Wanqiu et al. (Wu et al., 2021) developed a semi-cylindrical drag wind turbine without a central rotating shaft in order to eliminate the interference caused by intermediate shaft and struts to the internal flow field of the wind turbine, which can negatively affect its performance. The advantages of this wind turbine’s structure without a central shaft have been demonstrated by Wu Wanqiu’s design, including reduced noise due to the absence of shaft-induced turbulent airflow, and a smoother airflow channel within the turbine that enhances its capacity to withstand high wind speed flows. However, the aerodynamic performance of this type of VAWT has not been studied yet.
This paper presents a SB-VAWT design without intermediate shafts and support bars. Static aerodynamic characteristics research was conducted to study the effects of different parameters. Measuring the aerodynamic lift and drag forces on the wind turbine as a whole in the wind tunnel flow field is necessary to study the forces on the base support system and the forces generated on the ship for stability and strength checks in ship application scenarios. Similarly, measuring the static torque of a wind turbine is necessary to study its starting characteristics and rotational power generation capability. By providing techniques and research results for studying VAWTs without intermediary support axes, it is expected to provide a framework for future practical applications of VAWTs for power generation on ships.
The VAWT without intermediate support shafts, referred to as the device, consists of upper and lower end plates, blades, and supportive seats. The blades serve as a support structure for the upper and lower end plates as well as for themselves, eliminating the need for intermediate support shafts and blade struts. The end plates have mounting holes of varying radius, allowing for the blades to be mounted and the radius of the wind turbine to be adjusted. The device has two blade mounting types: positive and negative. Positive installation refers to the concave side of the blade facing inward, while negative installation refers to the concave side facing outward. The aerodynamic characteristics of the wind turbine can be studied using this device under various blade numbers, blade positive and negative installation modes, and wind turbine radius variations.
The blade was designed based on the commonly used NACA0012 airfoil considering the following factors: Firstly, the thickest section of the blade was moved forward to observe the impact of thickness on startup performance and enhance it accordingly. Secondly, when the wind turbine rotates, the airflow around the blades can be considered to move in a straight line if the blade’s chord length is relatively small compared to the diameter of the wind turbine. However, the chord length of the designed blade is relatively long compared to the diameter of the wind turbine, resulting in curved airflow around the blades. Therefore, the blade’s shape is designed with a curvature that can be maintained while rotating. The airflow around the blades is straight, and the curvature of the blades can be thought of as a straight flow field along the rotating circumference (Migliore et al., 1980). Additionally, this curvature enhances the structural stability of the blade’s connection with the upper and lower end plates, which are designed to minimize airflow escaping from the blade tip, improving the wind turbine’s aerodynamic performance (Sun and Zhou, 2021).
The blade and the end plate openings are shown in Figure 2.
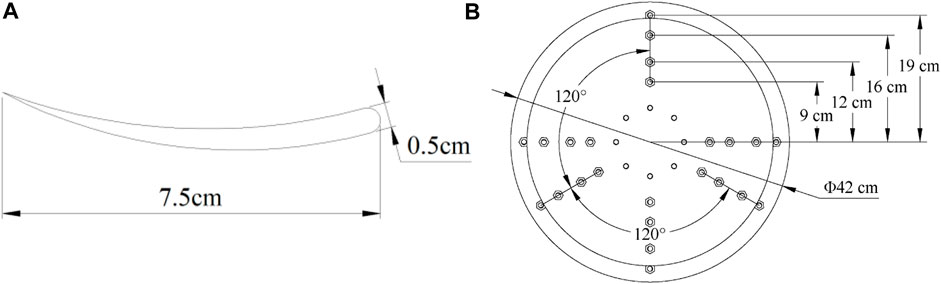
FIGURE 2. (A) Wind turbine blade dimensions. (B) Position and dimensions of the upper and lower end plate openings of the wind turbine device.
Figure 3 depicts the device’s general dimensions as well as how it was installed in the wind tunnel. The dimensions are listed in Table 1.
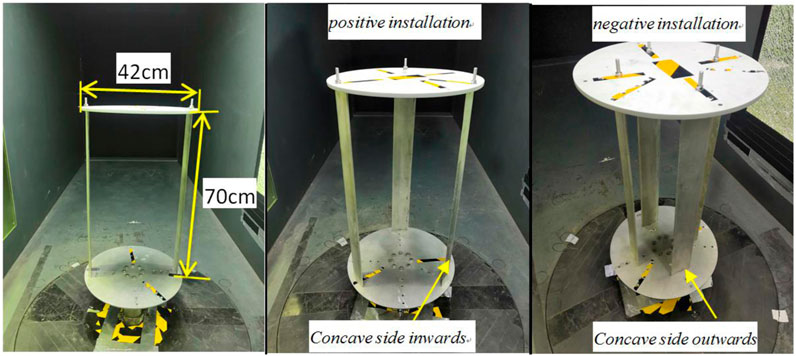
FIGURE 3. Wind turbine device installation schematic in wind tunnel experiments with various numbers of blades.
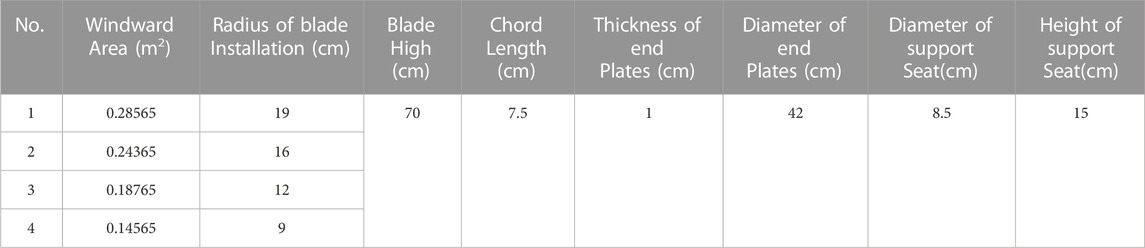
TABLE 1. The parameters of the vertical wind turbine.
The test wind tunnel as shown in Figure 4A is a closed-loop wind tunnel, manufactured by the Aerodynamic Research Institute of Aviation Industry Corporation of China, Ltd. It has a maximum rated power of 132 kW, and the wind speed is regulated by a closed loop. The test wind speed can be easily and precisely controlled between 1 and 40 m/s. The airflow stability is ≤± 0.365%, turbulence is ≤0.275%, and unevenness is ≤±0.28%. The wind tunnel can provide a uniform and stable flow field for conducting this experimental test.
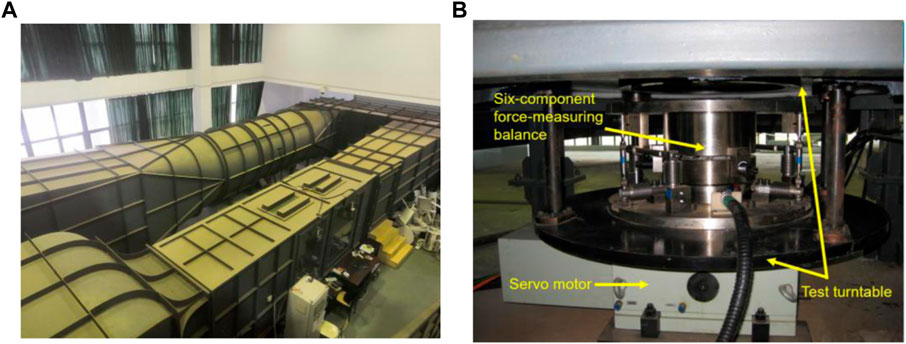
FIGURE 4. (A) Wind tunnel; (B) The balance.
A test turntable is installed in the wind tunnel’s test section. A servo motor precisely adjusts the rotation angle of the turntable from −10° to 370°, with an accuracy of 0.1° to change the azimuth. A six-component force-measuring balance (hereinafter referred to as the balance) is mounted on the turntable, which rotates together with the turntable. Figure 4B shows the balance fixed on the turntable.
The balance mounted on the turntable measures the forces of the device. The balance model is 13-SHHSTP-550A, which exhibits a maximum relative error of 0.44% for the force and a minimum relative error of 0.094% for the torque measured in three directions. The test wind speed is measured by a pitot tube (Kimo Instruments TPL-06-300), which is then fed back into the control system to achieve wind speed closed-loop control. The pitot tube has an accuracy of 1% when the position of the pitot tube is offset by ±10° from the direction of air flow. The data from the balance’s six channels is collected by two NI sampling modules (cDAQ-9181) and output via a full Gigabit Ethernet Switch (TL-SG 1008) to the data processing computer. The data acquisition frequency of the NI acquisition module is 5 kHz. The data processing computer processes the data every 5 s, calculates the average and outputs it as a data set. During the test, the data is first tested under no-wind conditions. Then the wind tunnel is operated at the set wind speed and tests are carried out for at least 3 min at each different azimuth angle condition. A minimum of 30 sets of output data are obtained. The data acquisition and processing software automatically performs a zero offset calibration and then calculates the averages to obtain the forces and static torque experienced by the device. The above measurement and processing methods eliminate measurement errors and provide reliable steady-state experimental data. The data acquisition and transmission of the balance is shown in Figure 5.

FIGURE 5. The data acquisition and transmission of the balance.
The wind turbine is connected to the balance via the base, and they revolve in tandem with the turntable to vary the azimuth. The test force measurement is based on the balance coordinate system. However, because the turntable rotates the balance, the forces measured require a coordinate transformation (Zhang and Hu, 2021). At the wind turbine’s initial 0° azimuth position, the blade chord direction is perpendicular to the incoming flow direction, and the balance axis system is consistent with the wind tunnel axis system.
The blades of VAWT often operate in complex aerodynamic environments, such as low stall and deep stall, where the AOA is constantly changing according to different TSR variation curves at AOA (Hand et al., 2021). It is well known that the range of AOA variation at different azimuth angles of wind turbine blades is much larger under static conditions than under dynamic rotating conditions (Zhao et al., 2022). The greater the TSR, the smaller the change in AOA and less likely stall occurs. However, the variation of azimuth in the static state contains the whole range of AOA corresponding to the variation of TSR in the dynamic rotation of the turbine (Hassan et al., 2023). As a result, this aerodynamic characteristic test examines the static aerodynamic properties of the entire wind turbine at various azimuthal angles.
The turbine is tested in a homogeneous flow field with a wind speed of 10 m/s. The zero position of the turntable aligns with the zero coordinates of the balance and coincides with the wind tunnel coordinates. To monitor the force and torque of the wind turbine at various azimuths, the control turntable rotated counter-clockwise at 5° intervals from the 0° azimuth position.
Figure 6A illustrates the force and torque coordinate system of the balance, which rotates along with the balance itself. The wind turbine placed on the wind tunnel balance experiences an aerodynamic force that can be decomposed into two components: the lift force FL, which is perpendicular to the incoming flow, and the drag force Fd, which is parallel to the incoming flow (Zeng and Zhang, 2018). Figure 6B demonstrates the lift force FL, drag force Fd and torque My along the Y-axis of the wind tunnel.
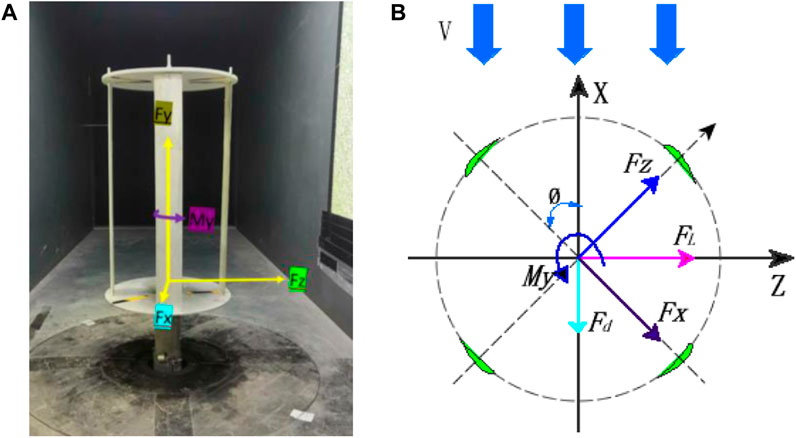
FIGURE 6. (A) Coordinate system of the force measurement system of the balance in the wind tunnel at 0° azimuth of the devices in wind tunnel; (B) Schematic illustration of the forces on a 4-blade wind turbine device in wind tunnel tests when turned through an θ azimuth.
The forces on the device are determined by force transducers based on the force of the balance coordinates. The balance follows the turntable and the test device to turn the θ angle together, changing the azimuthal angle of the turbine, while the wind direction remains constant during the wind tunnel test. Before calculating the lift coefficient CL, drag coefficient Cd, and torque coefficient CM for the device as a whole based on the device and test parameters, the drag Fd and lift FL must be transformed (Zhang and Hu, 2021).
According to the decomposition and synthesis of forces, the overall lift force FL of the wind turbine
The resistance Fd of the wind turbine
The wind turbine’s torque My can be measured directly.
By definition from (Paraschivoiu, 2002), the lift coefficient CL of the wind turbine
The drag force coefficient Cd
The torque coefficient CM
In Eq. 3–5, S is the windward area of the device; ρ is the air density; and R is the radius of the wind turbine. The air density is 1.225 kg⁄m3 based on the temperature and air pressure measured during the test, and V is the test wind speed of 10 m/s.
The device can change parameters flexibly. Referring to Table 2, the Variable Parameters Table of Wind Turbine Device, three sets of nine variables can be derived, resulting in a total 24 research combinations. By comparing the overall characteristics of wind turbine devices under different variable combinations, valuable insights can be gained.

TABLE 2. Variable parameters table of wind turbine testing device.
Figure 7, Figure 8, Figure 9 show the drag force and drag coefficient curves with azimuths for the positive and negative installation of 2, 3, and 4 blades at various radii.
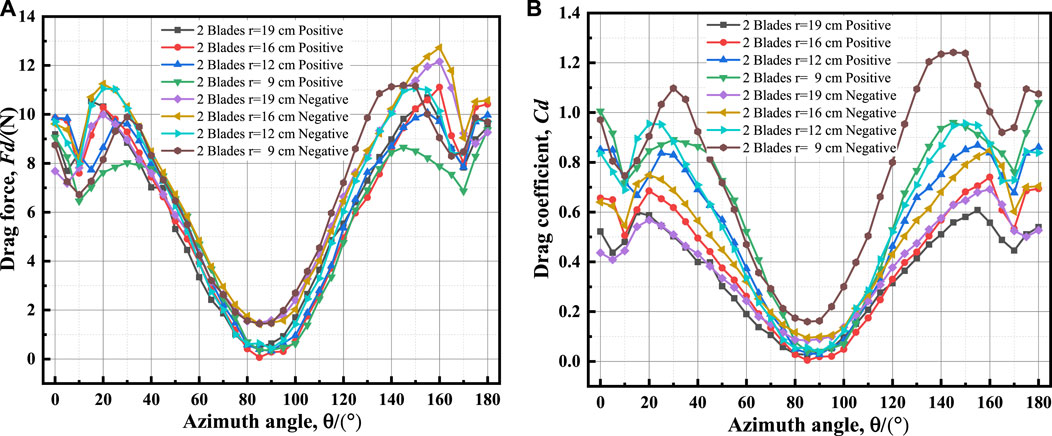
FIGURE 7. Curves of 2-blades at different radii: (A) drag forces; (B) drag coefficients.
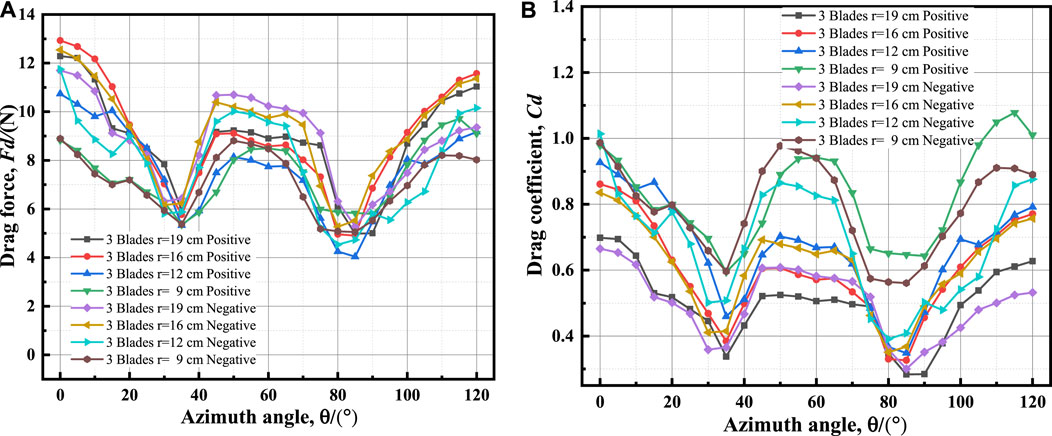
FIGURE 8. Curves of 3-blades at different radii: (A) drag forces; (B) drag coefficients.
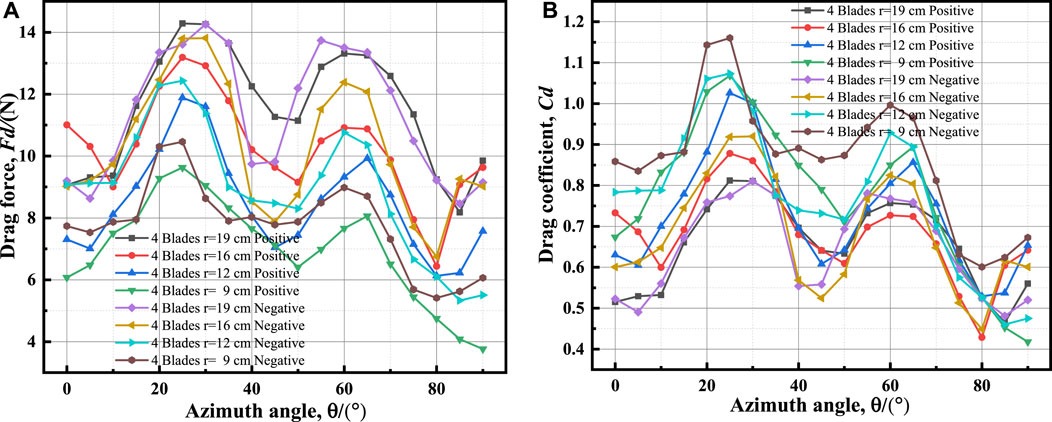
FIGURE 9. Curves of 4-blades at different radii: (A) drag forces; (B) drag coefficients.
Figures 7–9 demonstrate that, for the same number of blades, the drag coefficients increase as the blade radius decreases, regardless of whether the blades are installed positively or negatively. This is because as the blade radius decreases, the physical space between the blades shrinks, and the airflow through the inner part of the wind turbine decreases. This causes the airflow to pass through the periphery of the wind turbine at high speed, and the interaction between the air flows through the blades becomes strong, causing the airflow through the blades to produce more turbulence, resulting in an increase in the drag coefficient of the wind turbine. The increase in drag coefficient is only related to the radius of the wind turbine and has nothing to do with the mode of blade installation or the number of blades. On the other hand, the size of the device’s wind area is proportional to the radius. When the radius is reduced, the wind area of the device is reduced, and the drag to the device changes less with the radius reduction than the reduction of the area caused by the radius reduction. Thus, according to the formula for calculating the drag coefficient, the value of the drag coefficient increases with a reduction in radius.
Figures 10A–C show the difference in drag forces for the same number of blades with different blade radii for negative and positive installations.
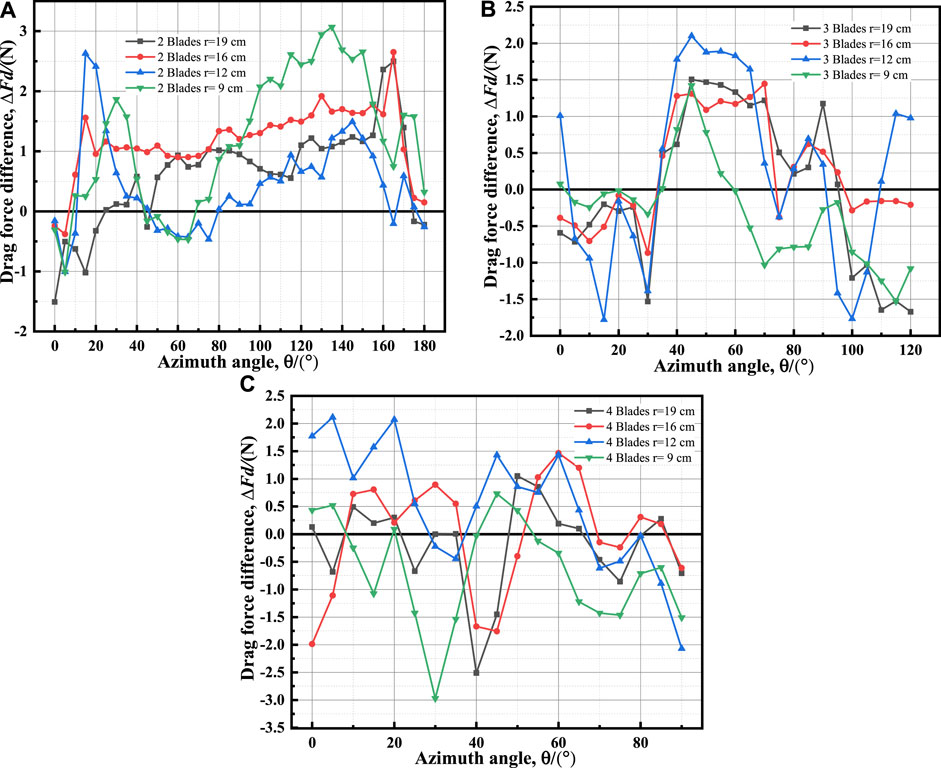
FIGURE 10. Curves of drag differences at different radii: (A) 2-blades; (B) 3-blades; (C) 4-blades.
In most azimuthal ranges, the drag forces of blade negative installation are greater than those of blade positive installation, and the difference in drag with a small radius fluctuates greatly. As the number of blades increases, this pattern remains constant but gradually weakens. However, this law no longer holds true for all cases. As shown in Figure 10C, the drag forces of blade positive installation are greater than those of negative installation in most azimuthal ranges with radius r = 9 cm. The drag difference is relatively stable with a radius of r = 16 cm. According to the drag coefficient calculation formula, the resistance coefficients of blade negative installation are greater than those of blade positive installation. This is because the concave surface is facing outward, and the blade negative installation has a stronger disturbance effect on the airflow, resulting in higher drag than when the blade is positively installed. The effect is more noticeable with fewer blades. However, as the number of blades increases, the airflow entering the blade decreases, and the mutual interference between the upstream and downstream blades increases. The more blades there are, the stronger the interference of the upstream blades on the downstream blades. In blade negative installation, the downstream blade interferes strongly with the upstream blade, resulting in lower effective drag of the incoming flow. This is demonstrated by the fact that with more blades, eventually, the drag in negative installation becomes less than that in positive installation.
Figure 11, Figure 12, Figure 13 depict the lift force and lift coefficient curves of 2, 3, and 4 blades installed positively and negatively with azimuthal angle at various radii.
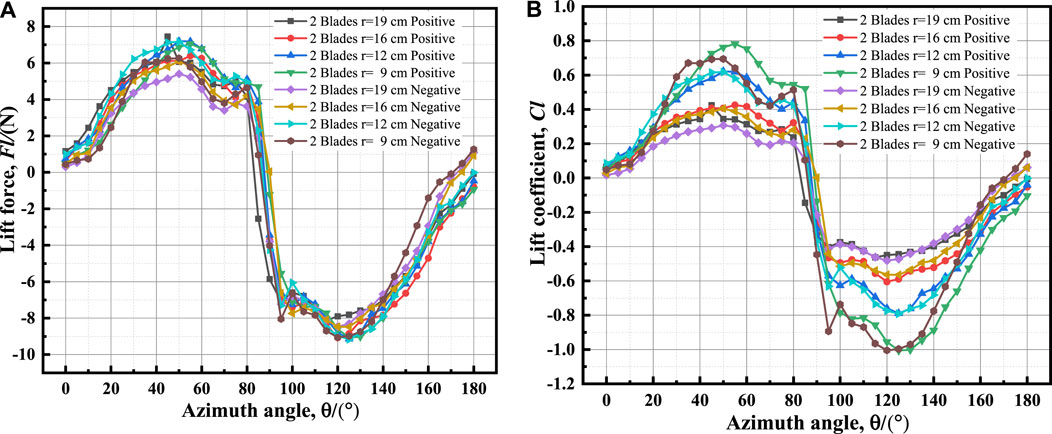
FIGURE 11. Curves of 2-blades at different radii: (A) lift forces; (B) lift coefficients.
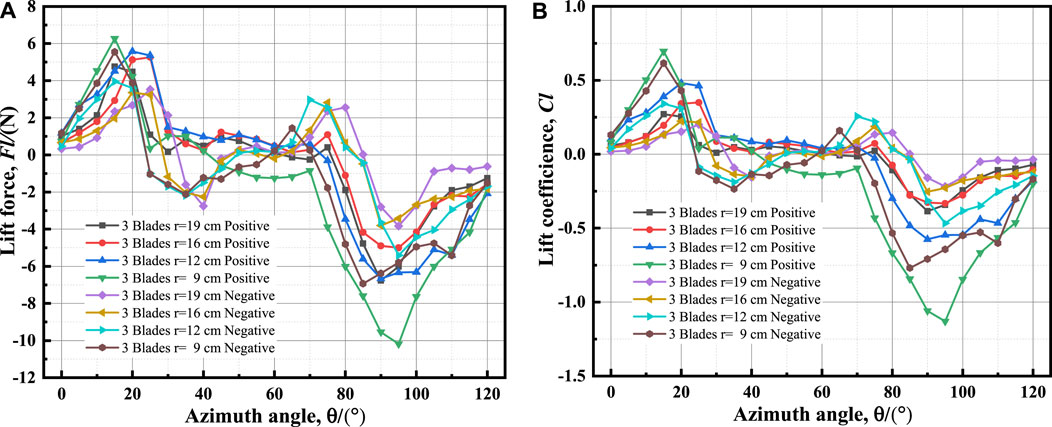
FIGURE 12. Curves of 3-blades at different radii: (A) lift forces; (B) lift coefficients.
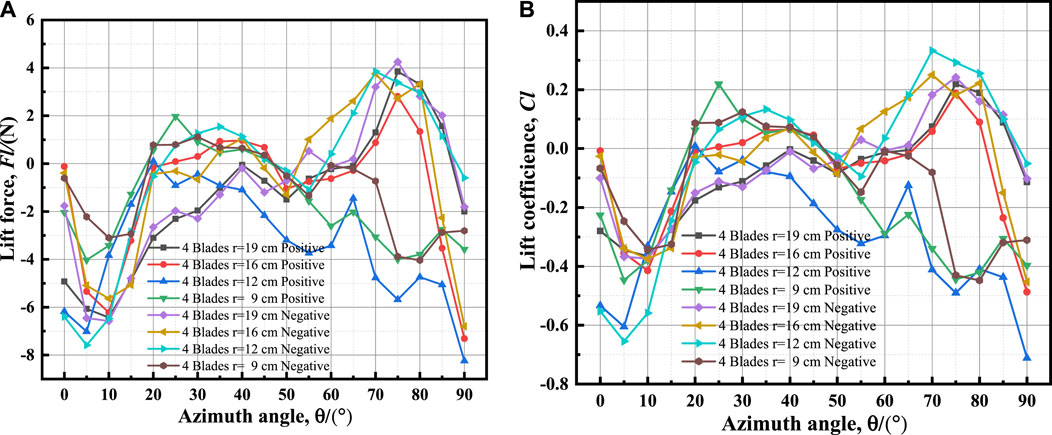
FIGURE 13. Curves of 4-blades at different radii: (A) lift forces; (B) lift coefficients.
Figures 11–13 demonstrate that under the same blade number conditions, whether installed positively or negatively, the lift force and lift coefficient increase gradually as the blade radius decreases. However, as the number of blades increases, the lift force and lift coefficient begin to deviate from this rule. In the large azimuth range, the absolute value of the device with a radius of 12 cm begins to be greater than that of 9 cm when there are four blades. This is because as the blade radius decreases, the physical space between the blades shrinks, and the airflow interaction between the blades strengthens, causing the airflow through the blades to produce more powerful turbulence disturbance. The airflow between the blades causes the speed to increase as the radius decreases, increasing the overall lift force and lift coefficient of the wind turbine device, regardless of the positive or negative installation mode of the blades. However, the radius cannot be reduced arbitrarily, and some airflow must be allowed to pass through the gap between the blades. Figure 11 shows that the interference between the blades of a 2-blade device is weaker than that of a 3-blade device and a 4-blade device. The lift force and lift coefficient curves are symmetric, with most of the airflow passing through the gap between the blades. The change amplitude of the lift force and lift coefficient decreases as the radius increases, and the maximum value’s azimuth range is nearly the same for different radii. The fluctuation under negative installation is more noticeable than under positive installation, particularly in the 70°–90°, 0°–20°, and 160°–180° azimuth ranges. Compared to Figures 12, 13, it is discovered that as the number of blades increases, the symmetry of the lift force and lift coefficient weakens, and the interference between the blades becomes stronger, resulting in more obvious fluctuation with azimuth.
Since the lift and lift coefficient have the same variable characteristics, only the lift coefficient is used for comparison. Figure 14(A) to (D) illustrate the change curves of lift coefficients of 2, 3, and 4 blades to azimuth for the same radius.
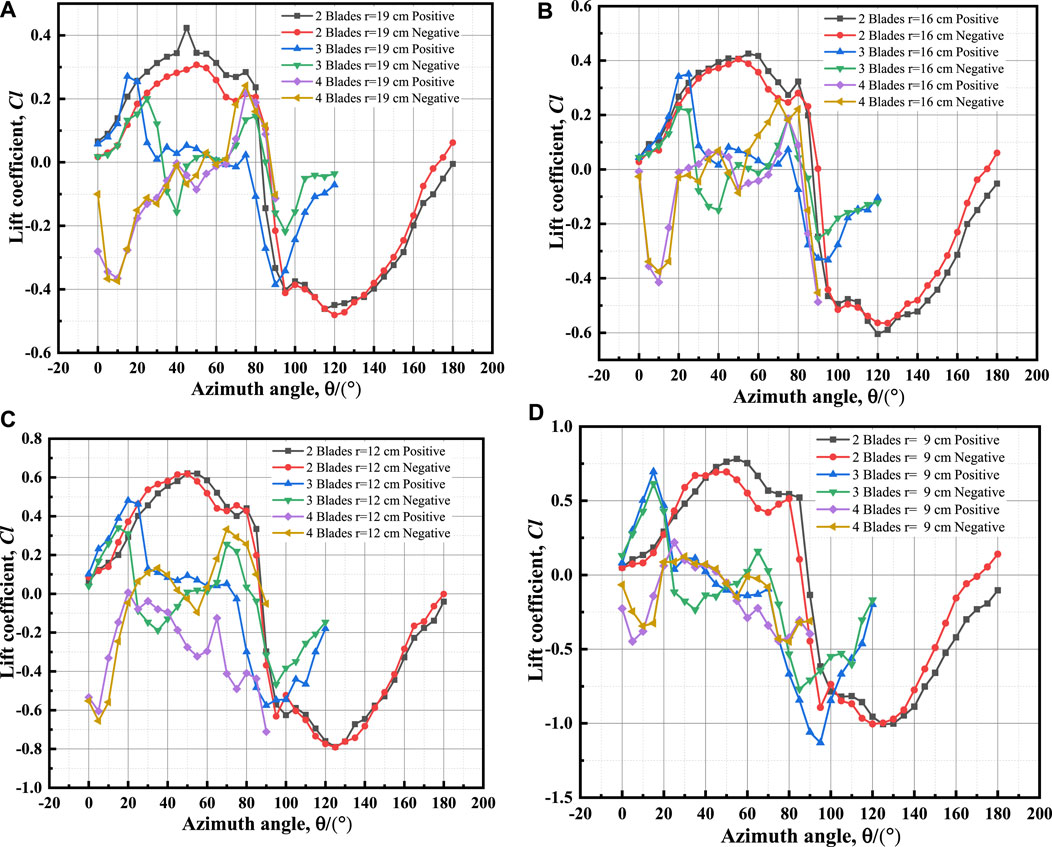
FIGURE 14. Lift coefficient curves of positive and negative installation of different blade numbers under the same radii: (A) r = 19 cm; (B) r = 16 cm; (C) r = 12 cm; (D) r = 9 cm.
Figures 14A–D demonstrate that for the same radius, the lift coefficient of a 2-blade device is greater than that of three and four blades, and the lift coefficient of positive installation is greater than that of negative installation. The smaller the radius, the greater the lift coefficient of the device will be under different blade numbers. In almost all azimuths, the absolute value of the lift coefficient in positive installation is greater than that in negative installation for the 2-blade device. There is little difference between the lift coefficients of positive and negative installation of a 2-blade device when the radius is 12 cm. For the 3-blade device, in the small azimuthal angle range (<60°), the lift coefficients of positive and negative installation differ little under various radii. When the azimuthal angle exceeds 60°, the lift coefficient of the negative installation exceeds that of the positive installation. This rule also applies to four blades, and the angle of change is 45° azimuth.
Based on Sections 4.1 and 4.2, the lift and drag data curves for wind turbines with different blade quantities clearly demonstrate mirrored symmetry for the drag curves, and central symmetry for the lift curves, as the lift direction changes. The device experiences a distinct symmetrical force along the incoming flow direction (drag) and perpendicular to it (lift). The drag curve for a 2-bladed turbine exhibits mirrored symmetry at a 90-degree azimuth angle, the 3-bladed turbine at a 60-degree azimuth angle, and the 4-bladed turbine at a 45-degree azimuth angle. Similarly, the lift also exhibits symmetry with the mentioned angles as the center. However, the mentioned symmetry is not strict, with slight differences. The reason for the aforementioned non-strict symmetry lies in the fact that the flow path from the leading edge to the trailing edge and from the trailing edge to the leading edge of the blade surfaces differs. For the static torque experienced by the device, it is necessarily generated by the forces acting on it. When the resulting forces already exhibit apparent symmetry at different azimuth angles, the static torque will inevitably possess symmetrical characteristics.
The static torque curves and static torque coefficient curves for positive and negative installation of the device under different radii and blade numbers are calculated based on the torque My measured by the balance. According to the mirror symmetry principle, only investigates the comparison of static torque magnitude under different blade structural parameter conditions within the first mirrored symmetric period. The static torque and static torque coefficient for a 2-blade device only need to be compared in the 90°azimuth range, for a 3-blade device only in the 60°azimuth range, and for a 4-blade device only in the 45°azimuth range. The curves are illustrated in Figure 15, Figure 16, Figure 17.
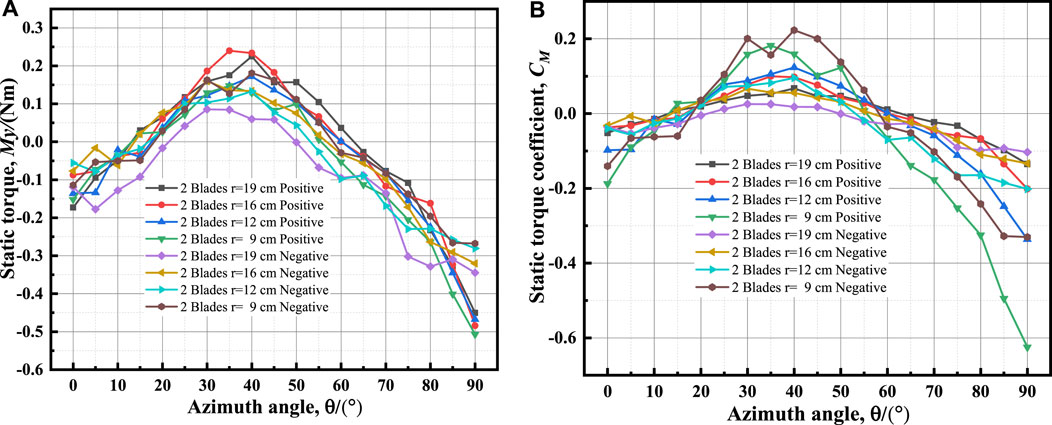
FIGURE 15. Curves of 2-blade device at different radii: (A) static torques; (B) static torque coefficients.
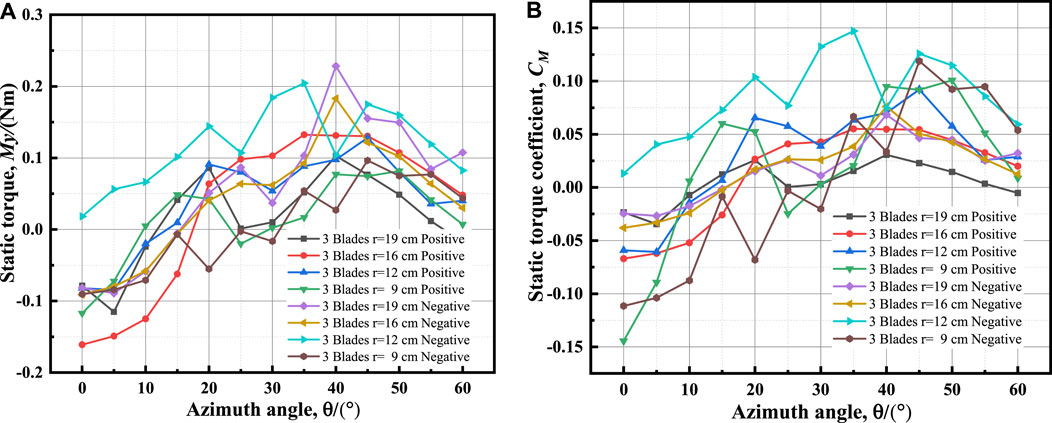
FIGURE 16. Curves of 3-blade device at different radii: (A) static torques; (B) static torque coefficients.
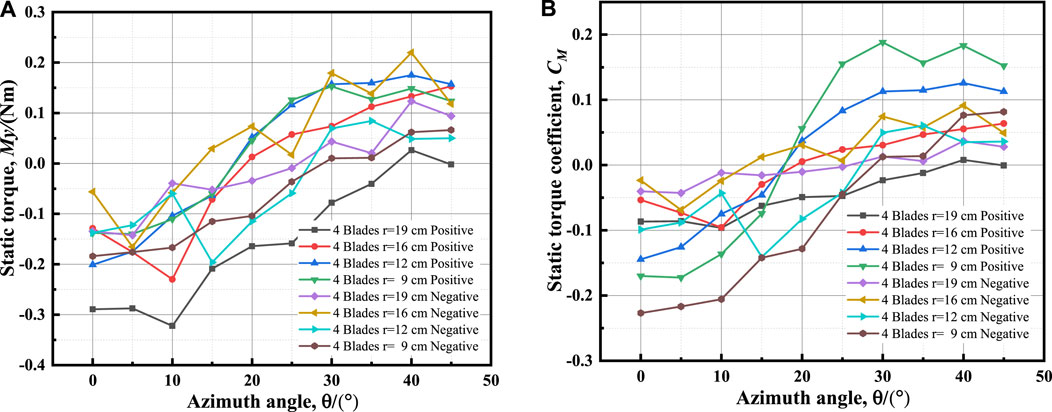
FIGURE 17. Curves of 4-blade device at different radii: (A) static torques; (B) static torque coefficients.
Figures 15–17 reveal that the maximum static torque and maximum static torque coefficient are related to an azimuthal angle range between 30° and 50°. The higher the blade installation radius, the greater the maximum static torque, and the smaller the maximum static torque coefficient. When the number of blades remains constant, the static torque coefficient increases as the radius decreases. For 2-blade wind turbines, the maximum static torque of positive installation is greater than that of negative installation, while for 3- blade and 4-blade wind turbines, the maximum static torque of negative installation is greater than that of positive installation.
The greater the radius and number of blades, the more noticeable the static torque coefficient fluctuation, indicating that the interference between blades is intensified and the resulting flow field is more complex.
Figures 18A–D illustrate the static torque coefficient curves of the wind turbine testing device when the blades are installed positively and negatively within the maximum static torque azimuth for the same radius and the different number of blades.
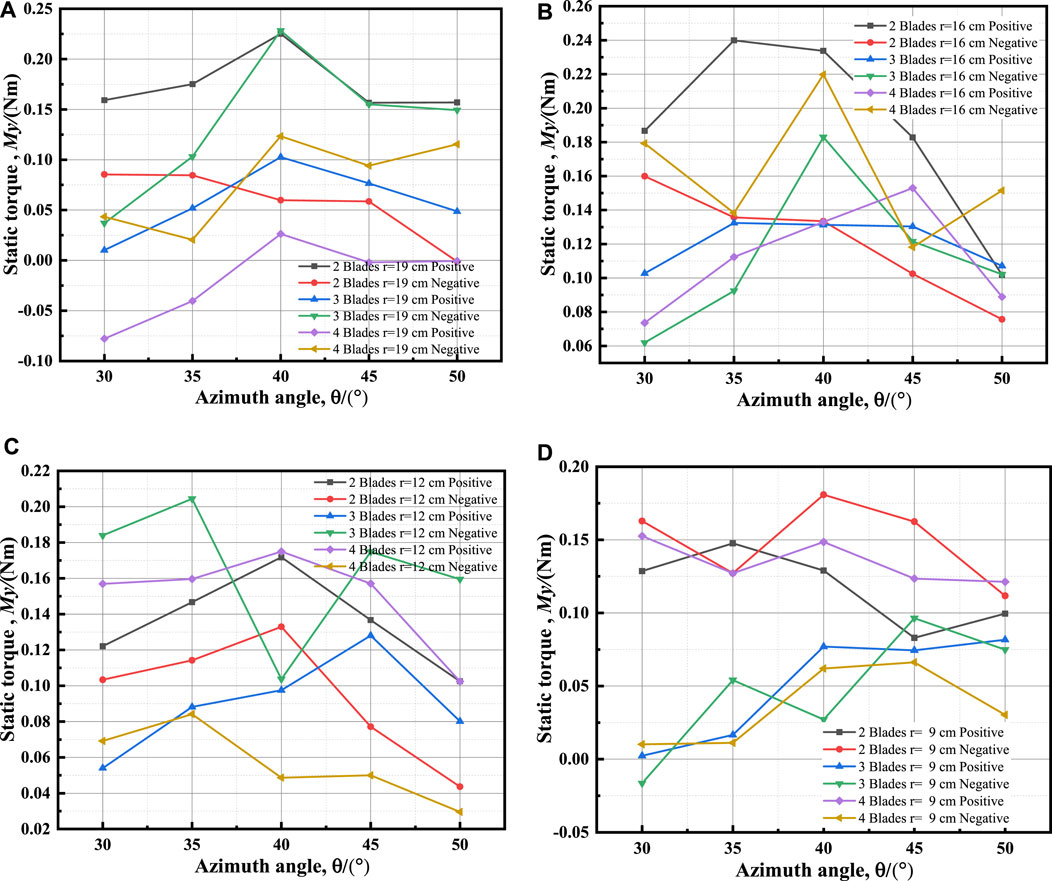
FIGURE 18. Static torque curves with different number of blades at the same radius: (A) r = 19 cm; (B) r = 16 cm; (C) r = 12 cm; (D) r = 9 cm.
It can be seen from Figures 18A–D that, for the same radius, as the number of blades increases, the static torque decreases gradually. It demonstrates that as the number of blades increases, the static torques generated by blades at different azimuths tend to cancel each other out.
When the radius r = 19 cm, the static torque of 2-blade device is relatively better than that of a 3- or 4-blade device under positive installation. Under negative installation, the static torque of 3-blade device is greater than that of a 4- or 2-blade device. A positively mounted 2-blade device obtains a large static torque across a wide range.
When the radius r = 16 cm, the static torque of a 2-blade device is relatively better than that of a 3- or 4-blade device under positive installation. Under negative installation, the static torque of a 4-blade device is better than that of a 2- or 3-blade device. A positively mounted 2-blade device obtains a large static torque across a wide range.
When the radius r = 12 cm, the static torques of a 2-blade and 4-blade device under positive installation are relatively greater than that those under negative installation. Under negative installation, the static torques of a 4-blade device are greater than that of a 2- or 3-blade device. A negatively mounted 3-blade device obtains a large static torque across a wide range.
To distinguish the static torques at different radii more clearly, the average forward and reverse static torques for different numbers of blades in the range of 30°-50° are calculated, and the average forward and reverse static torques for different radii are obtained as follows.
Figures 19A–C illustrate that the greatest mean static torque value is obtained at radius of r = 16 cm, indicating that forward and reverse static torque values are high at this radius with variable blade numbers. The average static torque value decreases as the radius increases from r = 16 cm, and the variance becomes smoother and smoother. At a radius of r = 19 cm, the average static torque value changes the most and is at the lowest level in a wide range.
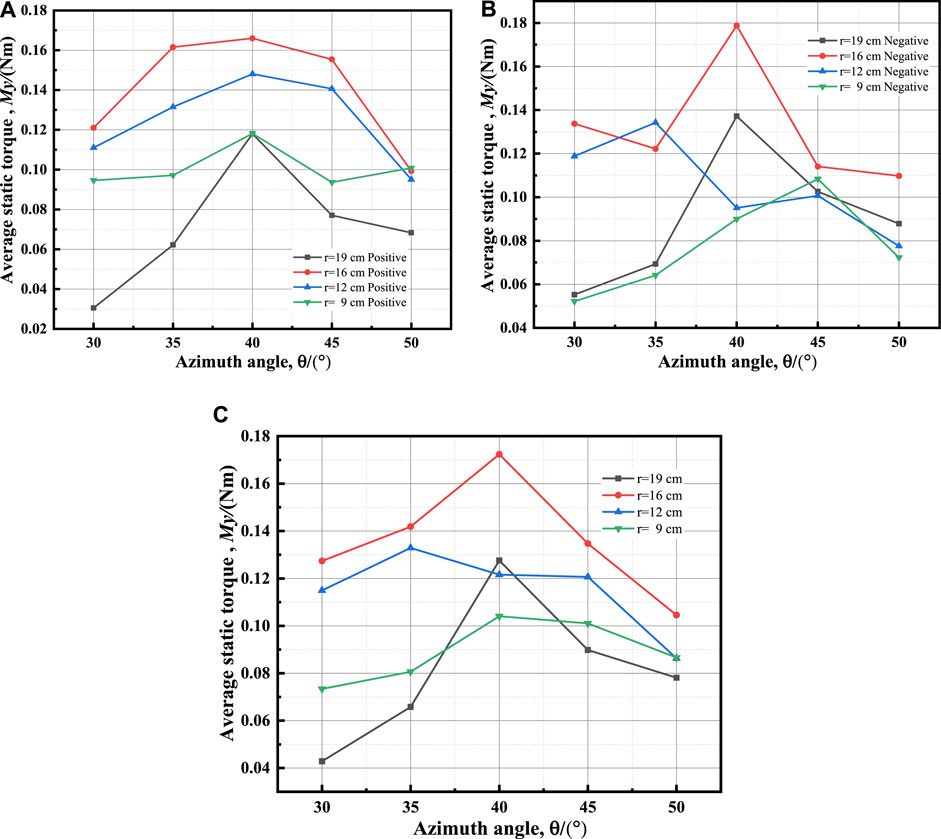
FIGURE 19. Average static torque curves with different radius: (A) positive; (B) negative; (C) average of positive and negative.
The test is conducted within a closed wind tunnel, where the airflow diffusion through the test device is constrained by the wind tunnel wall. This restriction impedes the outward movement of the flow lines, effectively reducing the airflow channel area between adjacent flow lines. Consequently, there is an increase in the average velocity of airflow between the test device and the tunnel wall, thereby accelerating the airflow through the device. During this test, the wind turbine device remains stationary, and under conditions of large diameter installation, the majority of the airflow traverses through the space between the blades. Only a small fraction of the airflow is impeded by the blades, preventing it from spreading outward. Upon evaluating the cross-sectional area of the wind tunnel test section and the maximum windward area of the device, the observed blockage is determined to be 4.29%, which falls within the acceptable range. However, it is crucial to acknowledge that the resulting increase in average flow velocity, comparable to test wind speed exceeding 10 m/s. However, within an acceptable range of wind tunnel blockage ratio, the diffusion of airflow is limited by the tunnel walls, resulting in a minimal increase in wind speed. This has equal effects on all measurement conditions and only leads to slight variations in the externally set wind speed parameters, without impacting the research conclusions.
During the test, the large motor of the wind tunnel consumes significant amount of energy, leading to slight variations in the electrical energy supplied by the power grid. To mitigate the impact of power fluctuations on the measurement instrument, it is advisable to separate the power source of the measuring system from the regulated power supply.
The test device in the flow field experiences slight vibrations caused by the force of airflow and the uneven wake, which can affect the measured data. To mitigate this impact, the test process involves continuous long-time measurements and data processing to obtain an average value, effectively eliminating the influence of vibrations. This error belongs to the random errors generated during the measurement process. The measurement system of this experiment measures 5000 sets of data per second, and the data processing software automatically calculates the average value of data every 5 s as a group of calculated data outputs. Under each measurement condition, the measurement is conducted for not less than 3 min, resulting in no less than 30 sets of output data. The average value is then calculated from the output data to eliminate the random errors in the measurement process. The heat generated by the wind tunnel motor, as well as the heat resulting from airflow friction circulating within the wind tunnel, causes the air temperature inside the tunnel to increase, which in turn affects the changes in air density. In the wind tunnel operating under closed-loop control at a constant wind speed, reducing the power of the wind tunnel motor decreases the overall kinetic energy of the airflow. Consequently, this reduction synchronously affects the force data obtained from balance measurement, leading to a tendency for drag, lift, and torque measurements to decrease. However, due to the large surface area of the wind tunnel body, heat dissipation occurs rapidly. Additionally, during the testing process, the replacement device paused operation, providing sufficient time for cooling. Therefore, as long as the wind tunnel is not operated continuously for an extended period, the rise in temperature remains minimal, resulting in minimal impact.
1) When the number of blades remains constant, the drag coefficient of a wind turbine increases as the radius decreases. When the radius remains the same, increasing the number of blades results in an increase in the drag coefficient, which exhibits periodic changes.
2) When the radius remains constant, an increase in the number of blades leads to an increase in the resistance coefficient, which undergoes periodic changes regardless of positive or negative installation. Furthermore, the resistance coefficient increases with a greater number of blades.
3) When the number of blades remains constant, the lift coefficients increase as the radius decreases. Under the same radius, the 2-blade device exhibits better lift coefficients compared to the 3-and 4-blade device. Additionally, the positive installation yields better lift coefficients than the negative installation.
4) With the same number of blades, the torque coefficients increase as the radius decreases. The torque coefficient of the 3-blade device is better than that of the 4-blade and 2-blade device when installed negatively.
5) The aerodynamic characteristics of wind turbines vary significantly with different numbers of blades. This indicates that altering the number of blades leads to distinct changes in the overall characteristics of the wind turbine, resulting in turbines with significantly different traits.
6) The maximum static torque and static torque coefficient azimuth range is between 30 and 50°. Setting the initial wind turbine azimuth within this range can facilitate the start-up of the wind turbine.
7) Compared with the results obtained by the CFD simulations, experimental measurements are influenced by numerous factors and exhibit complex variations in properties. Therefore, it is important to pay more attention to the complex effects arising from transient changes in the flow field during the test.
This paper focuses on the static aerodynamic characteristics of the SB-VAWT. In future studies, there are several aspects that can be further explored.
Based on this research, the blade mounting angle will be modified to achieve the ideal mounting angle and determine the best combination of blade mounting. In future experiments, the optimal combination of variables and blade airfoil shape for dynamic rotating characteristics should be investigated. It has been observed that a narrower range of AOA variation leads to improved aerodynamic performance under dynamic rotation conditions. Additionally, installing a wind turbine to study the maximum energy conversion efficiency under different wind speed and TSR conditions is crucial. The study also aims to explore the application of energy substitution efficiency in ships and enhance their emission reduction measures.
The original contributions presented in the study are included in the article/supplementary material, further inquiries can be directed to the corresponding author.
Conceptualization HZ and YH; methodology HZ; validation HZ and YH; formal analysis HZ; resources HZ and YH; data curation HZ; writing–original draft preparation HZ; writing–review and editing HZ and YH; visualization HZ; supervision YH; project administration YH; funding acquisition HZ and YH. All authors contributed to the article and approved the submitted version.
This research was funded by Shanghai Science and Technology Plan Funding Project (Grant No. 20DZ2252300).
The authors declare that the research was conducted in the absence of any commercial or financial relationships that could be construed as a potential conflict of interest.
All claims expressed in this article are solely those of the authors and do not necessarily represent those of their affiliated organizations, or those of the publisher, the editors and the reviewers. Any product that may be evaluated in this article, or claim that may be made by its manufacturer, is not guaranteed or endorsed by the publisher.
Aihara, A., Mendoza, V., Goude, A., and Bernhoff, H. (2022b). A numerical study of strut and tower influence on the performance of vertical axis wind turbines using computational fluid dynamics simulation. Wind Energy 25 (5), 897–913. doi:10.1002/we.2704
Aihara, A., Mendoza, V., Goude, A., and Bernhoff, H. (2022a). Comparison of three-dimensional numerical methods for modeling of strut effect on the performance of a vertical Axis wind turbine. Energies 15 (7), 2361. doi:10.3390/en15072361
Azadani, L. N., and Saleh, M. (2022). Effect of blade aspect ratio on the performance of a pair of vertical axis wind turbines. Ocean. Eng. 265, 112627. doi:10.1016/j.oceaneng.2022.112627
Bayram, A., Dhalwala, M., Oshkai, P., and Korobenko, A. (2022). Numerical simulations of a vertical-axis hydrokinetic turbine with different blade-strut configurations under free-surface effects. Eng. Comput. 39, 1041–1054. doi:10.1007/s00366-022-01758-8
Bošnjaković, M., Katinić, M., Santa, R., and Marić, D. (2022). Wind turbine technology trends. Appl. Sci. 12 (17), 8653. doi:10.3390/app12178653
Eltayesh, A., Castellani, F., Burlando, M., Bassily Hanna, M., Huzayyin, A. S., El-Batsh, H. M., et al. (2021). Experimental and numerical investigation of the effect of blade number on the aerodynamic performance of a small-scale horizontal axis wind turbine. Alexandria Eng. J. 60 (4), 3931–3944. doi:10.1016/j.aej.2021.02.048
Guevara, P., Rochester, P., and Vijayaraghavan, K. (2021). Optimization of active blade pitching of a vertical axis wind turbine using analytical and CFD based metamodel. J. Renew. Sustain. Energy 13 (2). doi:10.1063/5.0026591
Guo, X., Chen, Y., and Tian, R. (2022). Research on aerodynamic characteristics of a three-blade H-shaped vertical axis wind turbine with changing airfoil profile. Renew. Energy Resour. 40 (01), 73–78. doi:10.13941/j.cnki.21-1469/tk.2022.01.007
Hand, B., and Cashman, A. (2020). A review on the historical development of the lift-type vertical axis wind turbine: from onshore to offshore floating application. Sustain. Energy Technol. Assessments 38, 100646. doi:10.1016/j.seta.2020.100646
Hand, B., Kelly, G., and Cashman, A. (2021). Aerodynamic design and performance parameters of a lift-type vertical axis wind turbine: a comprehensive review. Renew. Sustain. Energy Rev. 139, 110699. doi:10.1016/j.rser.2020.110699
Hara, Y., Horita, N., Yoshida, S., Akimoto, H., and Sumi, T. (2019). Numerical analysis of effects of arms with different cross-sections on straight-bladed vertical Axis wind turbine. Energies 12 (11), 2106. doi:10.3390/en12112106
Hassan, S. S. u., Javaid, M. T., Rauf, U., Nasir, S., Shahzad, A., and Salamat, S. (2023). Systematic investigation of power enhancement of Vertical Axis Wind Turbines using bio-inspired leading edge tubercles. Energy 270, 126978. doi:10.1016/j.energy.2023.126978
Howell, R., Qin, N., Edwards, J., and Durrani, N. (2010). Wind tunnel and numerical study of a small vertical axis wind turbine. Renew. Energy 35 (2), 412–422. doi:10.1016/j.renene.2009.07.025
Huang, H., Wen, X., and Li, G. (2022). Influence of internal entity onaerodynamic performance ofh-type vertical axis wind turbine. ACTA ENERGIAE SOLARIS SIN. 43 (02). doi:10.19912/j.0254-0096.tynxb.2020-0232
Lei, H. (2019). Numerical simulation of the unsteady aerodynamic performance for vertical axis wind turbines. Ph.D. Thesis. Shanghai: Shanghai Jiao Tong University.
Li, Q. a., Takao, M., Yasunari, K., Junsuke, M., Kazuma, F., and Masayuki, Y. (2015). Effect of number of blades on aerodynamic forces on a straight-bladed Vertical Axis Wind Turbine. Energy 90 (2015), 784–795. doi:10.1016/j.energy.2015.07.115
Li, Y., Yang, S., Feng, F., and Tagawa, K. (2023). A review on numerical simulation based on CFD technology of aerodynamic characteristics of straight-bladed vertical axis wind turbines. Energy Rep. 9, 4360–4379. doi:10.1016/j.egyr.2023.03.082
Marsh, P., Ranmuthugala, D., Penesis, I., and Thomas, G. (2015). Three-dimensional numerical simulations of straight-bladed vertical axis tidal turbines investigating power output, torque ripple and mounting forces. Renew. Energy 83, 67–77. doi:10.1016/j.renene.2015.04.014
Miao, W., Liu, Q., Zhang, Q., Xu, Z., Li, C., Yue, M., et al. (2023). Recommendation for strut designs of vertical axis wind turbines: effects of strut profiles and connecting configurations on the aerodynamic performance. Energy Convers. Manag. 276, 116436. doi:10.1016/j.enconman.2022.116436
Migliore, P. G., Wolfe, W. P., and Fanucci, J. B. (1980). Flow curvature effects on Darrieus turbine blade aerodynamics. J. Energy 4 (2), 49–55. doi:10.2514/3.62459
Ni, L., Miao, W., and Li, C. (2022). Investigation of effect of gurney flap on performance of verticalaxis wind turbine in array configurations. Acta energiae solaris sin. 43 (02), 365–372. doi:10.19912/j.0254-0096.tynxb.2020-0217
Pan, P., Sun, Y., Yuan, C., Yan, X., and Tang, X. (2021). Research progress on ship power systems integrated with new energy sources: a review. Renew. Sustain. Energy Rev. 144, 111048. doi:10.1016/j.rser.2021.111048
Paraschivoiu, I. (2002). Wind turbine design: with emphasis on Darrieus concept. Presses inter Polytechnique.
Pietrykowski, K., Kasianantham, N., Ravi, D., Jan Gęca, M., Ramakrishnan, P., and Wendeker, M. (2023). Sustainable energy development technique of vertical axis wind turbine with variable swept area – an experimental investigation. Appl. Energy 329, 120262. doi:10.1016/j.apenergy.2022.120262
Rezaeiha, A., Kalkman, I., Montazeri, H., and Blocken, B. (2017). Effect of the shaft on the aerodynamic performance of urban vertical axis wind turbines. Energy Convers. Manag. 149, 616–630. doi:10.1016/j.enconman.2017.07.055
Rezaeiha, A., Montazeri, H., and Blocken, B. (2018). Characterization of aerodynamic performance of vertical axis wind turbines: impact of operational parameters. Energy Convers. Manag. 169, 45–77. doi:10.1016/j.enconman.2018.05.042
Siddiqui, M. S., Durrani, N., and Akhtar, I. (2015). Quantification of the effects of geometric approximations on the performance of a vertical axis wind turbine. Renew. Energy 74, 661–670. doi:10.1016/j.renene.2014.08.068
Stratan, G. S. M. v., Roy, S., Yam, K. S., and Lee, V. C. (2023). The influence of support arms on the performance of vertical axis wind turbines. Mater. Today Proc. 72, 514–523. doi:10.1016/j.matpr.2022.11.020
Strom, B., Johnson, N., and Polagye, B. (2018). Impact of blade mounting structures on cross-flow turbine performance. J. Renew. Sustain. Energy 10 (3). doi:10.1063/1.5025322
Sun, X., and Zhou, D. (2021). Review of numerical and experimental studies on flow characteristics around A straight-bladed vertical Axis wind turbine and its performance enhancement strategies. Archives Comput. Methods Eng. 29 (3), 1839–1874. doi:10.1007/s11831-021-09640-4
Tong, G., Li, Y., Tagawa, K., and Feng, F. (2023). Effects of blade airfoil chord length and rotor diameter on aerodynamic performance of straight-bladed vertical axis wind turbines by numerical simulation. Energy 265, 126325. doi:10.1016/j.energy.2022.126325
Villeneuve, T., Winckelmans, G., and Dumas, G. (2021). Increasing the efficiency of vertical-axis turbines through improved blade support structures. Renew. Energy 169, 1386–1401. doi:10.1016/j.renene.2021.01.092
Wang, Y., Shen, S., Li, G., Huang, D., and Zheng, Z. (2018). Investigation on aerodynamic performance of vertical axis wind turbine with different series airfoil shapes. Renew. Energy 126, 801–818. doi:10.1016/j.renene.2018.02.095
Wilberforce, T., and Alaswad, A. (2023). Performance analysis of a vertical axis wind turbine using computational fluid dynamics. Energy 263, 125892. doi:10.1016/j.energy.2022.125892
Wu, W., Pan, X., and Lin, Y. (2021). Optimized structure of a resistance type vertical axis wind turbine. Sci. Technol. Innovation 15, 134–137.
Xiang, H., and Sun, S. (2022). “Application of wind power generation technology in ships,” in 2022 IEEE Asia-Pacific Conference on Image Processing, Electronics and Computers (IPEC), Dalian, China, 14-16 April 2022.
Zeng, X., and Zhang, H. (2018). Experimental study of the aerodynamics of sail in natural wind. Pol. Marit. Res. 25 (98), 17–22. doi:10.2478/pomr-2018-0068
Zhang, H., and Hu, Y. (2020). Application and prospect of wind power generation technologies on ships. SHIP Eng. 42 (08), 1–6+22. doi:10.13788/j.cnki.cbgc.2020.08.01
Zhang, H., Hu, Y., and He, J. (2021). Wind tunnel experiment of multi-mode arc sail device. Pol. Marit. Res. 28 (4), 20–29. doi:10.2478/pomr-2021-0046
Zhang, L., Mi, Y., Zhao, X., Ma, D., Ma, W., Wang, H., et al. (2018a). Influence of aerodynamic parameters of vertical axis wind turbine on vibration effect of main shaft. J. Central South Univ. Sci. Technol. 49 (12), 3105–3112. doi:10.11817/j.issn.1672−7207.2018.12.025
Zhang, L., Zhu, K., Jiang, T., Zhang, L., Li, S., and Zhao, X. (2018b). Numerical investigations of the effect of rotating and non-rotating shaft on aerodynamic performance of small scale urban vertical axis wind turbines. J. Renew. Sustain. Energy 10 (4). doi:10.1063/1.5025078
Zhang, Y., Guo, Z., and Zhu, X. (2023). Effect of blade bracket on aerodynamic performance of straight-blade vertical axis wind turbine. J. Central South Univ. Technol. 54 (01), 341–351. doi:10.11817/j.issn.1672-7207.2023.01.031
Keywords: straight-bladed VAWT, static aerodynamic performance, wind tunnel experiments, wind power generation, static torque
Citation: Zhang H and Hu Y (2023) Wind tunnel experimental study on static aerodynamic performance of SB-VAWT without intermediate support axes. Front. Energy Res. 11:1252623. doi: 10.3389/fenrg.2023.1252623
Received: 04 July 2023; Accepted: 10 October 2023;
Published: 26 October 2023.
Edited by:
Xiao Hang Wang, Nanjing Vocational University of Industry Technology, ChinaReviewed by:
Mohammed Gwani, Kebbi State University of Science and Technology Aliero, NigeriaCopyright © 2023 Zhang and Hu. This is an open-access article distributed under the terms of the Creative Commons Attribution License (CC BY). The use, distribution or reproduction in other forums is permitted, provided the original author(s) and the copyright owner(s) are credited and that the original publication in this journal is cited, in accordance with accepted academic practice. No use, distribution or reproduction is permitted which does not comply with these terms.
*Correspondence: Yihuai Hu, eWhodUBzaG10dS5lZHUuY24=
Disclaimer: All claims expressed in this article are solely those of the authors and do not necessarily represent those of their affiliated organizations, or those of the publisher, the editors and the reviewers. Any product that may be evaluated in this article or claim that may be made by its manufacturer is not guaranteed or endorsed by the publisher.
Research integrity at Frontiers
Learn more about the work of our research integrity team to safeguard the quality of each article we publish.