 Qingsong Zhao1,2
 Hui Ma
- 1School of Electrical Engineering, Shenyang University of Technology, Shenyang, China
- 2Electric Power Science Research Institute, Liaoning Electric Power Co Ltd., Shenyang, China
- 3College of Electrical Engineering & New Energy, China Three Gorges University, Yichang, China
In order to solve the problem of there being a high proportion of wind and photovoltaic (PV) abandonment in the new energy system, an optimal dispatching method of concentrated solar power (CSP)–PV–wind hybrid power generation considering demand response is proposed. First, on the basis of the combination of wind and PV power stations and CSP stations, electric heating (EH) devices are used to convert unconsumed wind and PV power into thermal energy stored in the thermal storage system of the CSP station. Second, based on the difference in response time and response volume of customers, a stepped incentive-based demand response (IBDR) approach is introduced. Thus, a CSP–PV–wind power optimal dispatch model taking into account IBDR is established to achieve coordinated source-load dispatch. Finally, the CPLEX solver is invoked to optimize day-ahead scheduling with the goal of the lowest system comprehensive cost. Example analysis is used to confirm the proposed method’s usefulness in enhancing the system’s wind and PV power consumption capacity and reducing the system’s comprehensive cost.
1 Introduction
In the process of transforming China’s power system toward a cleaner power system, renewable energy, mainly wind and photovoltaic (PV) power, is taking an increasing share of the power system. Due to the constraints of the natural properties of wind and solar energy, wind and PV power generation are characterized by volatility and intermittency, and it is necessary to ensure the safe operation of the grid by abandoning wind and PV power. How to improve the grid’s ability to consume wind and PV power is still a hot issue (Peng et al., 2020; Guo et al., 2017; Xiong et al., 2022; Cui et al., 2019).
In order to solve the new energy consumption problem, the combined operation of wind and PV power generation with other energy sources can be considered. This has been studied by some scholars from several perspectives. Tan et al. (2020) proposed a scheduling method for the combined outward transmission of thermal, wind, and PV power, which improved the consumption of wind and PV power by changing the scheduling strategy. However, thermal power relies on fossil fuels and has low environmental benefits. In the work of Liu (2020), wind power, PV power, and pumped storage power were added as a combined power generation system, taking advantage of the complementary power output of each plant for scheduling optimization. However, the operation of a pumped storage power station is susceptible to geographical constraints. Concentrated solar power (CSP) plants can convert solar energy into thermal energy and store it in a thermal storage system. This feature makes it relevant for studying the combined power output of wind and PV power plants. In the work of Liu et al. (2019), two types of generation, CSP plants and PV plants, were combined as a joint dispatch strategy to derive the output of each plant and the heat storage and emission power of the PV plant. Pousinho et al. (2016) constructed a combined optimal scheduling strategy for wind power and CSP with energy storage, in which controllable reliability parameters are introduced and used for double-layer planning and scheduling, and the analysis verifies that considering CSP plants on the power side results in a certain improvement in the consumption of wind power. The above studies focus on the combined operation and dispatch of wind, PV power, and CSP, with each power station operating independently. Fewer studies have been conducted on the combined power generation system formed by these three power stations. In this paper, we consider linking various new energy generation stations by converting excess wind and PV power into thermal energy and injecting it into a CSP plant. The time-shifted characteristics of a CSP plant can be better utilized than conventional combined generation. When peak loads occur at times when wind generation is low, the CSP plant will use the stored thermal energy to generate electricity to make the most of its regulating properties and provide a more stable power output.
Most of the research on traditional multi-source coordinated scheduling focuses on single optimal scheduling on the load side or power side. Although this type of scheduling has certain advantages for new energy sources operating in the power system, the flexibility of its power output is more limited (Wang et al., 2023). The addition of load side demand response resource regulation can effectively improve the system’s flexibility and regularity. Ma et al. (2019) combined four types of plants for dispatch optimization based on the consideration of price-based demand response. However, the degree of customer response to time-of-use tariffs is fraught with uncertainty, often making it difficult to fully utilize demand side resources. In contrast, incentive-based demand response (IBDR) is more operational and attractive to customers (Liu et al., 2022). The subsidy amount of conventional IBDR is often based on a fixed standard, which is not conducive to the motivation of customers as they have little choice. This paper divides the subsidy response criteria into periods of time and also proposes a stepped-type unit subsidy amount based on the difference in customers’ response volume to provide more response options for customers. The key contributions of this work are as follows:
1) The architecture and implementation procedure of a combined power system linking wind farm, PV plant, and CSP are described, as well as the role of the electric heating (EH) device and the thermal energy storage (TES). The CSP–PV–wind hybrid power generation system offers better regularity than single new energy generation stations.
2) We consider adding IBDR on the load side and, on the basis of the conventional IBDR, divide the subsidy standard according to the different periods and establish a stepped-type subsidy incentive mechanism according to the customer’s response volume so as to realize coordinated dispatching on both sides of the source and load and enhance the system’s wind and PV consumption capacities.
3) Three combinations of units are set up for day-ahead scheduling at the optimal comprehensive system cost, and the effectiveness of the proposed method is verified through CPLEX software simulations. In addition, two separate comparison models are set up to verify the superiority of the proposed IBDR method compared to conventional IBDR.
The remainder of this paper is structured as follows: Section 2 explains the architecture of the hybrid power generation system, Section 3 models the IBDR component and describes the specific subsidy strategy, and Section 4 models day-ahead scheduling of the hybrid power generation system. Section 5 summarizes the case study data and results, and Section 6 comprises the conclusion.
2 Hybrid power generation system
2.1 Principle of the hybrid power generation system
A CSP plant consists of a solar field (SF), a thermal energy storage (TES), and a power block (PB). The heat transfer fluid (HTF) is used to transfer energy between the three components. The SF in the CSP plant absorbs solar thermal energy and then uses heat transfer equipment to heat the HTF. Part of this heat is transferred to the steam turbine in the PB, and the remainder is stored in the TES, which then releases heat energy to the PB through the HTF when needed. The TES provides some flexibility in the use of solar energy, while the steam turbine unit in the PB is similar to a conventional thermal power unit, providing system back-up resources and enabling the CSP plant to have fast regulation capabilities (Cui et al., 2020a; Sun et al., 2023; Che et al., 2019).
CSP plants have good dispatch ability, and for wind and PV power generation with high output volatility, the combination with CSP plants can effectively improve their output stability. In order to transfer the excess power generated by wind and PV plants into the CSP plant for storage, an electrical heater is now installed on the CSP plant side; the HTF in the TES not only absorbs the heat collected by the SF of the CSP plant but also absorbs the heat energy converted by EH, thus realizing the storage process of electricity to heat. Figure 1 shows a schematic diagram of the structure of the CSP–PV–wind hybrid power generation system.

FIGURE 1. Schematic diagram of the hybrid power generation system.
When the wind and PV power output are higher than the load, the unconsumed power generation will be stored in the TES in the form of thermal energy through EH; when the wind and PV power output are lower than the load, the stored thermal energy will be transported to the PB for power generation, which will smooth out the fluctuation of the wind power output, which will directly improve the wind and PV power consumption capacities.
In the conventional multi-source combined operation, each proportional power station operates separately and is dispatched together. The addition of the electricity to heat link in the CSP–PV–wind hybrid power generation system enables the CSP plant’s TES to better perform its energy storage function while making fuller use of the complementary characteristics of the wind and PV resources (Cui et al., 2020b).
2.2 Uncertainty expression of the output of the wind and PV equations
Wind and PV power generation are volatile and stochastic in nature; their forecast errors should be taken into account in the analysis. Most of the studies on optimal operation express the actual output of both by the sum of the determined prediction value and the uncertain prediction error, and the normal distribution, t-distribution, and generalized Gaussian mixture distribution model are usually used to describe the output prediction error of wind power and PV power generation. In this paper, the Gaussian distribution formula is used to describe the prediction error of wind power and PV power generation. The actual output should be the sum of the definite forecast value and the uncertain forecast error calculated as follows (Ma et al., 2016):
where
where
3 Stepped-type incentive-based demand response
Implementing demand response measures on the load side to guide customers to change their electricity consumption plans has become an important tool for power companies to promote the consumption of new energy and maintain the stability of the power supply (Wei et al., 2021; Han et al., 2023). The effectiveness of IBDR is closely related to the amount of subsidy provided to customers in the compensation contract.
Conventional IBDR has a fixed price for customers’ response subsidies. To better motivate customers to participate, this work takes into account differences in response time and response volume when setting the IBDR subsidy unit price, with separating calculations for both high and low load periods (Zhou et al., 2023; Xu et al., 2021).
With the method designed to increase the consumption of wind and PV power, the unit price of the subsidy for customer response is raised to a higher level than that of the peak load hours during the low load hours, which are prone to the abandonment of new energy power so as to guide the customers to participate in the response to a greater extent during the low-load hours. Different from the traditional fixed compensation unit price, as the user response volume increases, the compensation unit price is also stepped up, so the final subsidy amount is higher than the fixed subsidy unit price, and the incentive effect on the customer is stronger. The stepped-type IBDR scheme gives customers more choices and promotes IBDR results that are more in line with dispatch needs.
The IBDR proposed in this paper is divided into two types of subsidy price setting for customers: load downward peak shaving and load upward valley filling, each with a different subsidy price increase scheme. The IBDR load type in this paper refers specifically to transferable load, and the compensation costs include electricity subsidy and capacity subsidy, with the capacity subsidy being a fixed value.
Subsidy price adjustments are related to net load increments. First, the net load increment needs to be calculated as follows:
where
When
where
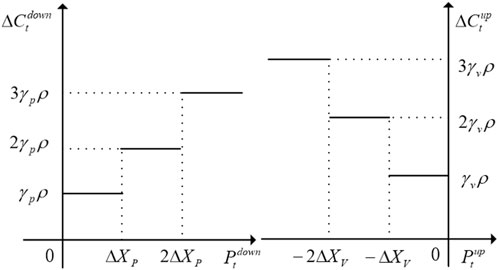
FIGURE 2. Step - type incentive price adjustment.
where
The reimbursement costs for a particular user are modeled as follows:
where
4 Scheduling model of hybrid power generation system nomenclature
4.1 Objective function
The objective function of the day-ahead scheduling optimization model is primarily considered in terms of the economics of the system and ultimately consists of the summation of four different cost functions, and the optimization objective is expressed as the minimum of the integrated cost of the system as follows:
where
4.2 Constraints
1) Power balance constraint
Ignoring transmission network losses, the hybrid power generation system needs to be grid-tied to achieve power balance, and the power transmitted by thermal, wind power, CSP, and PV needs to be equal to the load power and electric heating power after the response at each moment.
where
2) Operating constraints for thermal power units
Thermal power unit output and start/stop operating constraints are modeled as follows:
where
Ramp rate constraints for thermal power units are modeled as follows:
where
3) Wind power and PV output constraints
During the joint system dispatch, the grid-connected power of wind and PV must not be greater than their forecast power, with the following constraints:
where
4) CSP plant-related constraints
There is a certain heat loss when heat is exchanged between the TES and HTF, and the heat charging and discharging power of the TES are modeled as follows:
where
The TES has certain heat losses of its own, which are reflected in the energy storage equation of state.
where
In order to ensure that the CSP plant has sufficient regulation capacity, the TES has capacity limit, which is modeled as follows:
where
5) Demand response constraints
The segmentation constraint on the volume of user response is modeled as follows:
where at this point in the eth interval of the segmented offer curve,
The response capacity constraint for the load aggregator is modeled as follows:
where
Load shifting needs to be limited in terms of time periods; otherwise, there will be frequent start-ups and stoppages of equipment. There should, therefore, be a minimum interruption time constraint.
where
5 Example analysis
5.1 Basic data
In this paper, a double-fed 300 MW wind farm, a 100 MW PV plant, a 100 MW CSP plant, and three thermal power units are used to form a CSP–PV–wind hybrid power generation system. The wind and PV output data are from the measured data of a 300 MW wind farm and a 100 MW PV plant in Northwest China on a typical day in July 2020, and the DNI data are from SAM, a CSP plant simulation software developed by the National Renewable Energy Laboratory. The predicted power and DNI of wind power, PV, and load are shown in Figure 3, the relevant parameters of the CSP plant are shown in Table 1, and the relevant data of the thermal power units are shown in Table 2. The maximum feed-in power of the wind farm, PV plant, and CSP plant is 350 MW, 150 MW, and 150 MW, respectively.
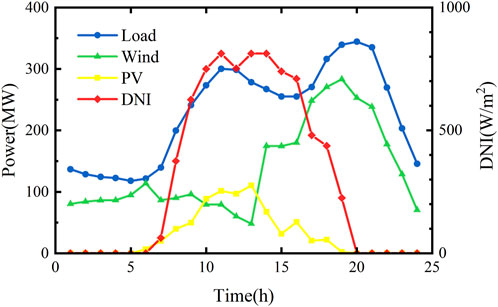
FIGURE 3. Wind power, PV, load forecast base power and DNI index.

TABLE 1. Main parameters of the 100 MW CSP plant.
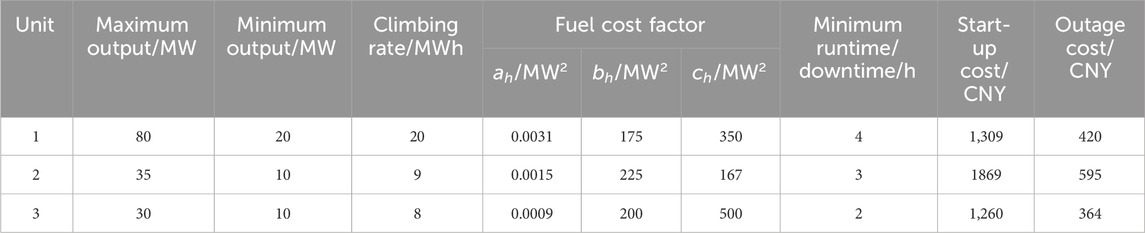
TABLE 2. Relevant data of the thermal power units.
Operation and maintenance cost factors
There are two load aggregators A and B participating in the IBDR, with
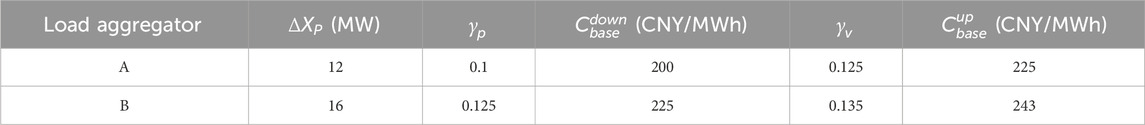
TABLE 3. IBDR-related parameters.
The algorithms in this paper are optimized using MATLAB software by calling CPLEX via the YALMIP toolkit (Ma et al., 2023; Ma et al., 2021; Yang et al., 2022). All the scheduling is day-ahead scheduling.
5.2 Analysis of optimization results
5.2.1 Day-ahead dispatching result analysis
In order to verify the effectiveness of the proposed dispatch model in promoting wind and PV consumption and reducing the comprehensive cost, three comparison cases were set up:
Case 1:. conventional thermal, wind, and PV power generation day-ahead dispatch model, neither considering IBDR nor using a hybrid power generation system that incorporates a CSP plant, where two 100 MW PV plants are used.
Case 2:. A 100 MW PV plant is replaced by a 100 MW CSP plant in a conventional thermal, wind, and PV power generation to form a hybrid power generation system but without using IBDR on the load side.
Case 3:. A hybrid power generation system using the consideration of a stepped-type IBDR strategy and a CSP plant joining.
In the example, the wind, PV, load, and DNI shown in Figure 3 are used as the base data, and all three cases are optimized with the objective of optimizing the overall cost. The three subplots (A),(B), and (C) in Figure 4 show the day-ahead scheduling results for cases 1, 2, and 3 from left to right, respectively. Figure 5 and Figure 6 show the comparison of wind and PV power abandonment for the three cases, respectively. The comprehensive cost of the three cases and the amount of electricity abandoned by wind and PV power are shown in Table 4.
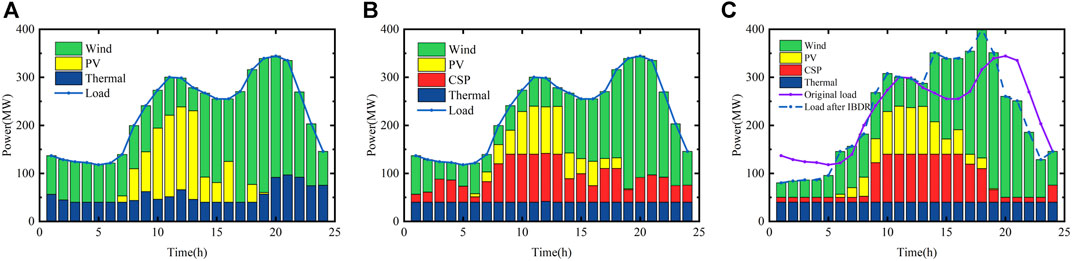
FIGURE 4. Day-ahead scheduling results for three cases.
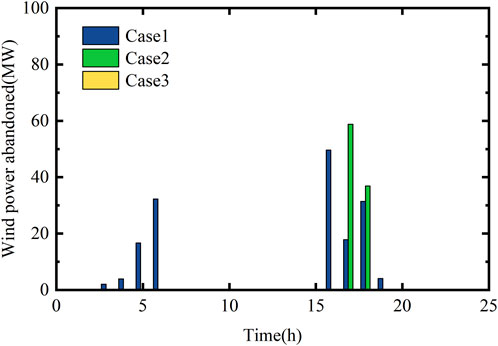
FIGURE 5. The results of the wind power abandoned.

FIGURE 6. The results of the PV power abandoned.
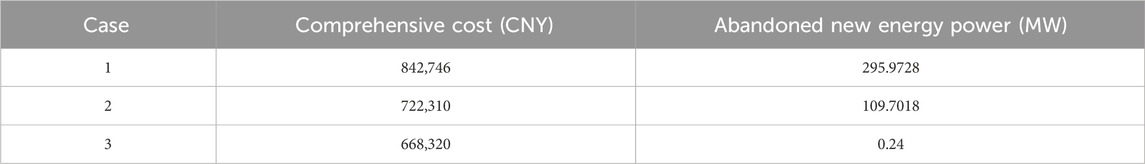
TABLE 4. Comparison of the day-ahead scheduling results.
Combining Figures 3, 4, 5, and 6, it can be seen that when demand response is not implemented, the load demand is low around 5:00 h, resulting in wind power abandonment. Case 1 uses two 100 MW PV plants with high PV generation and no thermal storage. As the solar radiation index increases between 6:00 and 19:00 h, the PV output increases, resulting in severe PV power abandonment. To enable a clearer comparison of the effectiveness of each unit combination in enhancing wind and PV consumption capacities, the amount of wind and PV power abandoned by each unit combination is compared. In addition, in order to verify the effectiveness of the TES of the CSP plant introduced in this paper in enhancing the new energy consumption capacity of the system, the charging and discharging of the TES in cases 2 and 3 are analyzed. Figure 7 shows the electric to thermal power of EH in cases 2 and 3 at each moment. The two subplots (A) and (B) in Figure 8 show, from left to right, the heat charging and discharging and the total heat storage capacity of the TES of the CSP plant in cases 2 and 3 at each moment in time, respectively.
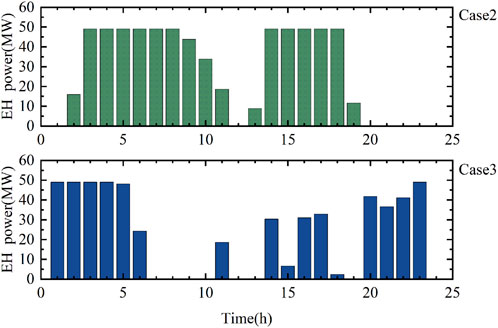
FIGURE 7. Comparison of EH device power between Case 2 and Case 3.
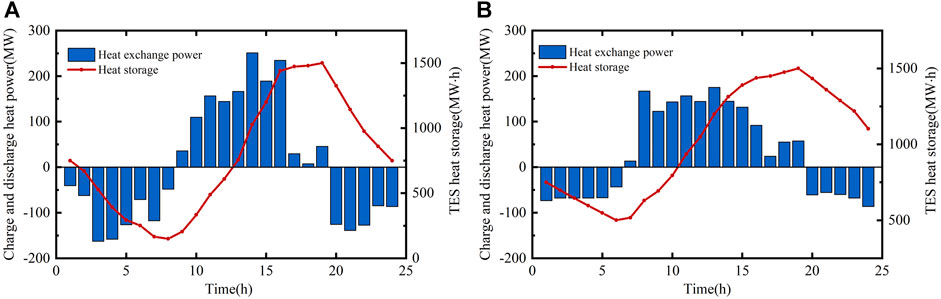
FIGURE 8. Changes in the heat storage capacity in Cases 2 and 3.
While the CSP plant converts the solar energy collected by the SF into thermal energy, the EH device can simultaneously convert the wind and PV power unconsumed energy into thermal energy and deposit it together in the TES. Combined with Figure 4 and Figures 7 and 8, it can be seen that from 1:00 to 6:00 h, there is no solar energy, and the TES exerts heat through the HTF. The CSP plant generates power, and at the same time, the excess wind power is subjected to electric-to-thermal treatment, but the charging heat power is still lower than the exothermic power. After 6:00 h, the PV power generation climbs, and the TES then reduces the exothermic heat until it turns to the charging heat state, during which EH continues to work. At 16:00, the heat storage of the system is about to reach its peak, and the solar-to-heat power decreases significantly. At sunset, the solar value tends to be zero, and the TES enters the exothermic state again, maintaining the CSP plant’s continuous output. From the analysis shown in Figure 5 and Figure 6, we can see that with the addition of the CSP plant and EH in case 2, through the electricity-to-heat mechanism of EH, the significant level of abandoned PV power from 6:00 to 19:00 is effectively suppressed, and the abandoned wind power at around 5:00 is also stored in the TES through EH, and the overall abandoned wind and PV power are significantly reduced by 63%, which indicates that the addition of the CSP plant in the dispatch case can effectively improve the amount of wind and PV power consumption. From the data shown in Table 4, it can be seen that case 2 adds the CSP power plant assembled with EH on the basis of thermal, wind, and PV power generation in case 1, and the comprehensive cost of the system is reduced by 14%, which verifies that the hybrid power generation system also has certain advantages in economy. However, at 17:00–18:00, the heat storage capacity of the TES has reached a higher value, and it is unable to consume more of the excess abandoned wind and PV power, thus resulting in a partially high amount of abandoned wind power.
To address this phenomenon, a stepped-type IBDR mechanism is introduced in case 3 to integrate the load profile. The load profile of case 3 shown in Figure 8 is adjusted for IBDR, and the load demand decreases between 0:00–5:00 and 20:00–23:00, resulting in a decrease in the CSP plant’s own output compared to case 2 and a solar increase in the amount of abandoned wind power converted by EH. Load filling is carried out at 14:00–19:00, when the wind power output is high, and wind and PV power generation drop sharply at 20:00–24:00, when the load curve is shaved, which again reduces the new energy power abandonment by 37% based on case 2. As can be seen from the data shown in Table 4, case 3 introduces a stepped-type IBDR scheme on the load side on the basis of case 2, and the comprehensive dispatch cost is again 8% lower than that of case 2, realizing the double minimum of new energy power abandonment and comprehensive cost, which verifies that the stepped-type IBDR scheme and the hybrid power generation system proposed in this paper have certain effectiveness in reducing the comprehensive cost of the system and increasing the capacity of wind power and PV power consumption.
5.2.2 IBDR comparative case analysis
To verify the effectiveness of the stepped-type IBDR scheme proposed in this paper, additional cases 4 and 5 are added.
Case 4:. Based on case 3, the IBDR added is modified to leave the subsidy criteria unchanged for load shedding periods, and the values of
Case 5:. Based on case 3, the IBDR added is modified to change the values of
That is, the load aggregators A and B have
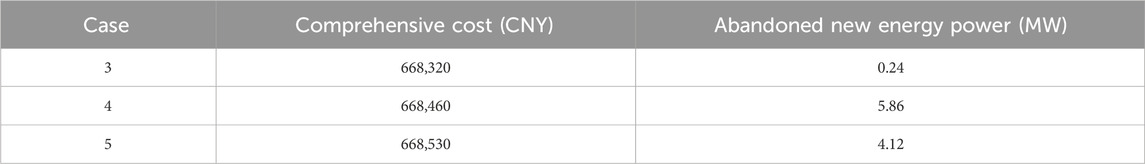
TABLE 5. Comparison of the day-ahead scheduling results.
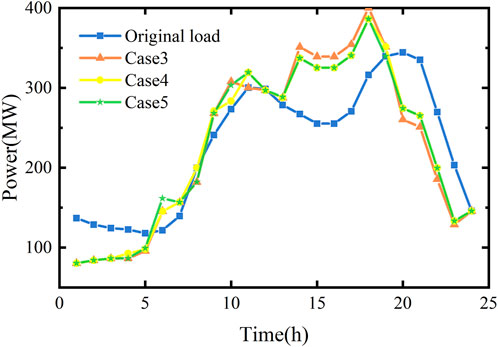
FIGURE 9. Comparison between the original load and the load after IBDR in each case.
As can be seen from Table 5, the conventional IBDR system is used in cases 4 and 5, the comprehensive cost of the system has increased compared to case 3, and the amount of new energy abandoned has also increased, verifying the superiority of the stepped-type IBDR system proposed in this paper, which uses different subsidy standards at different times.
The comparative analysis of the above calculations verifies the effectiveness of the optimization model using the stepped-type IBDR on the load side and a hybrid power generation system on the source side in promoting the consumption of wind and PV power and improving system economics.
6 Conclusion
In this paper, wind farms and PV plants are combined with the CSP plant through EH to establish an optimal dispatch model for the hybrid power generation system while implementing the stepped IBDR on the load side to change the load curve and achieve coordinated dispatch between the load side and the source side, and the following conclusions are drawn from the analysis of the results of the calculation cases:
1) In contrast to the traditional way of operating between new energy power stations, the integration of the TES of the CSP power station and the wind and PV power stations through the electricity-to-heat link can make full use of the energy time-shifting characteristics of the CSP power station. This provides an effective way to utilize wind and PV abandonment while increasing the scheduling flexibility of the CSP plant itself.
2) By providing compensation to change the way customers use electricity, IBDR can modify the load curve when the difference between the predicted power output and the load curve is too large. IBDR with different subsidy standards set at different times can make the load curve more closely match the demand. The IBDR scheme proposed in this paper can be realized by only making modifications to the traditional IBDR scheme, but only the increase and reduction of customer loads are considered, and increasing the type of demand response will be the focus of the next research.
3) The conventional generation model has a comprehensive cost of 842,746 CNY, while the hybrid power generation model proposed in this paper reduces the comprehensive cost by 14%. After adding the IBDR mechanism in this paper, the comprehensive cost is reduced by another 8%, while the abandoned energy rate is reduced by 37%, which shows that the optimization method proposed in this paper is effective in improving the system’s ability to consume new energy and reducing the comprehensive cost.
Data availability statement
The original contributions presented in the study are included in the article/Supplementary Material; further inquiries can be directed to the corresponding author.
Author contributions
QZ: writing–review and editing, methodology, conceptualization, and formal analysis. BY: writing–original draft, data curation, formal analysis, investigation, and software. HM: writing–original draft, supervision, validation, and software. GL: writing–review and editing, project administration, validation, and resources. JX: writing–review and editing, supervision, funding acquisition, and visualization.
Funding
The authors declare financial support was received for the research, authorship, and/or publication of this article. This work was supported by the National Natural Science Foundation of China (No. 52107108).
Conflict of interest
Authors QZ and GL were employed by Liaoning Electric Power Co Ltd.
The remaining authors declare that the research was conducted in the absence of any commercial or financial relationships that could be construed as a potential conflict of interest.
Publisher’s note
All claims expressed in this article are solely those of the authors and do not necessarily represent those of their affiliated organizations, or those of the publisher, the editors, and the reviewers. Any product that may be evaluated in this article, or claim that may be made by its manufacturer, is not guaranteed or endorsed by the publisher.
References
Che, Q., Lou, S., and Wu, Y. (2019). Economical dispatching of thermal power stations with thermal storage and wind power system considering conditional value at risk. Trans. China Electr. Tech. Soc. 34 (10), 2047–2055. doi:10.19595/j.cnki.1000-6753.tces.181958
Cui, Y., Yang, Z., Zhang, J., Wang, M., and Yan, Q. (2019). Wind Power,PV and solar thermal combined output scheduling Strategy considering comprehensive cost. High. Volt. Technol. 45 (01), 269–275. doi:10.13336/j.1003-6520.hve.20181229026
Cui, Y., Zhang, H., Zhong, W., Zhao, Y., Zhang, J., and Wang, M. (2020a). Multi-source Optimal Scheduling for high permeability power system with renewable energy based on Demand Response. High. Volt. Technol. 46 (05), 1486–1496. doi:10.13336/j.1003-6520.hve.20200515003
Cui, Y., Zhang, J., Wang, Z., Wang, T., and Zhao, Y. (2020b). Day-ahead Scheduling Strategy for wind-solar-thermal combined power generation System with Price based Demand response. Proc. CSEE 40 (10), 3103–3114. doi:10.13334/j.0258-8013.pcsee.191388
Guo, P., Wen, J., Zhu, D. D., Wang, W., and Liu, W. (2017). Coordinated control strategy for large-scale wind power consumption based on source-charge interaction. Trans. China Electr. Tech. Soc. 32 (03), 1–9. doi:10.19595/j.cnki.1000-6753.tces.2017.03.001
Han, G., Li, X., Xu, J., Liao, S., and Wu, Y. (2023). Environmental economic scheduling of typical industrial loads with demand response. Automation Electr. Power Syst. 47 (08), 109–119. doi:10.7500/AEPS20220504011
Liu, H., Zhai, R., Fu, J., Wang, Y., and Yang, Y. (2019). Optimization study of thermal-storage PV-CSP integrated system based on GA-PSO algorithm. Sol. Energy 184, 391–409. doi:10.7500/AEPS20220106001
Liu, Q. (2020). Study on optimization of combined operation of wind and PV pumped storage based on multi-objective planning. Shenyang: Shenyang Engineering College.
Liu, W., Yao, Q., Wang, Y., Chen, L., and Lu, Y. (2022). Power supply planning model of supply-demand master-slave game based on stepped demand response mechanism. Automation Electr. Power Syst. 46 (20), 54–63. doi:10.7500/AEPS20220106001
Ma, G., Cai, Z., and Liu, P. (2019). Power capacity optimization of micro-grid with multiple subjects considering price incentive demand response. Electr. Power Autom. Equip. 39 (5), 96–102+108. doi:10.16081/j.issn.1006-6047.2019.05.014
Ma, H., Pan, Y., Lu, Y., Chen, X., and Huang, Y. (2023). Research on single-phase three-level pseudo totem-Pole rectifiers with a unified pulsewidth modulation. IEEE J. Emerg. Sel. Top. Power Electron. 11 (5), 5052–5061. doi:10.1109/jestpe.2023.3298144
Ma, H., Zheng, K., Jiang, H., and Yin, H. (2021). A family of dual-boost bridgeless five-level rectifiers with common-core inductors. IEEE Trans. Power Electron. 36 (11), 12565–12578. doi:10.1109/tpel.2021.3078533
Ma, Y., Fan, Z., Liu, W., and Zhao, S. (2016). Environmental economic dispatching considering the randomness of carbon trading and wind load prediction errors. Power Syst. Technol. 40 (02), 412–418. doi:10.13335/j.1000-3673.pst.2016.02.012
Peng, Y., Zhou, R., Li, B., Fang, Z., Xu, J., Wang, Y., et al. (2020). Two-stage optimal dispatch of PV-WindThermal virtual power plant considering the characteristics of solar thermal power generation. Power Syst. automation 32 (04), 21–28.doi:10.19635/j.cnki.csu-epsa.000315
Pousinho, H. M. I., Esteve, J., Mendes, V. M. F., Collares-Pereira, M., and Pereira Cabrita, C. (2016). Bilevel approach to wind-CSP day-ahead scheduling with spinning reserve under controllable degree of trust. Renew. Energy 85, 917–927. doi:10.1016/j.renene.2015.07.022
Sun, K., Zhao, S., and Li, Z. (2023). Research on joint optimization operation of wind power, PV and CSP generation system. Beijing: Journal of North China Electric Power University, 1–12.
Tan, Q., Ding, Y., Li, Y., and Li, R. (2020). Multi-objective optimization of combined windsolar-thermal power Dispatching strategy considering economic-environmental equilibrium. Electr. Power Constr. 41 (08), 129–136. doi:10.12204/j.issn.1000-7229.2020.08.015
Wang, C., Chu, S., Ying, Y., Wang, A., Chen, R., Xu, H., et al. (2023). Underfrequency load shedding scheme for islanded microgrids considering objective and subjective weight of loads. IEEE Trans. Smart Grid 14 (2), 899–913. doi:10.1109/tsg.2022.3203172
Wei, Z., Zhang, H., Wei, P., Liang, Z., Ma, X., and Sun, Z. (2021). Two-stage optimal scheduling of micro-grid considering dynamic excitation demand response. Power Syst. Prot. Control 49 (19), 1–10. doi:10.19783/j.cnki.pspc.201605
Xiong, W., Ma, Z., Zhang, X., Wang, K., Zhou, Q., and Chen, W. (2022). Optimization of two-layer scheduling of Wind-PV complementary power generation considering wind and PV absorption. J. Sol. Energy 43 (07), 39–48. doi:10.19912/j.0254-0096.tynxb.2020-1146
Xu, H., Lu, J., Yang, Z., Li, Y., Lu, J., Huang, H., et al. (2021). Decision optimization model of incentive demand response based on deep reinforcement learning. Automation Electr. Power Syst. 45 (14), 97–103. doi:10.7500/AEPS20200208001
Yang, N., Yang, C., Wu, L., Shen, X., Jia, J., Li, Z., et al. (2022). Intelligent data-driven decision-making method for dynamic multi-sequence: an E-Seq2Seq-based SCUC expert system. IEEE Trans. Industrial Inf. 18 (5), 3126–3137. doi:10.1109/tii.2021.3107406
Keywords: new energy consumption, demand response, comprehensive cost, CSP, hybrid power generation system
Citation: Zhao Q, Yang B, Ma H, Liu G and Xu J (2024) Optimal scheduling of the CSP–PV–wind hybrid power generation system considering demand response. Front. Energy Res. 11:1252311. doi: 10.3389/fenrg.2023.1252311
Received: 25 July 2023; Accepted: 30 December 2023;
Published: 24 January 2024.
Edited by:
Paweł Ziemba, University of Szczecin, PolandReviewed by:
Alae Azouzoute, Mohamed Premier University, MoroccoJianpei Han, Tsinghua University, China
Copyright © 2024 Zhao, Yang, Ma, Liu and Xu. This is an open-access article distributed under the terms of the Creative Commons Attribution License (CC BY). The use, distribution or reproduction in other forums is permitted, provided the original author(s) and the copyright owner(s) are credited and that the original publication in this journal is cited, in accordance with accepted academic practice. No use, distribution or reproduction is permitted which does not comply with these terms.
*Correspondence: Beijia Yang, bWFodWl6ejExOUAxMjYuY29t