 Donglai Tang
 Qiang Li2
95% of researchers rate our articles as excellent or good
Learn more about the work of our research integrity team to safeguard the quality of each article we publish.
Find out more
ORIGINAL RESEARCH article
Front. Energy Res. , 25 August 2023
Sec. Sustainable Energy Systems
Volume 11 - 2023 | https://doi.org/10.3389/fenrg.2023.1250717
This article is part of the Research Topic Smart Energy System for Carbon Reduction and Energy Saving: Planning, Operation and Equipments View all 42 articles
Introduction: The reduction of electricity-related carbon emissions by city dwellers (CDs) is important for China to achieve low-carbon development and sustainable energy transformation. Due to the lack of incentives for reduction, electricity-related carbon emissions from CDs are increasing year by year. To this end, this paper proposes an electricity-related carbon emission quota trading model that integrates a credit rating and credit score system, particularly for motivating CDs to actively participate in carbon emission reduction.
Methods: With the history of electricity bill payment data, the density-based spatial clustering of applications with noise (DBSCAN) algorithm is used to cluster CDs, forming different clusters of CDs with different sensitivity levels to carbon emission quota prices. Thereafter, based on the total carbon emission quota and tiered electricity prices from the power company, incentive rules according to the classification result and credit scores of CDs are formulated. Under certain conditions, a leader–follower Stackelberg game between CDs and the power company is built to determine the base price of the carbon emission quota, and thereby, referring to the credit scores of CDs, floating carbon emission quota prices are offered to them in the final settlement.
Results: The simulation results for an actual community in a city in China show that the proposed method can considerably reduce the carbon emissions.
Discussion: The proposed credit rating and credit score system outperforms the asymmetric Nash negotiation method in terms of promoting carbon emission reduction.
Inspired by the government’s carbon peak and carbon neutrality goal, the demand for carbon emission reduction is increasingly prominent in China (Ji et al., 2021). In 2021, the State Council of China issued a work opinion on the carbon peak and carbon neutrality goal, requiring speeding up the establishment of a national carbon emission credit trading market and standardizing the carbon emission accounting system (Sichuan Daily, 2022). Carbon emission credits, in fact, refer to the allowed carbon emission amounts, i.e., the quotas, allocated to entities within a specific period. Complying with the limit of the total carbon emission amount, entities could participate in the carbon emission credit trading market to purchase extra quotas or sell their surplus (Long and Han, 2020). Carbon emission credit trading is also referred to as carbon emission quota trading in this paper.
Focusing on the carbon peak and carbon neutrality goal, carbon emission quota trading is an important way to strongly promote the low-carbon dispatch of the energy system economy, fully integrate carbon emission resources based on their market-oriented characteristics, and comprehensively improve their comprehensive benefits in the carbon emission quota trading market. The power industry, as the most important part of the energy industry, accounts for a large proportion of carbon emissions. A particular power generation and consumption-related carbon emission quota trading market can help considerably promote the green and sustainable development of the power system.
Many existing references have discussed the low-carbon economic dispatch of the energy system under the background of the carbon emission credit trading market. Yang et al. (2021) integrated the cost of carbon emission credits into the optimal operation model of energy systems and analyzed the influence of carbon emission credit prices on the operation of the system Wang et al. (2020); He et al. (2020) built an energy scheduling model based on carbon emission credits, which are instructive for the cost analysis of carbon emission credit trading in energy systems. Xiang et al. (2021) proposed an optimal operation model for energy systems that integrate multiple resources such as gas turbines, photovoltaic power farms, and energy storage systems. This model integrates the cost of carbon emission credit trading into its objective to better reflect the actual operation cost. Luo et al. (2021) optimized the energy structure through proposing a carbon emission credit trading mechanism and studied the role of energy storage systems on low-carbon economic dispatch with the designed trading mechanism. However, because the carbon emission quota trading market of China is in the early stages of development, the trading mechanism, the accounting system, and the market framework are mainly industrial sector-oriented, while little consideration is made regarding city dwellers (CDs) to incentivize their participation.
It has been shown that the rapidly increasing electricity demand of CDs in China has become the main driving force for the increase in carbon emissions (Peng et al., 2021; Wang et al., 2021). According to statistics, the electricity-related carbon emissions from CDs in China account for around 30% of the country’s total electricity-related carbon emissions. Moreover, in terms of carbon emission per capita, the contribution of CDs is as high as 65% (Wang et al., 2022). Therefore, extensively exploring the potential of CDs in carbon emission reduction is an important manner to achieve carbon peak and carbon neutrality in China.
In fact, promoting carbon emission reduction on the CD side is complicated and should be systematic. A series of pilot schemes have been issued by many countries. The governments of Sweden and France levied carbon emission and energy efficiency taxes to force CDs to reduce carbon emissions (Petrik and Anita, 2020; Cyril et al., 2021). However, the disadvantages of the regressive effect of carbon emission tax are striking (Feng et al., 2021; Zhang and Zhang, 2022). Finland implements carbon emission quotas to control the total amount of electricity-related carbon emissions (Kuokkanen et al., 2020; Wang and Wang, 2021; Wu and Zhang, 2021), which could shed light on ideas for China’s carbon emission quota allocation and trading mechanism design. It is worth mentioning that since still being in the early stages of development, currently, the carbon emission credit spot price in China is only a few tenths of that in Finland (Li P. et al., 2021a; Chen and Zhao, 2021). This results in the problem of insufficient trading incentives. As an example, assuming that the annual electricity consumption of a single CD is 3600 kWh and the electricity price is 0.572¥/kWh, the total electricity bill for this CD is 2059.2¥. Considering that 60% of the annual electricity consumption (3600 kWh) comes from thermal power, the carbon emissions of thermal power is 0.997 kg/kWh, and the carbon emission quota price is 52.8¥/ton, even the proportion of sold carbon emission quota takes a half, i.e., the corresponding annual total income merely accounts for 2.76% of the CD’s electricity bill, namely, 56.85¥. For a CD with an annual income of 60,000¥, this only accounts for 0.09% of his/her annual income. Intuitively, due to the tiny proportion, the aforementioned methods can hardly provide sufficient incentives to CDs for letting them participate in carbon emission reduction.
Considering the large number and wide distribution of CDs and their significant diversity in price sensitivity, regulatory intention, carbon emission, and electricity consumption, how to reasonably cluster CDs and based on the mechanisms of the current China electricity market and carbon emission quota trading market to formulate suitable incentive policies guiding CDs to actively participate in electricity-related carbon emission quota trading has become the focus of research. Tiered electricity pricing, which is essentially a quota management manner, has been implemented in cities in China. With tiered electricity prices, after the electricity quota with a low price is consumed, a CD will purchase additional electricity quota at a higher price (Chu and Zhu, 2020; Wu and Gao, 2021; Tang et al., 2022) to meet further electricity demand. This already implemented tiered electricity pricing mechanism and actual operation data can provide good features for clustering CDs and help the refined management and practical implementation of electricity-related carbon emission quota trading of CDs.
To this end, focusing on CDs, this paper proposes a credit score-based electricity-related carbon emission quota trading model. In this model, the power company is responsible for initializing the credit ratings of CDs according to the CD clustering results and formulating trading and credit score updating rules. The credit score system, credit ratings, and floating price mechanism are formulated referring to standards issued by the Sichuan Association of Circular Economy (SACE). On the basis of the tiered electricity price, a floating price-based carbon emission fee will be levied on CDs, while market-oriented surplus quota trading among CDs is realized. The proposed market framework is conducive to improving the actual benefits and enthusiasm of CDs participating in electricity-related carbon emission reduction and promoting China’s low-carbon transformation. For the power industry, by governing the sources of carbon emissions, namely, power consumption, the proposed method can help the energy consumption pattern and energy consumption structure transformation of CDs, thereby promoting the reduction of their electricity-related carbon emissions. For the society, it helps promote the comprehensive green transformation of economic and social development and relieve climate change.
The underlying idea of credit incentive trading is to realize the total electricity-related carbon emission reduction through motivating CDs to actively participate in carbon emission reduction. Power companies in China generally charge CDs at government-regulated prices. Therefore, the municipal government entrusts the power company to collect electricity-related carbon emission fees. First, according to the government’s carbon emission regulatory requirements, the power company calculates the CDs’ carbon emission quotas within a statistical period based on their tiered electricity consumptions. The power company also formulates the carbon emission quota trading rules.
Thereafter, CDs can participate in electricity-related carbon emission quota trading. In the trading process, floating prices will be finally offered referring to the credit ratings of the CDs, which helps in increasing the benefits of the CDs, thereby motivating them to actively participate in carbon emission reduction.
The electricity-related carbon emission quota trading process designed in this paper has no cash flow between CDs. All related funds from either buyers or sellers are deposited in the public account of the power company. The power company finally settles the trading together with the settlement of CDs’ electricity bills. The electricity-related carbon emission quota trading process is illustrated in Figure 1.

FIGURE 1. Flowchart of the electricity-related carbon emission quota trading process.
As shown in Figure 1, first, based on the carbon emission forecast of the city, the power company purchases the city’s total electricity-related carbon emission quota from the carbon emission credit spot market and approves the electricity carbon emission quotas of individual CDs.
Then, based on the historical electricity bill data of CDs, the power company carries out a clustering analysis, after which credit scores and credit ratings of individual CDs can be initialized. The updating rules of CDs’ credit scores are proposed by the power company, realizing the rolling update of credit scores of CDs.
Thereafter, the power company analyzes the total urban electricity carbon emissions based on the carbon emission quota trading information released by CDs:
1) If the total amount of the electricity-related electricity carbon emissions of the city remains unchanged, the settlement of the carbon emission quota trading will be in accordance with the government-approved ceiling price.
2) If the total amount of electricity-related carbon emissions of the city is reduced, a leader–follower Stackelberg game between CDs and the power company will be built to determine the base price of the carbon emission quota.
Lastly, according to the credit ratings of CDs, the price floating levels and deviation assessment standards of individual CDs are determined. The credit scores and credit ratings of CDs are also updated.
Urban per capita carbon emission is a core indicator of the carbon emission level of a city, and CD electricity-related carbon emission contributes 65% of it (Zhang and Lu, 2021). Obviously, reductions in electricity-related carbon emissions of CDs are the key for the Chinese government to pave the path to the carbon peak and carbon neutrality goal. In 2021, the National Development and Reform Commission of China issued a notice on “Further Deepening the Market-oriented Reform of Feed-in Tariff for Coal-fired Power Generation,” requiring the power company to undertake CD power supply and maintenance tasks and charge electricity bills based on tiered electricity prices (Li Z. et al., 2021b). Obviously, the power company has become the best candidate for administrating the electricity-related carbon emission quota trading of CDs. Therefore, in this paper, the proposed electricity-related carbon emission quota trading market is administrated by a power company that is entrusted by the municipal government. In summary, the government devises the carbon emission policy. The power company is the executor of the electricity carbon emission policy entrusted by the government. City dwellers are regulated by the power company and are responsible for their carbon emissions. At the same time, CDs become participants in electricity-related carbon emission reduction.
The electricity-related carbon emission quota trading model is designed via drawing on the experiences of how household-based garbage removal fees are collected and the manner of tiered electricity pricing that increases prices after a given quota has been exceeded. In the trading model, first, the power company analyzes the carbon emission levels of individual CDs and formulates a total quota on the carbon emission over all CDs. Then, the power company purchases the calculated amount of carbon emission quota in the provincial carbon emission credit spot market and approves the basic carbon emission quotas of individual CDs according to the total urban resident population. For CDs with family size exceeding corresponding to the basic quota, their quotas will be adjusted according to their actual family sizes. The 2019 edition of the National Greenhouse Gas Inventory Guidelines issued by the Intergovernmental Panel on Climate Change (IPCC) is the basis for approving CDs’ electricity-related carbon emission quotas (Viola, 2020; McLean and Gibbs, 2022).
In fact, carbon emissions are not generated by the electricity consumption of CDs but from the thermal units that burn coal for generating the consumed electricity. In addition to thermal units, supply resources of CDs typically include green energy resources and energy storage systems. Among them, the carbon emission intensities of thermal units are determined according to unit types; the carbon emission intensities of green energy resources, such as hydropower, solar energy, and wind energy, are set as 0. Energy storage systems do not directly generate carbon emissions, but their stored electricity could partly come from thermal units, therefore implicitly introducing carbon emissions.
We use
In Eq. 1, the line losses of the distribution area caused by supplying CDs are not considered. However, the municipal government may require including the line losses in the calculation of carbon emissions in order to accurately capture the actual amounts. We use
Using Eq. 3, the total carbon emissions of all CDs in the city can be obtained. In order to avoid the increase of alternative energy usage that leads to extra carbon emissions due to enforced reduction in the proportion of CDs’ electricity-related carbon emissions, a proportion factor is adopted to approve the basic quota of CDs’ electricity-related carbon emissions. The proportion factor is usually issued by carbon emission regulatory agencies based on their statistics and monitoring data. In our case, the proportion factor was issued by the SACE.
According to the forecasted total electricity-related carbon emissions of CDs, the power company purchases an equivalent amount of carbon emissions quota
We use
The purpose of establishing the electricity-related carbon emission quota trading market is to help CDs recognize the limitations on carbon emissions and thereby motivate them to actively reduce their carbon emissions. In the electricity-related carbon emission quota trading market, CDs with different incomes would show different degrees of sensitivity to the carbon emission fee. Intuitively, high-income CDs would be less sensitive to it and might be willing to pay extra beyond the bill of the basic quota; by contrast, low-income CDs would be highly sensitive to the carbon emission fee and might be willing to sell their remaining quotas for offsetting part of their electricity bills. To this end, in this paper, a clustering analysis based on CDs’ electricity usage is conducted to obtain their sensitivity level classification.
Density-based spatial clustering of applications with noise (DBSCAN) is a clustering method based on density detection and with noise canceling ability. This method has the ability to form clusters from high-density regions with limited features (Juan et al., 2021; He et al., 2022) and does not require pre-specifying the number of clusters. However, in the case of large CD samples, its convergence efficiency would be of concern. In other words, when facing a large number of CD samples, the convergence time of the DBSCAN algorithm may become unacceptable and divergence may happen. To this end, in this paper, the DBSCAN algorithm is improved through limiting the size of searching neighbors, achieving the processing capability of a large number of CD samples.
Considering the Mahalanobis distance involves covariance of distances and can comprehensively consider the characteristic relationship between CD samples (Chen et al., 2019; Cui and Xia, 2022), in the DBSCAN algorithm, it is used to measure the distances between CD samples.
Using
A neighborhood parameter,
In the DBSCAN algorithm, if the neighborhood of
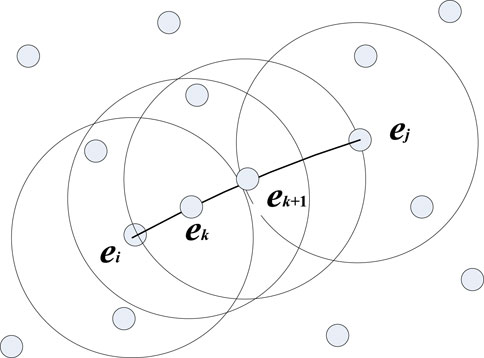
FIGURE 2. An illustrative example of density-reachable samples.
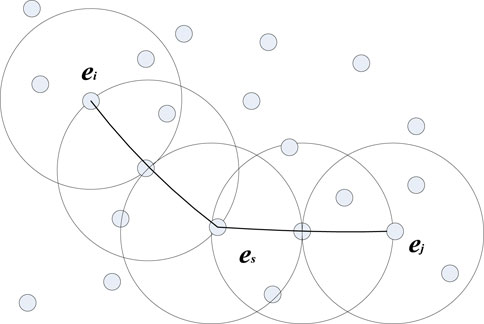
FIGURE 3. An illustrative example of density connection.
From Figures 2, 3, it can be seen that the DBSCAN algorithm explores density-connected CDs from density-reachable CDs and clusters those CDs into one cluster, finally forming clusters of CDs. This process is repeated until all samples are traversed.
The proposed credit system is essentially a user incentive model. By setting different preferential quota prices for CDs with different credit ratings, CDs could be motivated to participate in carbon emission reduction. The power company establishes and operates the credit system for CDs, including updating their credit scores and credit ratings and adjusting the floating carbon emission quota prices.
The designed credit system adopts a hundred-mark system. The range of 60–100 points indicates qualified credit. The 60th point corresponds to the base price of electricity-related carbon emission quota. With credit scores between 61 and 100 points for CDs who purchase and sell quotas, the prices will be respectively lowered and increased to different degrees on the basis of the base price. The range of 0–59 points indicates unqualified credit. For CDs in this area, on the contrary, on the basis of the base price, their purchase and sell prices will be respectively lowered and increased to different degrees. Table 1 shows the carbon emission credit ratings and the corresponding floating prices.
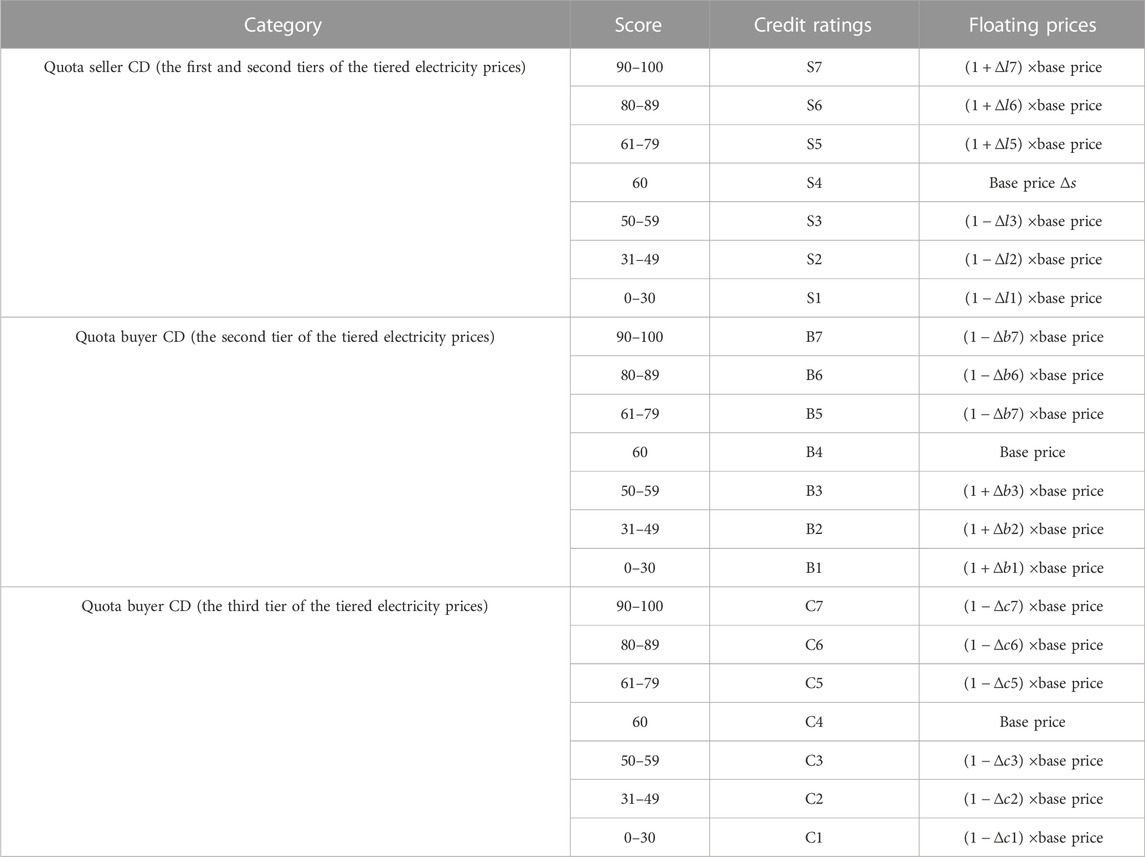
TABLE 1. Credit ratings of CDs and corresponding floating prices.
A CD’s initial credit score is set by the power company based on the standards issued by the electricity–carbon industry association. For simplicity, in this paper, the credit score initialization is based on the punctuality of the CDs’ electricity bill payment. Considering the due time of an electricity bill is
In a statistical period
A CD’s electricity-related carbon emission quota trading records, as well as violations on delivering traded quotas, will be stored, and at the same time, its credit scores will be dynamically updated based on these records. The power company supervises the carbon emission trading between CDs and rewards or penalizes CDs based on the rules in Table 1. Before the final delivery of traded quotas, all deals are first checked by the power company and then reviewed by the municipal government to verify the fairness and protect the interests of all involved parties.
On the basis of the initial credit score, the power company enforces the rules of credit score updating, as designed in Table 2. The rules are designed referring the standards of the electricity–carbon industry association.
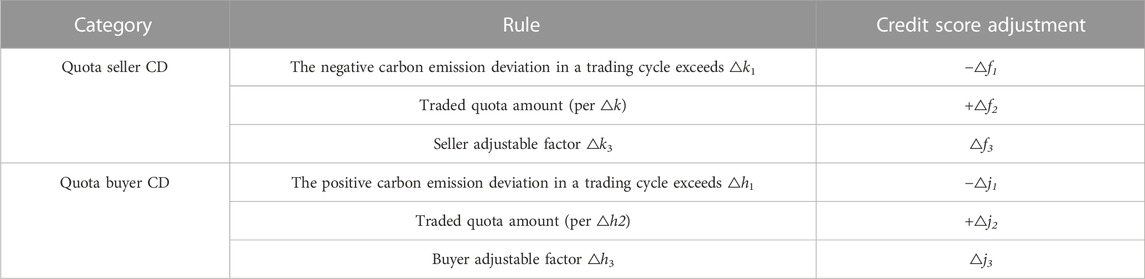
TABLE 2. Credit score updating rules.
The purpose of analyzing the total selling and purchasing offers is to judge whether the total carbon emission quota of CDs has been reduced based on the trading information. If the total amount of purchasing offers of CDs is greater than that of the selling offers, which means the total amount of carbon emissions will increase, the government will apply the carbon emission protection mechanism. Carbon emission quota trading will be settled with the government-approved ceiling price. For the part that exceeds the supply, the power company will purchase more green electricity on behalf of CDs so that CDs can offset their excess. The corresponding price will increase on the basis of the government-approved ceiling price. If the total amount of purchasing offers of CDs is less than that of the selling offers, a Stackelberg game between CD buyers, CD sellers, and the power company will be carried out to determine the price.
The total amount of CDs’ electricity-related carbon emissions,
If
For a CD who sells carbon emission quota, the income of the CD,
The carbon emission pricing analysis is used to determine the base price. On the premise that the price in carbon emission quota trading is higher than that in the carbon emission credit spot market, CD sellers, CD buyers, and the power company will play a Stackelberg game, seeking an equilibrium price for the three parties. This equilibrium price will be set as the settlement price.
The Stackelberg game is a leader–follower game model. In this model, the leader with advantages first gives its competitive strategy, and then the followers give their own strategies responding to the strategy of the leader (Mukaidani et al., 2021; Bouchaib et al., 2023). In the proposed carbon emission quota trading market, the competitive positions of the power company and CDs are obviously not equal. Intuitively, the power company will be the leader in the game and CDs, either as buyers or sellers, are the followers in the game.
In the game, we use
In the game, considering the power company as the leader bids
Considering the CD buyers, as the follower, bid
Considering the CD sellers, as the follower, bid
In the Stackelberg game, the expenditure of CD buyers is denoted as
In the gaming process represented by Eq. 16, the CD sellers pursue higher incomes and credit scores; and the CD buyers pursue lower expenditures and higher credit scores. The power company pursues the highest trading agency fee under the condition that the overall electricity-related carbon emissions can be reduced. All the three parties use benefit-maximizing strategies in the game until they reach an equilibrium.
In the game, in a trading cycle
The CD seller needs to satisfy Eq. 18, where
In a trading cycle, the quota buying price is
CDs are connected to distribution transformers through 0.4 kV distribution lines. The upper bound of their carbon emissions is indeed limited by the rated capacities of the distribution transformers that they are connected to. Thus, the power input to CD buyers needs to satisfy constraint Eq. 20. The upper bound is determined by the rated capacity of the distribution transformer,
The power supply company only administrates the trading market and charges agency fees according to the traded amount of carbon emission quotas. The benefit of the power company is, in fact, the collected agency fees as in Eq. 11. The benefit of the power company can be calculated as in Eq. 21, where
We use
With a Nash equilibrium solution, neither the power supply company nor any CD buyers and sellers can unilaterally change the strategy to achieve more profit. To achieve Nash equilibrium in the game, the optimal conditions of all participants should be satisfied. Under this premise, CD sellers and the power company look for the best quota buying price from high to low for profit maximization, while CD buyers look for the best quota selling price from low to high for cost minimization. In the process of solving the Nash equilibrium of the Stackelberg game, CD sellers, the power company, and CD buyers offer the initial prices. Then, in each iteration, the price change gradients of the three participants are calculated and their offered prices are updated. The iterative process continues until their current price offers are equal to the maximum values of their strict convex functions so as to obtain the Nash equilibrium. The detailed solving process is available in Jin et al. (2021) and Veeramsetty (2021) and thus is not described redundantly in this paper.
In the settlement, the credit scores can be used to exchange for preferential treatment. When the exchange amount is greater than
For a CD seller, if his/her actual delivered quota changes due to the increase or decrease in his/her own power consumption, there will be a deviation from its offered amount. The ratio of deviation can be calculated as in Eq. 23, where
For a CD buyer, if his/her actual bought quota decreases due to the increase or decrease in his/her own power consumption, there will be a deviation from its asked amount. The ratio of deviation can be calculated as in Eq. 24, where
Using
An actual community in a city in China is selected to validate the proposed electricity-related carbon emission quota trading market model. This community is equipped with 24 distribution transformers and has 10,762 CDs. The resident population of this community is 22,736. A single CD has only one house. The carbon emission quota trading is carried out monthly from January to December 2021. We consider that each CD corresponds to one unit (apartment) in this community. The typical values from the SACE are shown in Tables 1, 2. Other detailed parameters are shown in Tables 3, 4.
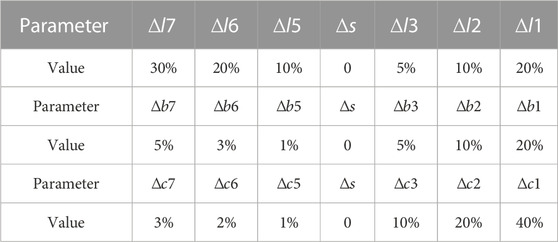
TABLE 3. Floating price settings.
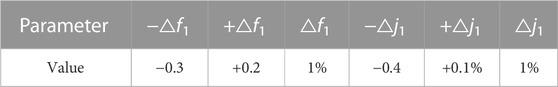
TABLE 4. Updating rule settings.
The Hungarian algorithm in Du et al. (2020) is compared with the proposed trading mechanism. The Hungarian algorithm has the characteristics of accurate results and high analysis efficiency and is widely used in carbon emission credit trading markets.
All numerical simulations are conducted on a server with Intel Xeon E5-2650 CPU (8 cores), 32 GB RAM, and 10 TB SSD. The operating system is Windows Server 2019.
The electricity-related carbon emission quota trading market proposed in this paper is cleared once a month. Considering China’s carbon emission credit price will gradually be in line with that of Europe and the United States, the initial carbon emission quota price is set at 0.26¥/kg, referring to the price in Europe (Frank, 2021).
In this paper, the tiered electricity prices of CDs have three tiers based on the electricity consumption: 1) within 100 kWh, charged at benchmark electricity price, 2) 101–200 kWh, charged at 120% of the benchmark electricity price, and 3) above 200 kWh, charged at 150% of the benchmark electricity price. Only CDs with electricity consumption in the first tier sell their remaining carbon emission quotas, while CDs in the other two tiers need to purchase quotas. For credit score and rating initialization, the electricity bill payment records of 60 months, from 2015 to 2020, are used. The power and capacity of equipped energy storage systems are 200 and 500 KWh, respectively. The capacity of distribution transformers supplying this community is 2000 KVA. The maximum purchase of carbon emission quota will be restricted by the capacity of the distribution transformers.
The electricity consumption of this community in January 2021 was 1872.6 MWh, and the line loss rate of its distribution area was 4.28%. The daily carbon emissions of this community in January 2021 are shown in Figure 4. In the basic carbon emission quota approval, the proportion of its electricity-related carbon emission in its total carbon emission amount increase does not exceed the threshold of
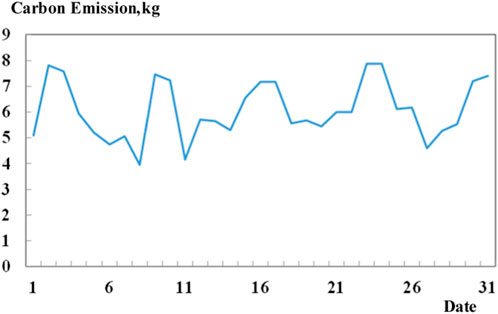
FIGURE 4. Carbon emissions of the studied community in January 2021.
Clustering on CDs is to obtain their sensitivity levels to carbon emission quota prices. The improved DBSCAN method is used to cluster CDs, and the results are shown in Table 5.
TABLE 5. Clustering results of CDs.
As shown in Table 5, CDs in the studied community can be clustered into three main classes: quota buyers, quota sellers, and idle CDs. Idle CDs are vacant units without or with less power consumption. Among them, CDs in the second and third tiers of the tiered electricity prices are less sensitive to carbon emission prices and are willing to purchase additional quotas. By contrast, CDs in the first tier are willing to sell their remaining quotas and are more sensitive to prices.
This section validates the effectiveness of the improved DBSCAN algorithm with a clustering accuracy rate that ranges from 0% to 100%. Intuitively, a greater value indicates a better performance. The manual clustering results are taken as the benchmark, and thereby the accuracy rate is defined as the proportion of identical clustering results of CDs to the results of manual clustering over all CDs. To avoid the long clustering convergence time of the DBSCAN method, the neighbor search scale in the DBSCAN algorithm is set as 200.
The clustering results of the improved DBSCAN and the K-means clustering algorithm with the number of CDs increasing from 1,000 to 8,000 at a step of 1,000 and being 10,000 are compared in Table 6. It can be seen that with different numbers of CDs, the improved DBSCAN outperforms the K-means clustering algorithm in terms of the clustering accuracy rate.
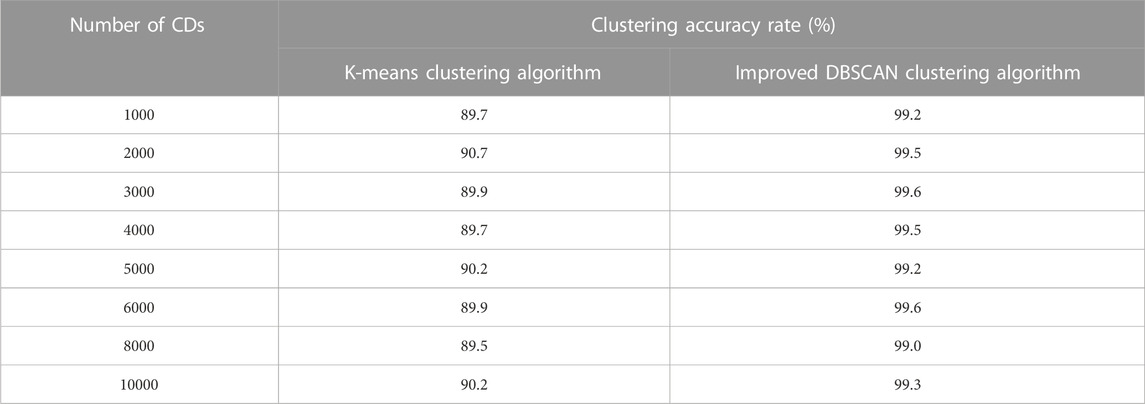
TABLE 6. Comparison of the improved DBSCAN and the K-means algorithms.
In this section, we study the game between CD buyers, CD sellers, and the power company. In the game, the power company charges agency fees based on a specific proportion of the electricity carbon emission quota price. Taking January 2021 as an example, in the game, the power company first sets the carbon emission quota price to 0.26¥/kg and then the CD buyers and sellers play a game based on their costs, benefits, and credit scores. The carbon emission quota price is adjusted until the Nash equilibrium is reached. The result is shown in Figure 5.
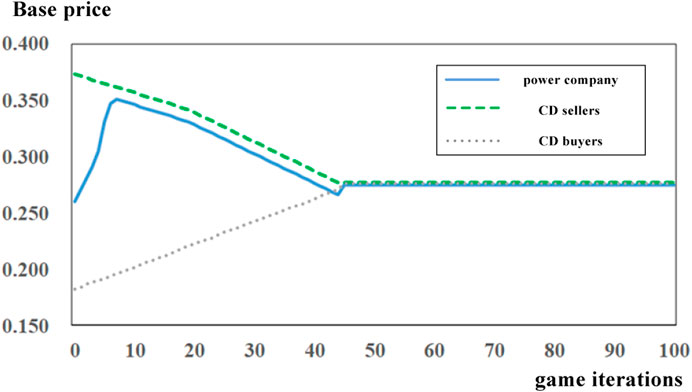
FIGURE 5. Process of the game between the power company and CDs.
As shown in Figure 6, at the beginning of the game, CD sellers and the power company offer a high price, while CD buyers offer a low price to pursue profit maximization. The Nash equilibrium is reached after about 45 times of gaming, and the final price consensus is 0.275 ¥/kg.
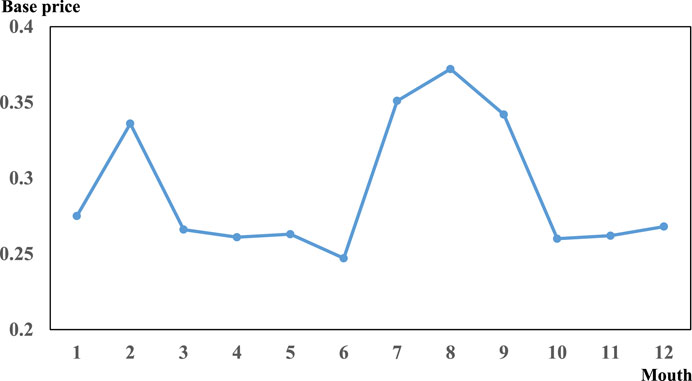
FIGURE 6. Prices of carbon emission quota in a year.
The carbon emission quota price analysis is to verify the price changes with market demand in the trading. When the supply of carbon emission quota exceeds the demand, the price decreases; on the contrary, when carbon emission quotas are in short supply, the price increases. The carbon emission quota prices for the 12 monthly market clearings in 2021 are shown in Figure 6.
As shown in Figure 6, the spring festival in February and the summer period of July, August, and September experience the peak of CD electricity consumption, which are also the peak of carbon emissions. The electricity-related carbon emission quotas are in short supply during these periods, so the trading prices are relatively high. The rest of the months are representative of the valley of electricity consumption, and the supply of carbon emission quotas usually exceeds the demand leading to low prices.
In this section, the proposed credit system is validated. The better the credit score and rating updating rules work, the higher the profit of the power company, especially when the total carbon emissions of CDs are reduced. Taking January 2021 as an example, the carbon emission quota price in January was 0.275 ¥/kg, as shown in Figure 4.
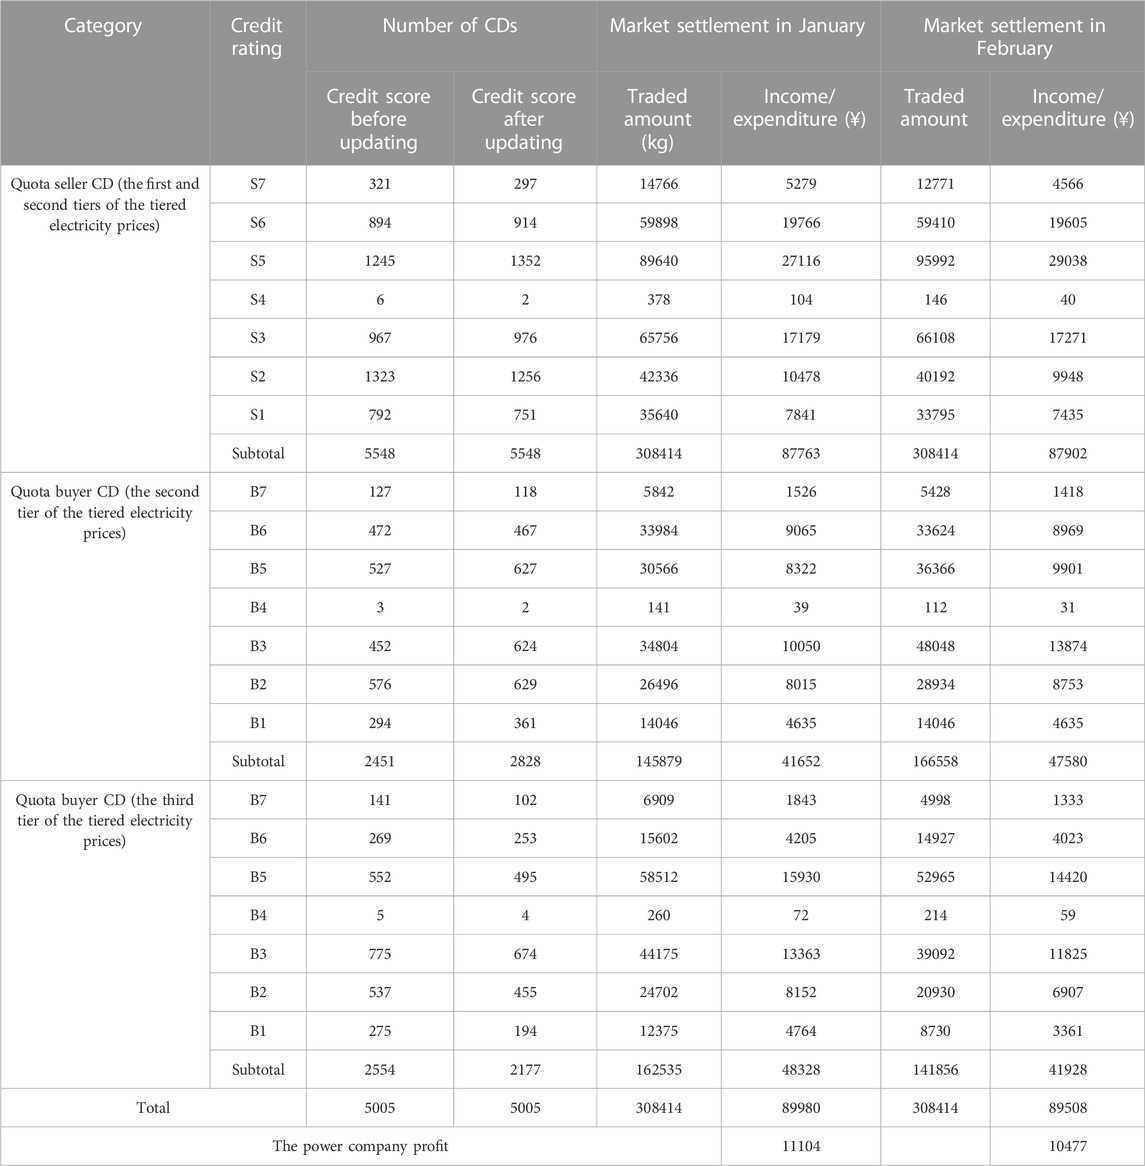
TABLE 7. Market settlement results.
As shown in Table 7, after the market clearing in January, the credit scores of some CDs are deducted, leading to changes in their credit rating. Using the carbon emissions of January, the adjusted CD credit rating, and January CD electricity carbon emission trading to compare, the fluctuation of the overall income of the three parties is within 500 ¥, maintaining stable operation of the reputation system.
To verify the reduction effect of carbon emissions after the operation of the proposed method, the average electricity carbon emission capacity of CDs in this community is analyzed. The numerical simulation spans from January to December 2021, with the proposed method being applied. The result is compared with the original operation data (i.e., without carbon emission quota trading) from January to December 2021 and the result with the asymmetric Nash negotiation method. The results are compared in Figures 6, 7. As shown in Figure 7, the average carbon emission of CDs over a year with the proposed credit system decreases from 168.83 to 152.58 kg compared with the asymmetric Nash negotiation method. This shows that the proposed credit system outperforms the asymmetric Nash negotiation method in terms of promoting carbon emission reduction.
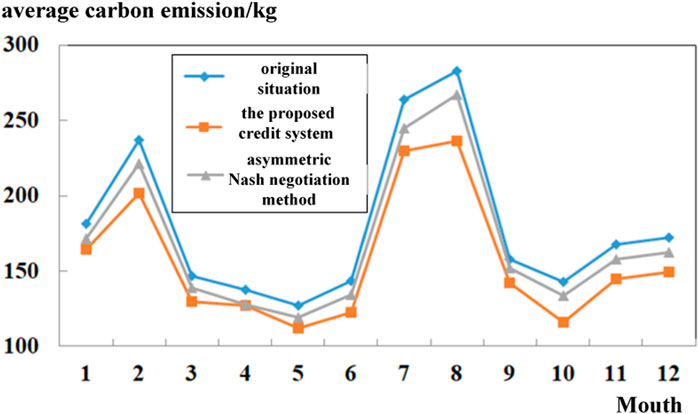
FIGURE 7. Monthly average carbon emission of CDs.
The purpose of the income analysis of CDs is to evaluate the incentives to CD buyers and sellers. Intuitively, the incomes of the CD sellers and the power company come from the expenditure of CD buyers. Higher incomes are beneficial to suppress the carbon emission of CDs. The incomes and expenditures of all parties in January 2021 are shown in Table 8.
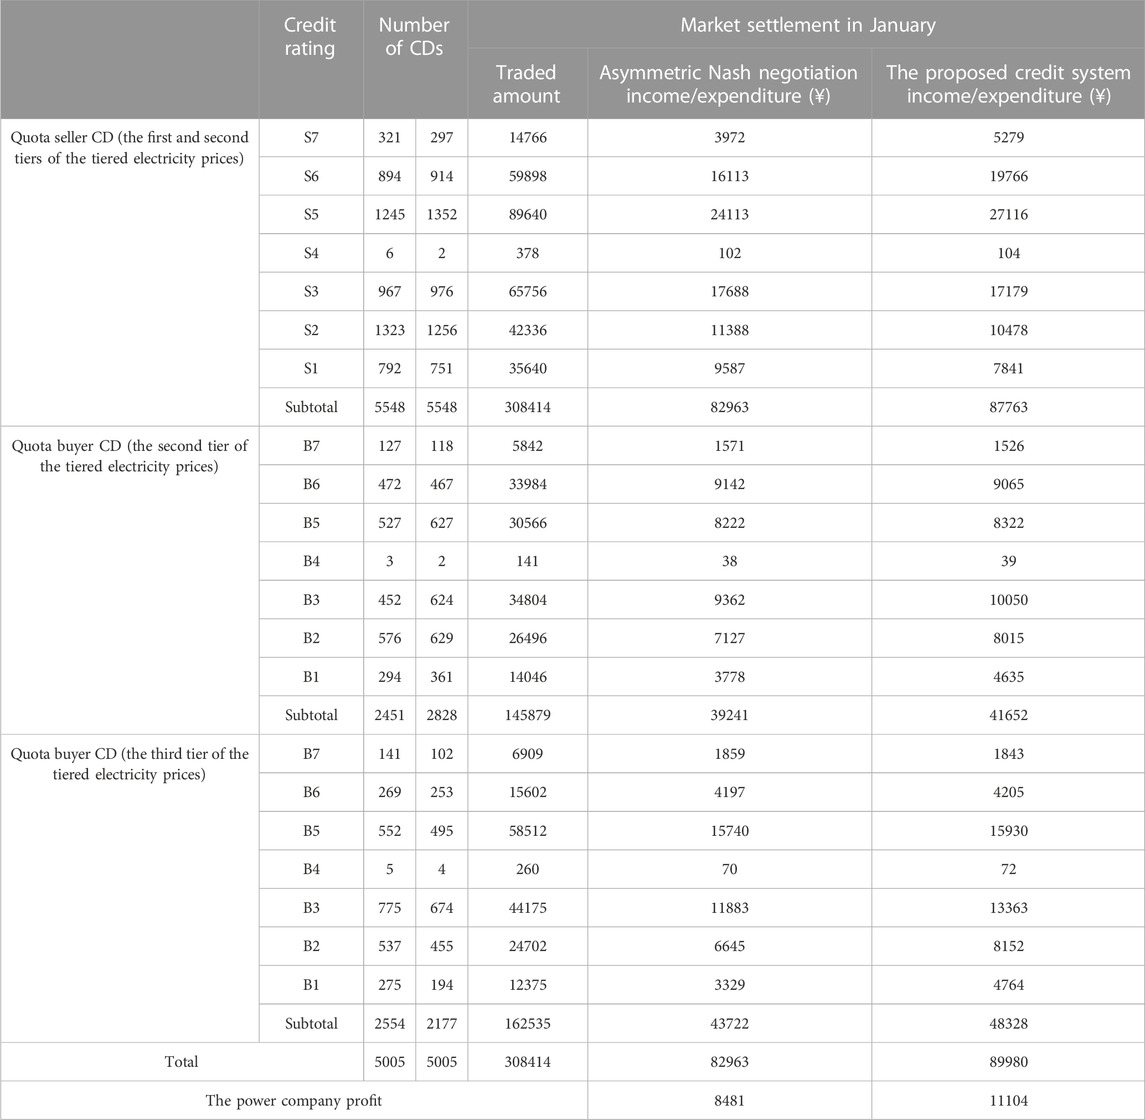
TABLE 8. Market settlement results with different methods.
As shown in Table 8, it can be seen that with the asymmetric Nash negotiation, the carbon emission quota prices to different CD buyers and sellers are identical and not incentives. With the proposed credit system, the incomes of CD sellers with high credit ratings increase, while those of CD sellers with low credit ratings decrease. Similarly, the expenditures of CD buyers with high credit ratings decrease, while those of CD buyers with low credit ratings increase. Through the proposed credit system, the electricity consumption of CDs that arouses carbon emissions is restrained from the economic point of view.
To solve the problem that the current policies have limited incentives to motivate CDs, reducing their carbon emissions leads to CD’s electricity-related carbon emissions increasing year by year. A credit rating- and credit score-based carbon emission quota trading model is proposed for regulating CDs’ carbon emission reduction behaviors. This model is based on the control of the total carbon emissions of all CDs and a reward–punishment mechanism based on the credit rating. From the simulation, the following conclusions can be drawn:
1) On the basis of the control of the total carbon emission and the tiered electricity price, the DBSCAN is used to cluster CDs and obtain the typical classification of CDs. For different numbers of CD samples, the improved DBSCAN is superior to the K-means clustering algorithm in terms of clustering accuracy.
2) A Stackelberg game is built to guide CDs to achieve market-oriented trading. The final quota price after the game between CD sellers, CD buyers, and the power companies can reasonably reflect the balance of supply and demand.
3) The power company charges CDs floating carbon emission fees based on their credit ratings. The proposed trading model is superior to the original situation and the asymmetric Nash negotiation method.
The original contributions presented in the study are included in the article/supplementary material, further inquiries can be directed to dGFuZ2RvbmdsYWlAc29odS5jb20=.
All authors listed have made a substantial, direct, and intellectual contribution to the work and approved it for publication.
Authors DT, JZ, and WS were employed by Aostar Information Technology Co., Ltd. Author QL was employed by State Grid Information and Communication Industry Group Co., Ltd.
The remaining authors declare that the research was conducted in the absence of any commercial or financial relationships that could be construed as a potential conflict of interest.
All claims expressed in this article are solely those of the authors and do not necessarily represent those of their affiliated organizations, or those of the publisher, the editors, and the reviewers. Any product that may be evaluated in this article, or claim that may be made by its manufacturer, is not guaranteed or endorsed by the publisher.
Bouchaib, A., Abdellatif, K., and Jalel, B, O. (2023). Improving caching resource management: a pricing economic approach using cournot, bertrand, and Stackelberg game models[J]. Int. J. Commun. Syst. 36 (1), 1–17.
Chen, J, D., and Zhao, P. (2021). Carbon emissions trading pilot policy and power industry emissions reductions. Electr. Power 54 (12), 156–161.
Chen, S, X., Sun, W, M., and Song, Y, H. (2019). Study on the classification of LAMOST early stellar spectrum template by Mahalanobis distance. Spectrosc. Spectr. Analysis 39 (5), 1618–1622.
Chu, B, J., and Zhu, S, L. (2020). Research on optimization of stepped time-of-use electricity price model under the background of new electricity reform. Price Theory & Pract. 2020 (2), 43–46174.
Cui, L., and Xia, Y,Q. (2022). Semi-supervised sparse least squares support vector machine based on Mahalanobis distance. Appl. Intell. Int. J. Artif. Intell. Neural Netw. Complex Problem-Solving Technol. 52 (12), 14294–14312. doi:10.1007/s10489-022-03166-3
Cyril, B., Louis-Gaëtan, Gi., and Philippe, Q. (2021). Lump-sum vs. energy-efficiency subsidy recycling of carbon tax revenue in the residential sector: a French assessment. Ecol. Econ. 184, 107006. doi:10.1016/j.ecolecon.2021.107006
Du, X, L., Liang, K, R., and Li, D, F. (2020). Reward and penalty model of carbon emission reduction and carbon trading matching model for power industry based on blockchain technology. Automation Electr. Power Syst. 44 (19), 29–35.
Feng, Y., Ying, Z, F., and Yan, J. H. (2021). Optimized operation of energy storage in a multi-energy complementary micro-energy network considering carbon emission cost. Power Syst. Prot. Control 49 (8), 92–99.
Frank, W. (2021). Platts Analytics lifts 2021 EU carbon price forecast to Eur29.10/mt. Platts Coal Trader Int. 21 (11), 5–6.
He, H, T., Wu, L., and Hu, X,J. (2022). Warship formation extraction and recognition based on density-based spatial clustering of applications with noise and improved convolutional neural network. IET radar, sonar navigation 16 (12), 1912–1923. doi:10.1049/rsn2.12305
He, L, G., Lu, Z, G., Geng, L, J., Zhang, J., Li, X., and Guo, X. (2020). Environmental economic dispatch of integrated regional energy system considering integrated demand response. Int. J. Electr. power energy sys-tems 116, 105525–105525.14. doi:10.1016/j.ijepes.2019.105525
Ji, B., Chang, L., and Chen, Z, H. (2021). Blockchain technology based design and application of market mechanism for power carbon emission allowance trading. Automation Electr. Power Syst. 45 (12), 1–10.
Jin, K., Yang, J, H., and Chen, Z. (2021). Blockchain-based transaction model of distributed photovoltaic generation for local power consumption. Electr. Power 54 (5), 7–16.
Juan, C., PerafáN, L., and Julián, S, P. (2021). An unsupervised pattern recognition methodology based on factor analysis and a genetic-DBSCAN algorithm to infer operational conditions from strain measurements in structural applications. Chin. J. Aeronautics 34 (02), 165–181. doi:10.1016/j.cja.2020.09.035
Kuokkanen, A., Sihvonen, M., Uusitalo, W., Huttunen, A., Ronkainen, T., and Kahiluoto, H. (2020). A proposal for a novel urban mobility policy: personal carbon trade experiment in Lahti city. Util. Policy 62 (2), 100997. doi:10.1016/j.jup.2019.100997
Li, P., Rao, Z,W., Kuo, N., Bonkovsky, H. L., and Omary, M. B. (2021a). Geographic prevalence variation and phenotype penetrance in porphyria: insights from a Chinese population database. Trading J. Univ. Electron. Sci. Tech-nology China (Social Sci. Ed. 23 (5), 12–15. doi:10.1182/bloodadvances.2020003150
Li, Z., Wu, L., Xu, Y., Moazeni, S., and Tang, Z. (2021b). Multi-stage real-time operation of A multi-energy microgrid with electrical and thermal energy storage assets: a data-driven MPC-ADP approach. IEEE Trans. Smart Grid 13 (39), 213–226. doi:10.1109/tsg.2021.3119972
Long, Y., and Han, C, L. (2020). Transaction processing and value evaluation of carbon emission rights based on wavelet transform image and deep learning. J. intelligent fuzzy Syst. Appl. Eng. Technolo-gy 39 (4), 5821–5832. doi:10.3233/jifs-189058
Luo, Z., Qin J, H., and Liang, J, Y., (2021). Day-ahead optimal scheduling of integrated energy system with carbon-green certificate coordinated trading mechanism. Electr. Power Autom. Equip. 41 (9), 248–255.
McLean, M., and Gibbs, T. (2022). Addressing Code Red for humans and the planet: we are in this together. Med. Teach. 44 (3), 462–465. doi:10.1080/0142159x.2022.2040733
Mukaidani, H., Irie, S., Xu, H., and Zhuang, W. (2021). Robust incentive Stackelberg games with a large population for stochastic mean-field systems. IEEE CONTROL Syst. Lett. 6 (6), 1934–1939. doi:10.1109/lcsys.2021.3135754
Peng, L, L., Li, N., and Zheng, Z. (2021). Spatial-temporal heterogeneity of carbon emissions and influencing factors on household consumption of China. Environ. Sci. 41 (1), 463–472.
Petrik, R., and Anita, T. (2020). Dosis facit effectum why the size of the carbon tax matters, Evidence from the Swedish residential sector. Energy Econ. 91 (9), 1–15.
Sichuan Daily (2022). Sichuan provincial committee of the communist party of China, sichuan provincial people's government of the communist party of China. Implementation Opinions on Completely, Accurately and Comprehensively Implementing the New Development Concept and Doing a Good Job in Carbon Neutralization, 2022-03-31(01).
Tang, Z., Liu, J., and Zeng, P, L. (2022). A multi-timescale operation model for hybrid energy storage system in electricity markets. Int. J. Electr. Power & Energy Syst. 138, 107907. doi:10.1016/j.ijepes.2021.107907
Veeramsetty, V. (2021). Shapley value cooperative game theory-based locational marginal price computation for loss and emission reduction. Prot. Control Mod. Power Syst. 6, 33. doi:10.1186/s41601-021-00211-0
Viola, P. (2020). La contribución científica del Intergovernmental Panel on Climate Change al Pacto Verde Europeo: introducción a la European Climate Law. A&C-REVISTA DE DIREITO Adm. CONSTITUCIONAL 0 (81), 55–68. doi:10.21056/aec.v20i81.1436
Wang, C, B., Hu, Z, W., Zhou, D. Q., Piao, C. G., and Li, Y. (2022). Indirect CO2 emissions from household consumption in China: quantification and key emission reduction path analysis. J. Beijing Inst. Technol. Sci. Ed. 24 (3), 1–21. doi:10.3897/mycokeys.93.89209
Wang, R., Zhang, H., Qiang, W, L., Li, F., and Peng, J. (2021). Spatial characteristics and influencing factors of carbon emissions in county-level cities of China based on urbanization. Prog. Geogr. 40 (12), 1999–2010. doi:10.18306/dlkxjz.2021.12.002
Wang, X, P., and Wang, X, P. (2021). Research on the dependence structure and risk spillover effect between EU and domestic carbon. Trading Mark. Industrial Technol. Econ. 40 (7), 72–81.
Wang, Y, Q., Qiu, J., Tao, Y, C., Zhang, X., and Wang, G. (2020). Low-carbon oriented optimal energy dispatch in coupled natural gas and electricity systems. Appl. energy 280 (15), 115948.1–115948.20. doi:10.1016/j.apenergy.2020.115948
Wu, H, J., and Zhang, Z, G. (2021). A theoretical model of the spatial and temporal characteristics of urban carbon price and its formation mechanism: price data based on eight regional carbon trading pilot projects modern urban research. Mod. urban Res. 2021 (1), 19–24.
Wu, Z, Q., and Gao, Y. (2021). WANG Bo. Real-time pricing strategy for the smart grid under “load-utility” two-level balance. Power Syst. Prot. Control 49 (17), 65–73.
Xiang, Y., Wu, G., Shen, X, D., Ma, Y., Gou, J., Xu, W., et al. (2021). Low-carbon economic dispatch of electricity-gas systems. Energy 226 (1), 120267–120267.12. doi:10.1016/j.energy.2021.120267
Yang, H, H., Xie, M, Y., and Huang, W, T. (2021). Low-carbon economic operation of urban integrated energy system including waste treatment. Power Syst. Technol. 45 (9), 3545–3552.
Zhang, D, Y., and Lu, S,H. (2021). HAO mengge. Analysis of carbon emission characteristics of residential consumption. Based Entropy Weight TOPSIS Henan Sci. 39 (11), 1887–1892.
Keywords: carbon emissions, electricity, credit score, city dweller, Stackelberg game
Citation: Tang D, Li Q, Zhang J, Chen Y, Liu Y and Song W (2023) Credit rating- and credit score-based carbon emission quota trading model of city dwellers. Front. Energy Res. 11:1250717. doi: 10.3389/fenrg.2023.1250717
Received: 30 June 2023; Accepted: 08 August 2023;
Published: 25 August 2023.
Edited by:
Nan Yang, China Three Gorges University, ChinaReviewed by:
Peng He, Chongqing University of Posts and Telecommunications, ChinaCopyright © 2023 Tang, Li, Zhang, Chen, Liu and Song. This is an open-access article distributed under the terms of the Creative Commons Attribution License (CC BY). The use, distribution or reproduction in other forums is permitted, provided the original author(s) and the copyright owner(s) are credited and that the original publication in this journal is cited, in accordance with accepted academic practice. No use, distribution or reproduction is permitted which does not comply with these terms.
*Correspondence: Donglai Tang, dGFuZ2RvbmdsYWlAc29odS5jb20=
Disclaimer: All claims expressed in this article are solely those of the authors and do not necessarily represent those of their affiliated organizations, or those of the publisher, the editors and the reviewers. Any product that may be evaluated in this article or claim that may be made by its manufacturer is not guaranteed or endorsed by the publisher.
Research integrity at Frontiers
Learn more about the work of our research integrity team to safeguard the quality of each article we publish.