 Jing Xie
 Xinyue Miao2
 Chunyan Shi
94% of researchers rate our articles as excellent or good
Learn more about the work of our research integrity team to safeguard the quality of each article we publish.
Find out more
ORIGINAL RESEARCH article
Front. Energy Res., 13 October 2023
Sec. Solar Energy
Volume 11 - 2023 | https://doi.org/10.3389/fenrg.2023.1250540
This article is part of the Research TopicAdvanced Solar Utilization and Control Technologies in BuildingsView all 5 articles
With the rapid development of economy and urbanization in China, cities are expanding rapidly and more constructions are being built, then lead to the fast-growing part in urban residential energy consumption. In China’s hot summer and cold winter regions, many buildings are not centrally heated and commonly rely on electrical equipment such as air conditioners which are all energy-inefficient thermoregulation devices. In order to analyze the relationship between building energy consumption and the energy efficiency ratio (EER) of air conditioning and the area of photovoltaic (PV) on the roof, the influence of the building envelope on building energy consumption in hot summer and cold winter regions in China is clarified. This paper uses energy plus software to analyze the impact of different EER and PV area on building energy consumption using a typical case study of a public health upgrading project in the eastern part of the Wuxing district, Huzhou, Zhejiang province in China. The simulation results show that the factor that has a greater impact on the energy consumption of the health center in summer is the PV area parameter of the building compared to the performance parameters of the air conditioning equipment. The PV area parameter settings and air conditioning equipment performance adjustments are dependent on the actual situation and the comprehensive energy saving rate of the outpatient building for public health in the eastern part of Tai Wu Xing District can exceed 50%. Finally, an economic analysis of the carbon tax and input costs is carried out, and the best combination is of which 60% of the area covered by Longi Green PV panels and an air conditioning efficiency ratio of 4.87. The research result combines renewable energy and efficient equipment to achieve dual optimization of environmental and economic aspects of building energy consumption, while providing reference opinions on the comprehensive evaluation method of building energy consumption from the perspective of carbon tax.
Energy provides an important driving force for the economic development of human society. However, the current global energy crisis is becoming increasingly prominent, and the level of management of energy consumption has become an important indicator of the civilization of human society. In developed countries in Europe and America, energy consumption in buildings accounts for about 30% or more of total social energy consumption, and greenhouse gas emissions generated by the construction industry account for 40% of all carbon dioxide emissions (Nejat et al., 2015). This huge proportion of energy consumption has made countries around the world realize the importance of building energy efficiency, and have developed a series of building energy efficiency technologies and built a complete building energy assessment system (Wang et al., 2021). Although China’s building energy efficiency efforts started later than those of developed countries such as Europe, the pace of urbanization in China is gradually accelerating, and the scale and number of various building projects are increasing. The total energy consumption of buildings has now become one of the three largest energy consumers in China, alongside industrial and transportation energy consumption (Wang et al., 2014; Kim and Kim, 2020). Construction sector as the one of the highest energy consumption sectors in China, is the core sector of Chinese energy consumption (Sun et al., 2022). According to statistics by National Bureau of Statistics of China, the energy consumption of construction sector in China has increased from 5.533 × 10⁻³ to 9.142 × 10⁻⁴ tce (1 tce = 29.3 GJ) during the period between 2010 and 2019, with the average annual growth rate of 6.5% (Cui et al., 2021). It is observed that the energy consumption of Chinese construction sector still experiences a growing trend. Besides, with the continuous increase of China’s construction scale, the energy consumption of China’s construction sector will continue rising in the future.
In order to solve the problem of global warming, all the countries around the world are confronted with the common goal of CO2 emission reduction (Kj et al., 2018). In recent decades, Chinese rapid economic development has been accompanied by a relatively large amount of energy consumption (Zhou et al., 2017). Chinese government not only introduces energy conservation and emission reduction as the basic state policy, but also establish the target to peak its CO2 emissions before 2030 in the Paris Agreement (Meng et al., 2021). It is admitted that the construction sector plays a crucial part in global energy conservation and emission reduction across sectors (Robinson et al., 2017). Similarly, the construction sector is equally key to realize the target of energy conservation and emission reduction in China (He and Wei, 2016) Therefore, energy consumption of the Chinese construction sector has attracted significant attention in academia for many years (Li and Song, 2022). In recent years, domestic and foreign scholars have carried out many studies and projects on construction energy consumption. For example, Liu QR et al. proposes a new life cycle assessment (LCA) statistics method to calculate the energy consumption of Chinese buildings from the perspective of LCA under the sustainable supply chain system, and demonstrated that energy consumption in the operation stage plays a dominant role (Liu et al., 2022). Byrne Aimee investigated the actual thermal processes of the building envelope during transient and quasi-static conditions using retrofit measures of hollow walls and roof insulation. The results show that these values overestimate the effect of insulated walls and ceilings on heat loss (Byrne et al., 2013). Beccalli Marco et al. analyses the net energy and environmental benefits of buildings during energy efficiency retrofits throughout their life cycle and proposed a series of retrofit measures, mainly to improve the thermal performance of the building envelope and the energy use efficiency of technical equipment. The energy efficiency of these measures was evaluated and the balance between energy savings and environmental benefits was analyzed (Beccali et al., 2013). Alshamrani O.S. used sustainable building envelope materials to retrofit school buildings and analyzed the energy use of four different envelope types. The results of the study showed that the concrete and masonry envelopes were able to save 21%, 23% and up to 32% respectively, while the steel and wood envelopes were able to reduce energy use by 13.5%, 15% and up to 32% respectively (Alshamrani et al., 2011). According to statistical data, in cold regions of China, the total building energy consumption is about 27% higher than the national average energy consumption level, accounting for 30%–40% of the total energy consumption of all energy consumption in the region (Guo et al., 2020; Yin et al., 2020). Building energy consumption is dominated by winter heating energy consumption, of which 73%–77% is lost through the envelope system, distributed in various parts such as walls, roofs, doors and windows, etc., of which, wall heat transfer heat loss accounts for about 60%–70%; doors and windows about 20%–30%; roofs about 10% (Shao et al., 2020; Liu H. et al., 2021). Therefore, improving the insulation performance and heat transfer resistance of these parts can effectively reduce the amount of heat loss caused by the envelope structure and achieve energy saving in buildings.
In recent years, China’s urbanization has led to population accumulation, continuous outward expansion of urban areas, a consequent increase in floor space, and increasing requirements for indoor environments, with artificial regulation of indoor temperature and humidity, which has led to rapid growth in building operational energy consumption, which according to statistics has increased from approximately 380 million tce to 1 billion tce since 2004–2018, a growth rate of 163% (Luo et al., 2021; Pan and Wang, 2021). Meteorological parameters, envelope structure, equipment systems, operation and maintenance systems, human’s behavior and interior design parameters are the main influencing factors of the actual energy consumption of buildings, in China’s buildings, the main energy consumption of buildings was resulting from the building envelope structure (Yu et al., 2011; Envelope, 2022). Therefore, the analysis of the building envelope structure, to find out the factors of energy loss in the envelope structure, is very beneficial to find measures that are both economical and have a good energy saving effect. A growing number of countries are now using carbon taxes as an environmental policy tool, hoping that the tax will guide companies and individuals to reduce greenhouse gas emissions and collectively address the challenge of climate change (Oreggioni et al., 2021). The EU was one of the first regions in the world to implement a carbon emissions trading system and carbon tax. Under the EU’s carbon emissions trading system, governments set carbon emission limits for energy, industry and other sectors, and levy carbon emission permit fees on companies. In addition, the EU also plans to gradually increase the scope and rate of carbon taxes to achieve stricter emission reduction targets. China, on the other hand, has also implemented a carbon emissions trading system since 2018, whereby companies are required to purchase permits in the carbon market to cover their excess greenhouse gas emissions (Yu and Tan, 2023). In addition, the Chinese government is piloting a carbon tax policy in several regions to encourage companies to reduce their greenhouse gas emissions. For buildings, the sensible use of clean energy generation such as wind and solar power to reduce building energy consumption can reduce CO2 emissions and reduce or even eliminate the need to pay carbon taxes (Liu W. et al., 2021; Liu J. et al., 2021). One of the most common types of solar power equipment is the solar photovoltaic panel. It is capable of converting sunlight directly into electricity.
The energy consumption of the China’s construction sector ranks second worldwide and accounts for 46.7% of the total energy consumed in China (Zhang et al., 2015). According to Reinventing Fire: China, the energy-saving potential of the building sector is as high as 74%, which will contribute more than 50% of energy savings needed to achieve the target peak carbon emission by 2030 (Price et al., 2018). Therefore, improving energy efficiency and reducing fossil energy use in the construction sector are directly related to whether China can achieve the Paris Agreement commitment regarding peak GHG emissions. In China’s hot summer and cold winter regions, many buildings are not centrally heated and commonly rely on electrical equipment such as air conditioners which are all energy-inefficient thermoregulation devices (Guo et al., 2015; Hu et al., 2016). The region is also located in economically developed areas with major cities such as Shanghai. These cities face challenges in reducing CO2 emissions and improving thermal comfort for the occupants. This zone has become the fastest-growing part in urban residential energy consumption in China, with a high average annual growth rate of 50% (Xiao et al., 2023). Therefore, this paper focuses on the relationship between building energy consumption and air conditioning energy efficiency ratio and rooftop photovoltaic area to elucidate the impact of building envelope on building energy consumption in hot-summer and cold-winter regions based on the carbon tax considerations. It then determines whether the improved building can meet the near-zero energy code requirements. Finally, an economic analysis of the carbon tax and input costs is carried out to obtain the best economical solution to achieve low energy consumption.
The research object of this paper is the design of the public health upgrading project in the eastern part of Tai Wu Xing District, located in Huzhou, Zhejiang Province (120°00′E, 30°90′N, 4.10 m above sea level), which belongs to the northern climate. The building type is hospital (outpatient), the building classification is class A building, and the structural form is shear wall structure. The building orientation is 15.16° east of south, the angle of the compass is 15.16° east of north, the building area (calculated) is: total area 1.44 × 10⁴ m2, above ground 9.9 × 10³ m2, underground: 4.45 × 10³ m2, the building volume (calculated) is: total volume: 6.15 × 10⁴ m3, above ground 4.01 × 10⁴ m3, underground 2.13624 × 10⁴ m3. The external surface area and form factor are 7.99322 × 10³ m2 and 0.20 respectively. The number of storey is 6 above ground and 1 underground, and the building height is 23.10 m. The window-to-wall ratios on the east, south, west and north sides of the building are 0.10, 0.53, 0.32 and 0.35 respectively, and the integrated window-to-wall ratio is 0.38 (in Figure 1).
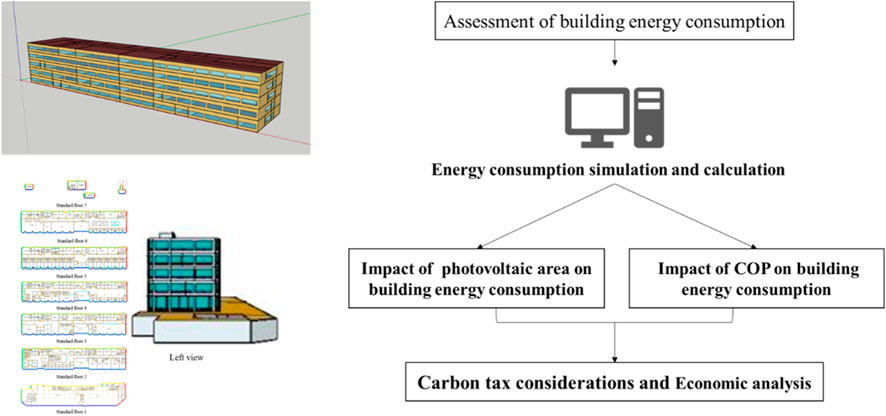
FIGURE 1. The structure of the building and framework of the study.
The dynamic energy consumption analysis method mainly includes the following methods. 1) Harmonic method: built on the basis of the solution of the thermal conductivity equation of the wall, the Fourier series of the sine or cosine function term is used to express the periodic disturbance quantity, and the concepts of delay and attenuation are introduced. Both the change of outdoor air temperature with time and the thermal inertia of the envelope are considered, but for some randomly changing disturbances, theoretically the order of the series is required to be infinite and the calculation is complicated and difficult to achieve. 2) Finite difference method: the problem is discretized into many nodes in both time and space dimensions, and the boundary conditions and initial conditions are used as known conditions, and the finite difference quotient is used instead of the differential quotient to transform the differential equation into a difference equation. The computational workload is relatively large and not for the average person to master. 3) State space method: It is discretized in space but remains continuous in time. For buildings where there are multiple rooms, a set of equations is set out for each envelope and space as a joint solution. The disadvantage is that it cannot handle non-linear problems such as phase-varying wall materials and variable surface heat transfer coefficients. 4) State space method: It does not require a periodic disturbance as a premise, and can be used to represent the change of disturbance in a time series. However, when calculating long-term loads, this algorithm is very time consuming.
At present, building energy analysis software can be broadly divided into the following two categories according to the function of each software: one is building energy simulation software based on the simulation of the building thermal process, and the other is consistency assessment software based on the audit of building energy efficiency standards.
The main energy simulation software currently used is DOE22.1E, BLAST, Transys Dest and Energy Plus. DOE22.1E is used to analyse energy consumption in all types of residential and commercial buildings and to analyse the cost of HVAC systems over their operational life cycle. BLAST is mainly used to calculate the cooling and heating loads of industrial buildings and to simulate the hour-by-hour energy consumption of air conditioning systems and equipment, but it requires a high level of practical experience and expertise in engineering. Dest is used for energy efficiency assessment of buildings and the version used varies from project to project. Energy Plus, developed by the US Department of Energy and Lawrence Berkeley National Laboratory, is a building energy simulation software that calculates the cooling and heating loads of a building from its physical composition and mechanical systems (HVAC systems). Energy Plus is the latest energy analysis software available for the comprehensive simulation and economic analysis of heating, cooling, lighting, ventilation and other energy consumption in buildings, and is widely used in energy efficiency assessments and retrofits. Energy Plus is a time-to-time building energy simulation engine that uses an integrated and synchronised load/system/equipment simulation approach. The CTF is used to calculate the heat transfer from the walls, and in turn the load of the building using the heat balance method. The simulation of the air conditioning system using Energy Plus is based on a component assembly method, using fluid loops as a basis, in which the user can combine the required system structure relatively freely by using the inlet and outlet nodes of each component. The model can be built around air or water loops relatively quickly. The set point manager provided in the software framework allows control of system level parameters such as air supply temperature, chilled water supply temperature, etc., as well as control of the air outlet temperature of the surface cooler and reheat coils via the controller.
In order to ensure the accuracy of the study, the article uses energy plus software for performance simulation, based on the typical climatic characteristics of the Huzhou region in Zhejiang, and uses the typical case study of the design project of the public health upgrading project in the eastern part of the Wuxing district as a research object to simulate the impact of the outpatient building air conditioning and photovoltaic variables on the building energy consumption (in Table 1).
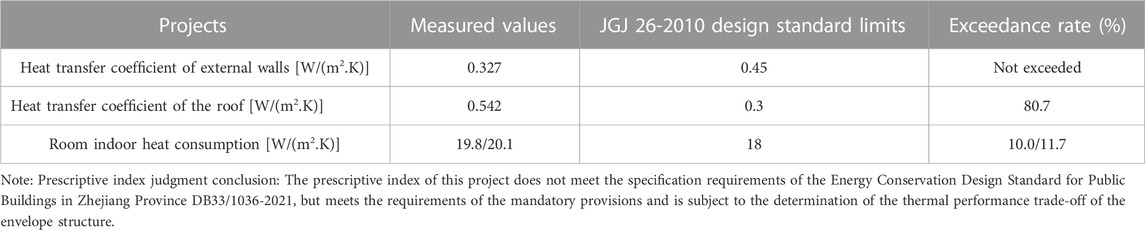
TABLE 1. Heat transfer coefficient of the envelope and indoor heat consumption.
In order to simulate the energy consumption of the outpatient clinic and to optimize the impact of air conditioning energy efficiency ratio and photovoltaic variables on the energy consumption of the building, a geometric model of the outpatient building was created in this paper and modelled using Sketch Up software., which was refer to the previous research methods with some optimization (Feng et al., 2022; Bastos Porsani et al., 2023). The main method was to import existing CAD drawings into Sketch Up and then to obtain the geometric model of the whole building by means of a new Zone using commands such as stretch, move and copy. The building thermal zone is the basic unit for calculating the building load. In order to make the results of the building energy simulation more accurate, it is very important to do the thermal zoning of the building model in advance. Generally speaking, the principle of building thermal zoning is to divide rooms of the same type into the same thermal zone. This ensures that rooms of different types, different envelope structures and different air conditioning systems can be accurately divided and energy consumption accurately calculated, and also avoids the extra workload caused by repeated calculations for rooms of the same type. By analyzing the building model, the geometric model was divided into 15 thermodynamic zones. Once the geometric model of the building was created, the weather parameters for a typical meteorological year in Huzhou, Zhejiang province, were imported into Energy Plus together with the created geometric model to simulate the load and air conditioning energy consumption throughout the year.
This paper focuses on the impact of air conditioning and photovoltaic variables on building energy consumption, with reference to the 15-year public building national standard for air conditioning of 8% and 16% respectively. That is, COP is 4.53, 4.87 respectively. Photovoltaic variables are 0, 20%, 40%, 60%, and 80% of the roof area. That is, the area is 0, 443.95, 887.9, 1.33185×10³, and 1.7758 × 10³ m2 respectively. Two by two combinations of a total of 10 sets of simulated data for energy consumption and economic type analysis. The prices of air conditioners were adopted from international green air conditioners, which prices vary slightly from brand to brand. And PV prices were from Longi Green Energy, which investment cost was about 500 $/m2. The specific parameters are shown in Table 2.
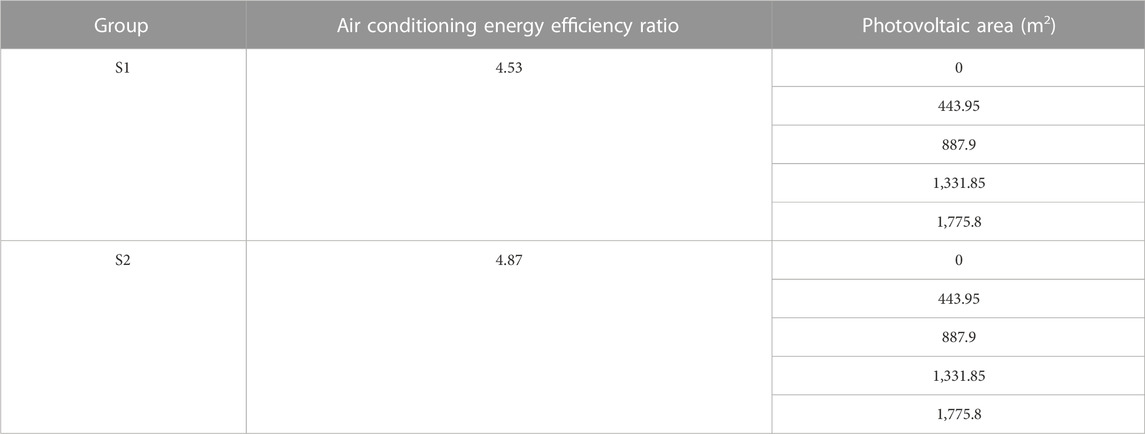
TABLE 2. Simulated working conditions.
The equipment use parameters in the energy consumption simulation are set according to the building function of each room, where the building air conditioning operation time is set according to the Energy Conservation Design Standard for Public. Buildings (GB 50189-2015) (in Table 3).

TABLE 3. Air conditioning running times.
The thermal parameters limits for the envelope of this building model are set according to the Energy Conservation Design Standard for Public Buildings, in Tables 4, 5 for specific parameters, and the air conditioning equipment performance parameters for this historical building model are set according to the Energy Conservation Design Standard for Public Buildings, in Tables 4, 5 for specific parameters.
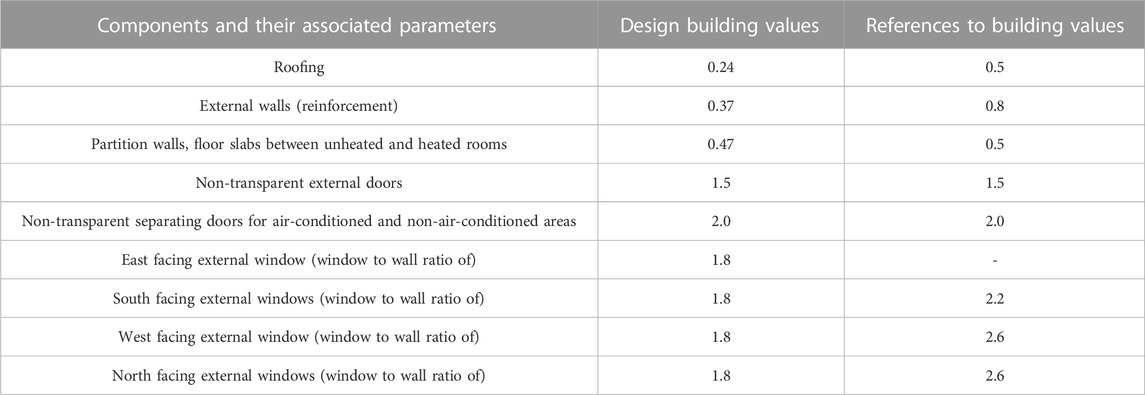
TABLE 4. Results of thermal calculations for reference and design buildings.

TABLE 5. Equipment performance parameter settings.
Validation is an important step in modelling. Currently, a widely used validation method is to determine whether the simulation results are accurate by setting a threshold value for the mean deviation of the simulation, based on the judgement conditions proposed by the professional specifications. The model can be validated by comparing the size relationship between the mean deviation and the threshold. To validate the model, the simulation results were compared with energy consumption data from the actual operation of the building prior to the energy efficiency retrofit. The use of a calibrated model therefore predicts energy savings for energy efficiency projects. The error index specified in the ASHRAE guidelines is the standard mean deviation (the coefficient of variation of the normalized mean deviation (NMBE) and the root mean square error (CVRMSE)) between the actual energy consumption values and the simulated values. The actual values of monthly building energy consumption can be obtained by creating an energy bill and the modelled values of monthly energy consumption can be obtained directly from software simulations. Reliable results from the ASHRAE guidelines show that 5% ≤ NMBE ≤5% and CVRMSE ≤15%. This paper compares the calculated results of NMBE and CVRMSE to determine if the model can be validated by the ASHRAE guidelines. If the model is validated, the simulation results are close to the actual energy consumption of the building and the model accurately reflects the actual energy consumption of the building and can be used as a basis for further analysis. The equations for NMBE and CVRMSE are:
where Xi (Yi) is the simulated value of the building energy consumption (actual value) for month i and

TABLE 6. Comparison between the building monthly energy consumption simulation value and the actual value.
According to the energy calculation method, the total annual energy consumption of the building is 3.71263 ×10³ MWh per floor area and 107.15 kWh/m2 per unit of floor area. The simulation results show that the annual energy consumption of 3,559.52 MWh is 153.11 MWh lower than the actual total energy consumption. The difference between the energy consumption per unit of floor area of 102.73 kWh/m2 and the actual energy consumption per unit of floor area is 4.42 Compared to the actual energy consumption, the deviation of the simulated total energy consumption is −4.12%, which is a relatively small error. In the simulation model validation method, the simulated and actual monthly energy consumption values for the outpatient building were substituted for validation. Using Eq. 1, the NMBE for this simulation was −4.50% and the CVRMSE was 6.21%, both assessment metrics being within the deviation range specified by the ASHRAE guidelines. The model can therefore be considered reliable and open to further research and analysis.
In the building simulation, all calculation parameters are set uniformly, except for the PV area parameter variable and the air conditioning equipment performance parameter variable, which are set separately. Based on the meteorological data of a typical meteorological year in the Huzhou region of Zhejiang, the building’s energy consumption is calculated hour by hour for 365 days using energy plus software.
The area modelled for the PV according to the variables 0, 20%, 40%, 60%, 80% of the roof area is 0, 443.95, 887.9, 1.33185 × 10³ m2, 1.7758 × 10³ m2 while keeping the building envelope coefficients and air conditioning efficiency ratios of the base building and other envelopes constant. The results of the simulations using energy plus software are shown in Figure 2.
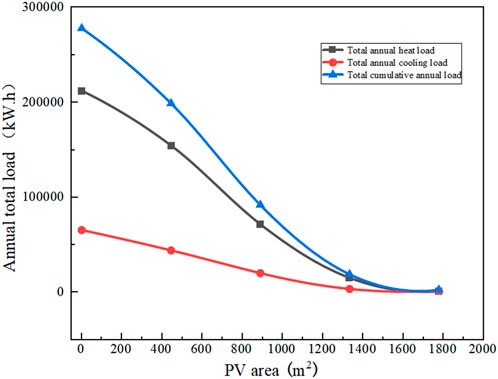
FIGURE 2. Effect of PV area on building energy consumption under different conditions.
Keeping the building envelope coefficients and PV area of the base building and other envelopes unchanged, the COP was changed in turn: 4.53, 4.87. The results of the simulations using energy plus software are shown in Figure 3.
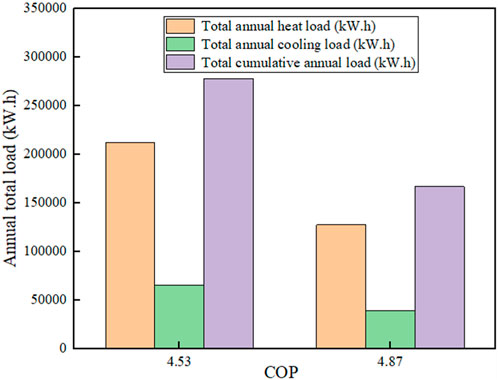
FIGURE 3. Impact of COP on building energy consumption.
Solar energy is one of the most popular renewable energy resources in the word (Andre, 2020). Research indicated that a solar photovoltaic (PV) system will generate only one-sixth and one-tenth of the CO2 of gas and coal respectively (Kumar, 2016). Therefore, rational use of PV resources is particularly important, this is also the same goal in the present study. As the PV area increases from 0 to 1.7758 × 10³ m2, the total annual heat load of the building first increases rapidly and then stabilizes; the effect of the change in PV area on the total annual cooling load also increases rapidly and then stabilizes, but the effect of PV area on the total annual heat load of the building is greater than that of the total annual cooling load; For the increase in the air conditioning energy efficiency ratio from 4.53 to 4.87, the total annual heat load of the building and total annual building cooling load both decrease, but the decrease in total annual building cooling load is more significant with an increase in the air conditioning energy efficiency ratio. This suggests that an increase in PV area is necessary to promote energy efficiency more effectively in Zhejiang, but that a larger PV area is not better and that an optimum area exists. In winter the heat transfer through the external walls can be prevented, thus reducing the heat load and thermal energy consumption caused by indoor heat dissipation. In summer the thermal insulation of the PV will reduce the heat transfer from the external walls to the outside at night and the heat will be kept inside. In summer with long sunshine hours, PV can play a thermal insulation effect, and more power generation in summer, however, summer is generally dominated by east-west sunlight, so in paving over the east-west PV, and then increase the PV area, the impact on building energy consumption is less. And the same is true in winter, which has the effect of insulating the building and reducing energy dissipation. The summer cooling energy consumption of the simulated building is significantly greater than the winter heating energy consumption, indicating that cooling energy consumption accounts for a greater proportion of the energy consumption in the area.
Carbon tax is a tax on the carbon emissions generated by the burning of fossil fuels (including coal, natural gas, oil, etc.) and their own carbon content, which aims to mitigate the greenhouse effect and slow down global warming by controlling and reducing carbon dioxide emissions (Jin et al., 2018). Since 1990, some Nordic countries such as Finland, Norway, Sweden and Denmark have been implementing a carbon tax system. Since then, the Netherlands, the United Kingdom and Germany have also introduced carbon taxes one after another. In the 21st century, countries and regions in Europe, South America, Asia and Africa have also joined the ranks of carbon taxation. Since then, the carbon tax system has been gradually implemented worldwide.
The Technical Standards for Ultra Low Energy Buildings specify energy efficiency indicators for public buildings as shown in Table 7. Which Integrated Building Energy Efficiency Rate (%) was ≥50.
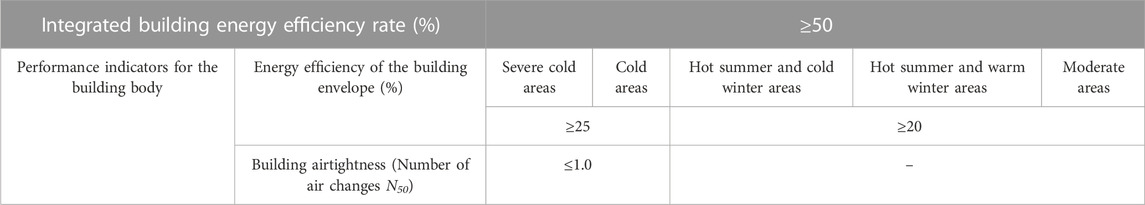
TABLE 7. Energy efficiency indicators for ultra-low energy public buildings.
The study used energy plus simulation software to simulate the annual building energy consumption of the outpatient building under different conditions of PV area, and the results are shown in Table 8.
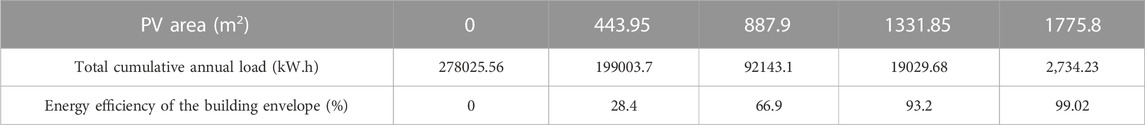
TABLE 8. Effect of PV area on the energy efficiency of the building proper.
The energy consumption in the operation phase of the building accounts for over 90% of the energy consumption during the whole life cycle of the building, therefore the energy consumption calculation in this study is limited to the operation phase of the building. The calculation of the energy saving rate and the overall energy saving rate for the public building proper in the Technical Standard for Ultra Low Energy Buildings is shown in equation Eq. 1 and Eq. 2.
Where: ηe is the energy saving rate of the building body, %; EE is the combined energy consumption of the design building (after PV installation) without renewable energy generation, kW.h/h2; ER is the combined energy consumption of the base building (before PV installation), kW.h/h2.ED is the combined energy consumption of the design building (after PV installation), kW.h/h2.
The energy saving rates of different PV areas of the buildings calculated using equations Eq. 1 and Eq. 2 are listed in Table 9. Based on the data in Table 9 the energy saving rates of the buildings are calculated to be 66.9%, 93.2%, and 99.02% for PV areas of 887.9, 1,331.85, and 1775.8 respectively. The results of the above calculations meet the Chinese ultra-low energy requirements; therefore, the project for public health in the eastern part of Tai Wu Xing District can meet the near-zero energy code requirements.
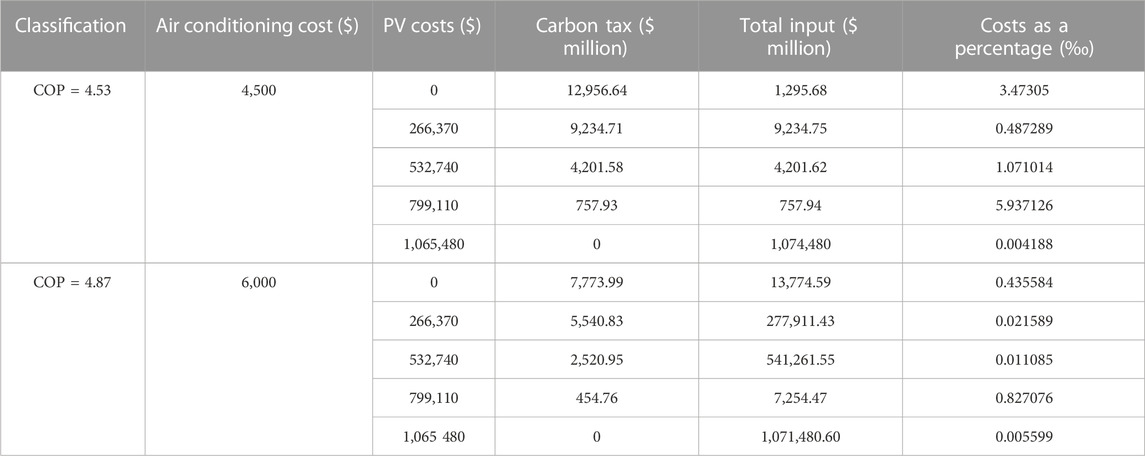
TABLE 9. Carbon taxes and upfront inputs for ten groups of cases.
A carbon tax threshold is a minimum standard of emissions below which a carbon tax is not levied. The carbon tax threshold is designed to prevent undue financial pressure on low emitting companies or industries and to provide an incentive for companies to take steps to reduce their emissions, thereby reducing the amount of carbon tax they pay (Luo et al., 2020; Martelli et al., 2020). There are a number of factors that need to be taken into account when setting the carbon tax threshold, such as industry characteristics, technological maturity, international competitiveness and environmental standards (Gugler et al., 2023). The exact value of the carbon tax threshold may vary between countries and regions, and may be adjusted over time and according to actual circumstances. According to the survey, the EU carbon tax threshold is 2,306 kg per tonne of CO2 emissions (Cheng et al., 2021). This means that no carbon tax is levied on companies or industries that emit less than this threshold per tonne of CO2. In addition, the EU has set a progressively increasing carbon tax rate to promote emission reductions. Starting in 2023, the EU will levy a carbon tax that will increase each year at an initial rate of €20 per tonne, approximately 146.95 RMB, rising to €55 per tonne by 2030.
The survey showed that the cost of using a GREE air conditioner with an 8% uplift is RMB 4,500 and a GREE air conditioner with a 16% uplift is RMB 6,000 while the unit price of a Longy Green PV panel is 600/m2. Therefore, a 20% roof area of Longy Green PV panels would cost RMB 266,370. The entire building energy consumption is converted into a carbon factor of 0.785. Therefore, the upfront investment and carbon tax for the ten groups of working conditions are shown in Table 9.
Table 9 shows that when the area covered by the Longy Green PV panels reaches 80%, no tax is required and the cost ratio tends to increase and then decrease with the increase in PV area. Therefore, the best combination of 60% PV area and 4.87 air conditioning efficiency ratio is chosen, which will save energy and reduce the initial investment cost.
Through actual cases and energy consumption simulation, this paper conducts comparative analysis and performance optimization of building energy consumption using renewable energy and efficient equipment, analyzes the impact of air-conditioning energy efficiency and PV area on building energy consumption based on EnergyPlus simulation, proposes a comprehensive evaluation method of building energy consumption in combination with carbon tax, and conducts compound optimization of environmental performance and economic performance. Finally, the optimal combination scheme of renewable energy and efficient equipment setting parameters is proposed. The research results provide theoretical support for the promotion and application of renewable energy in buildings, while providing effective solutions for its better integration with efficient equipment to improve environmental advantages and reduce CO2 emissions. The specific conclusions are as follows:
(1) The factor that has a greater impact on the energy consumption of a health centre in summer is the PV area parameter of the building, as opposed to the performance parameters of the air conditioning equipment.
(2) For the Zhejiang region, where summer time is a longer part of the year, the proportion of summer cooling energy consumption to annual air conditioning energy consumption is also significantly higher.
(3) The performance of air-conditioning equipment plays a major role in heating energy consumption in winter, while the PV area parameter plays a major role in cooling energy consumption in summer, so the setting of the PV area parameter and the performance of air-conditioning equipment should be adjusted according to the actual situation.
(4) By combining the above design strategies, the comprehensive energy saving rate of the outpatient building for public health in the eastern part of Tai Wu Xing District can exceed 50%, meeting the ultra-low energy code requirements.
(5) When the area covered by Longi Green PV panels reaches 80%, there is no need to collect taxes and the cost ratio tends to increase with the PV area and then decrease. The best combination of 60% of the area covered by Longi Green PV panels and an air conditioning efficiency ratio of 4.87 is chosen, which also plays an energy-saving role and reduces the initial investment costs.
The original contributions presented in the study are included in the article/Supplementary Material, further inquiries can be directed to the corresponding author.
JX: Conceptualization, methodology, formal analysis, and writing–original draft. XM: Formal analysis and visualization. BD: Resources, supervision, project administration, and funding acquisition. TX: Validation and data curation. XZ: Resources and supervision. CS: Validation. XW: Investigation, visualization, and writing–review and editing. All authors contributed to the article and approved the submitted version.
The authors declare that the research was conducted in the absence of any commercial or financial relationships that could be construed as a potential conflict of interest.
All claims expressed in this article are solely those of the authors and do not necessarily represent those of their affiliated organizations, or those of the publisher, the editors and the reviewers. Any product that may be evaluated in this article, or claim that may be made by its manufacturer, is not guaranteed or endorsed by the publisher.
Alshamrani, O., Alkass, S., and Galal, K. (2011). “Energy Consumption Reduction Using Sustainable Building Envelopes Material in School Buildings,” in 3rd International/Construction Specialty Conference (Proceedings), 9th Canadian Society of Civil Engineering Conference, Ottawa, Ontario, Canada, June 14-17, 2011.
Bastos Porsani, G., Casquero-Modrego, N., Echeverria Trueba, J. B., and Fernández Bandera, C. (2023). Empirical evaluation of energyplus infiltration model for a case study in a high-rise residential building. Energy Build. 296, 113322. doi:10.2139/ssrn.4361635
Beccali, M., Cellura, M., Fontana, M., Longo, S., and Mistretta, M. (2013). Energy retrofit of a single-family house: life cycle net energy saving and environmental benefits. Renew. Sustain. Energy Rev. 27, 283–293. doi:10.1016/j.rser.2013.05.040
Byrne, A., Byrne, G., Davies, A., and Robinson, A. J. (2013). Transient and quasi-steady thermal behaviour of a building envelope due to retrofitted cavity wall and ceiling insulation - ScienceDirect. Energ Build. 61 (3), 356–365. doi:10.1016/j.enbuild.2013.02.044
Cheng, Y., Sinha, A., Ghosh, V., Sengupta, T., and Luo, H. (2021). Carbon tax and energy innovation at crossroads of carbon neutrality: designing a sustainable decarbonization policy. J. Environ. Manage 294, 112957. doi:10.1016/j.jenvman.2021.112957
Cui, X., E, S., Niu, D., Wang, D., and Li, M. (2021). An Improved Forecasting Method and Application of China’s Energy Consumption under the Carbon Peak Target. Sustainability-Basel 13 (15), 8670. doi:10.3390/su13158670
Envelope, Y. (2022). Revisiting the building energy consumption in China: insights from a large-scale national survey. Energy Sustain Dev. 68, 76–93. doi:10.1016/j.esd.2022.03.005
Feng, F., Fu, Y., Yang, Z., and O'Neill, Z. (2022). Enhancement of phase change material hysteresis model: a case study of modeling building envelope in energyplus. Energy Build. 276, 112511. doi:10.1016/j.enbuild.2022.112511
Gugler, K., Haxhimusa, A., and Liebensteiner, M. (2023). Carbon pricing and emissions: causal effects of Britain's carbon tax. Energ Econ. 121, 106655. doi:10.1016/j.eneco.2023.106655
Guo, H., Huang, L., Song, W., Wang, X., Wang, H., and Zhao, X. (2020). Evaluation of the Summer Overheating Phenomenon in Reinforced Concrete and Cross Laminated Timber Residential Buildings in the Cold and Severe Cold Regions of China. Energies 13 (23), 6305. doi:10.3390/en13236305
Guo, S., Yan, D., Peng, C., Cui, Y., Zhou, X., and Hu, S. (2015). Investigation and analyses of residential heating in the HSCW climate zone of China: status quo and key features. Build. Environ. 94 (2), 532–542. doi:10.1016/j.buildenv.2015.10.004
He, L., and Wei, W. (2016). China building energy consumption: definitions and measures from an operational perspective. Papers 10 (5), 582. doi:10.3390/en10050582
Hu, S., Yan, D., Cui, Y., and Guo, S. (2016). Urban residential heating in hot summer and cold winter zones of China—Status, modeling, and scenarios to 2030. Energ Policy 92, 158–170. doi:10.1016/j.enpol.2016.01.032
Jin, M., Shi, X., Emrouznejad, A., and Yang, F. (2018). Determining the Optimal Carbon Tax Rate based on Data Envelopment Analysis. J. Clean. Prod. 172 (1), 900–908. doi:10.1016/j.jclepro.2017.10.127
Kim, H. G., and Kim, S. S. (2020). Development of Energy Benchmarks for Office Buildings Using the National Energy Consumption Database. Energies 13 (4), 950. doi:10.3390/en13040950
Kj, A., Th, B., and Jk, C. (2018). Development of a CO2 emission benchmark for achieving the national CO2 emission reduction target by 2030 - ScienceDirect. Energ Build. 158, 86–94. doi:10.1016/j.enbuild.2017.10.015
Kumar, S. (2016). “Towards net zero energy solar building, system, and concepts,” in 2016 First International Conference on Sustainable Green Buildings and Communities (SGBC), Chennai, India, December 18 – 20, 2016.
Li, Z., and Song, Y. (2022). Energy Consumption Linkages of the Chinese Construction Sector. Energies 15 (5), 1761. doi:10.3390/en15051761
Liu, H., Zhang, Z., Ma, X., Lu, W., Li, D., and Kojima, S. (2021a). Optimization Analysis of the Residential Window-to-Wall Ratio Based on Numerical Calculation of Energy Consumption in the Hot-Summer and Cold-Winter Zone of China. Sustainability-Basel 13 (11), 6138. doi:10.3390/su13116138
Liu, J., Bai, J., Deng, Y., Chen, X., and Liu, X. (2021c). Impact of energy structure on carbon emission and economy of China in the scenario of carbon taxation. Sci. Total Environ. 762 (4), 143093. doi:10.1016/j.scitotenv.2020.143093
Liu, Q., Huang, J., Ni, T., Chen, L., Yang, X., Liu, G., et al. (2022). Correction to: cathepsin C promotes microglia M1 polarization and aggravates neuroinflammation via activation of Ca2+-dependent PKC/p38MAPK/NF-κB pathway. Sustainability-Basel 19, 14. doi:10.1186/s12974-021-02346-1
Liu, W., Li, Y., Liu, T., Liu, M., and Wei, H. (2021b). How to Promote Low-Carbon Economic Development? A Comprehensive Assessment of Carbon Tax Policy in China. Int. J. Environ. Res. public health 18 (20), 10699. doi:10.3390/ijerph182010699
Luo, W., Zhang, Y., Gao, Y., Liu, Y., and Wang, Y. (2020). Life cycle carbon cost of buildings under carbon trading and carbon tax system in China. Sustain Cities Soc. 66, 102509. doi:10.1016/j.scs.2020.102509
Luo, Z., Liu, J., Zhang, Y., Zhou, J., Yu, Y., and Jia, R. (2021). Spatiotemporal characteristics of urban dry/wet islands in China following rapid urbanization. J. Hydrol. 601 (3), 126618. doi:10.1016/j.jhydrol.2021.126618
Martelli, E., Freschini, M., and Zatti, M. (2020). Optimization of renewable energy subsidy and carbon tax for multi energy systems using bilevel programming. Appl. Energ 267. doi:10.1016/j.apenergy.2020.115089
Meng, D., Li, Y., Zheng, J., Li, Z., Ye, H., and Li, S. (2021). Decoupling Analysis of CO2 Emissions in the Industrial Sector from Economic Growth in China. Energies 14, 5099. doi:10.3390/en14165099
Nejat, P., Jomehzadeh, F., Taheri, M. M., Gohari, M., and Abd. Majid, M. Z. (2015). A global review of energy consumption, CO2 emissions and policy in the residential sector (with an overview of the top ten CO2 emitting countries). Renew. Sustain. Energy Rev. 43, 843–862. doi:10.1016/j.rser.2014.11.066
Oreggioni, G. D., Ferraio, F. M., Crippa, M., Muntean, M., Schaaf, E., Guizzardi, D., et al. (2021). Climate change in a changing world: socio-economic and technological transitions, regulatory frameworks and trends on global greenhouse gas emissions from EDGAR v.5.0. Glob. Environ. Change 70, 102350. doi:10.1016/j.gloenvcha.2021.102350
Pan, Z., and Wang, J. (2021). Spatially heterogeneity response of ecosystem services supply and demand to urbanization in China. Ecol. Eng. 169 (4), 106303. doi:10.1016/j.ecoleng.2021.106303
Price, L., Khanna, N., and Zhou, N. (2018). Reinventing Fire: china—the Role of Energy Efficiency in China's Roadmap to 2050. Sci. Manag. 2018.
Robinson, C., Dilkina, B., Hubbs, J., Zhang, W., Guhathakurta, S., Brown, M. A., et al. (2017). Machine learning approaches for estimating commercial building energy consumption. Appl. Energ 208, 889–904. doi:10.1016/j.apenergy.2017.09.060
Shao, T., Zheng, W., and Jin, H. (2020). Analysis of the Indoor Thermal Environment and Passive Energy-Saving Optimization Design of Rural Dwellings in Zhalantun, Inner Mongolia, China. Sustainability-Basel 12, 1103. doi:10.3390/su12031103
Sun, W., Sun, Y., Xu, L., Chen, X., and Zai, D. (2022). Research on Energy Consumption Constitution and Energy Efficiency Strategies of Residential Buildings in China Based on Carbon Neutral Demand. Sustainability-Basel 14 (5), 2741. doi:10.3390/su14052741
Wang, Y. F., Li, K. P., Xu, X. M., and Zhang, Y. R. (2014). Transport energy consumption and saving in China. Renew. Sustain. Energy Rev. 29 (7), 641–655. doi:10.1016/j.rser.2013.08.104
Wang, Z., Liu, J., Zhang, Y., Yuan, H., Zhang, R., and Srinivasan, R. S. (2021). Practical issues in implementing machine-learning models for building energy efficiency: moving beyond obstacles. Renew. Sustain. Energy Rev. 143 (6), 110929. doi:10.1016/j.rser.2021.110929
Xiao, Y., Zhang, T., Liu, Z., and Fukuda, H. (2023). Thermal performance study of low-e glass Trombe wall assisted with the temperature-controlled ventilation system in Hot-Summer/Cold-Winter Zone of China. Case Stud. Therm. Eng. 45, 102882. doi:10.1016/j.csite.2023.102882
Yin, X., Dong, Q., Zhou, S., Yu, J., Huang, L., and Sun, C. (2020). Energy-Saving Potential of Applying Prefabricated Straw Bale Construction (PSBC) in Domestic Buildings in Northern China. Sustainability-Basel 12 (8), 3464. doi:10.3390/su12083464
Yu, W., Li, B., Lei, Y., and Liu, M. (2011). Analysis of a Residential Building Energy Consumption Demand Model. Energies 4 (3), 475–487. doi:10.3390/en4030475
Yu, X., and Tan, C. (2023). China’s process-related greenhouse gas emission dataset 1990–2020. Sci. Data 10 (1), 55–59. doi:10.1038/s41597-023-01957-y
Zhang, Y., He, C. Q., Tang, B. J., and Wei, Y. M. (2015). China's energy consumption in the building sector: A life cycle approach. Energy and Build. 94, 240–251. doi:10.1016/j.enbuild.2015.03.011
Keywords: building envelop, energy plus, public building, energy consumption simulation, comprehensive evaluation method
Citation: Xie J, Miao X, Dewancker BJ, Xu T, Zhao X, Shi C and Wei X (2023) Comprehensive assessment of building energy consumption in hot summer and cold winter areas based on carbon tax considerations. Front. Energy Res. 11:1250540. doi: 10.3389/fenrg.2023.1250540
Received: 30 June 2023; Accepted: 28 September 2023;
Published: 13 October 2023.
Edited by:
Jingyong Cai, Shanghai University of Electric Power, ChinaReviewed by:
Jian Zhang, University of Wisconsin—Green Bay, United StatesCopyright © 2023 Xie, Miao, Dewancker, Xu, Zhao, Shi and Wei. This is an open-access article distributed under the terms of the Creative Commons Attribution License (CC BY). The use, distribution or reproduction in other forums is permitted, provided the original author(s) and the copyright owner(s) are credited and that the original publication in this journal is cited, in accordance with accepted academic practice. No use, distribution or reproduction is permitted which does not comply with these terms.
*Correspondence: Xueyuan Zhao, MTU1ODQxMTQyMDBAMTYzLmNvbQ==
Disclaimer: All claims expressed in this article are solely those of the authors and do not necessarily represent those of their affiliated organizations, or those of the publisher, the editors and the reviewers. Any product that may be evaluated in this article or claim that may be made by its manufacturer is not guaranteed or endorsed by the publisher.
Research integrity at Frontiers
Learn more about the work of our research integrity team to safeguard the quality of each article we publish.