Abstract
To address the heat transfer degradation that occurs in the top section of horizontal pipes when sCO2 fluid flows are heated, the upper half wall with higher temperatures is particularly roughened using uniform sand-grain roughness. The SST model is validated and used to simulate the horizontal sCO2 heat transfer involving a variety of operating parameters and roughness heights. Results indicate that the half-roughen scheme is effective in significantly reducing higher temperatures of the entire upper wall and improving heat transfer homogeneity. The roughness height plays a crucial role, and an optimal value exists, which is largely influenced by the buoyancy strength and its local variations of horizontal sCO2 flows under different conditions.
1 Introduction
Supercritical CO2 (sCO2) has gained widespread recognition as an ideal working fluid for various energy and power cycles, owing to its several distinct advantages. These include favorable properties that enable higher cycle efficiency (Mendez Cruz and Rochau, 2018), reduced compression work and cycle size due to its high density, and a more accessible critical pressure () compared to water, where the supercritical state is achieved at a much higher point of . Consequently, the use of sCO2 as a heat transfer carrier has garnered significant attention for promising renewable energy sources, such as concentrating solar thermal (Yang et al., 2021), nuclear (Wu et al., 2020), and geothermal (Yalcinkaya and BIYIKOĞLU, 2012) energy.
In the proximity of the critical and pseudocritical points, sCO2 thermophysical properties undergo significant changes, leading to peculiar heat transfer behaviors. One of these behaviors is the heat transfer deterioration and heterogeneity that occur in horizontal sCO2 fluid flows. As demonstrated in the work of Kumar and Basu (2021) and Theologou et al. (2022), temperatures of the top wall are much higher, and the heat transfer is severely degraded. This impairment near the top not only negatively affects the overall heat transfer performance but also causes greater wall thermal stress, which poses a threat to the safety of heat exchange equipment. To relieve supercritical heat transfer deterioration in the top and improve uniformity over the periphery, fins (Han et al., 2022), internal ribs (Mao et al., 2022), and metal foams (Liu et al., 2015) have been added and studied. These technologies have been shown to notably improve horizontal sCO2 heat transfer; however, they also have non-negligible drawbacks, such as high manufacturing and maintenance costs and significant extra friction loss.
The use of wall roughness, particularly sand-grain roughness, has been explored to enhance turbulent heat transfer of channel flows. With the aid of direct numerical simulation (DNS), Forooghi et al. (2018) systematically studied the influence of sand-grain roughness on the convection heat transfer of turbulent channel flows and observed the augmentation of heat transfer. Latini et al. (2022) numerically modeled the increased heat transfer of coolant flow for liquid rocket engines with high surface roughness. With the help of additive manufacturing, Stimpson et al. (2016) measured heat transfer with wall roughness and found much higher Nusselt numbers than in smooth channels. Although significant heat transfer enhancements have been demonstrated in the literature, wall roughness is barely investigated in supercritical heat transfer. Zhang et al. (2020) comprehensively reviewed the enhancing technologies used for turbulent sCO2 heat transfer and suggested that wall roughness is a potential approach to effectively mitigate the deterioration. Most recently, Chen et al. (2022) first introduced sand-grain wall roughness to improve sCO2 heat transfer in a vertical tube, demonstrating remarkable mitigation of heat transfer impairment as evidenced by the drops in measured wall temperatures.
This study utilizes the uniform sand-grain wall roughness as a means to alleviate heat transfer degradation and improve homogeneity over the circumference of turbulent sCO2 flowing through horizontal tubes. The half-roughen scheme was used, which focuses specifically on the upper half surface where deterioration occurs. Computational fluid dynamics (CFD) simulations are conducted employing the SST model, which is thoroughly validated against experiments. Then, with the help of this reliable CFD tool, the influences of roughness height and typical operating parameters are investigated, and the variations and mechanisms are analyzed in detail. Moreover, the important selection criteria for roughness heights under different conditions has been identified.
2 Numerical approach
2.1 Governing equations
The horizontal sCO2 flows are solved by the steady Navier–Stokes equations, which are formulated as follows based upon the Cartesian coordinates.
Continuity:
Momentum:
Energy:where represents the fluid thermal conductivity and represents the energy dissipation term.
Due to the good capability of dealing with both the boundary and core flows, the SST turbulence model performs well in predicting supercritical fluid flow and heat transfer (Han et al., 2022; Chen et al., 2023), which is, thus, chosen in this study. The equations for the turbulence term of and are as follows:
More details on the various terms and model constants can be found in the work of Menter (1994).
2.2 Physical model and simulation methods
Figure 1 displays the horizontal round tube () used in this study, where the full three-dimensional model is built and the x- (axial) and y-axis (vertical) within the Cartesian coordinates are labeled. A development section is set precedingly, followed by the heating region of . The central angle denotes the top peak, with representing the bottom peak. To implement uniform sand-grain wall roughness, roughness height () and a fixed roughness constant (: appropriate for uniform sand-grains) are set. A mesh with a grid number of approximately was established, and the refinement was made with inserted inflation layers near the wall to guarantee . The boundary assignment and calculation strategies can be referred to in our previous work (Wang et al., 2019) on horizontal sCO2 computations. For the grid independence examination, the grid number is increased by nearly doubling it, and the deviation of averaged wall temperatures computed using different grid densities is found to be less than 1.5%.
FIGURE 1

Sketch of the simulation model.
2.3 Model validations
The experiments conducted by Chen et al. (2022) are employed for the validation of the SST model on reproducing sCO2 rough heat transfer, where the electrical discharge machining was utilized to generate sand-grain roughness onto the inner wall of a -diameter horizontal pipe and the roughness was measured using a measuring instrument of TR100. The axial wall temperature distributions were obtained within a wide operating range, and five different test cases were selected with varying operating parameters and roughness heights. The details are provided in the Table 1.
TABLE 1
| Test code | Mass flux | Heat flux | Pressure | Roughness height |
|---|---|---|---|---|
| T1 | 500 | 50 | 9 | 1.5 |
| T2 | 500 | 50 | 9 | 40 |
| T3 | 400 | 50 | 9 | 40 |
| T4 | 500 | 60 | 8 | 40 |
| T5 | 400 | 40 | 8 | 30 |
Cases to be validated from the measurements by Chen et al. (2022).
Figure 2 compares the simulated wall temperatures against the experimental data. Good consistencies were exhibited for all the cases, and the maximum deviation is within . For cases T1&T2, with the roughness height rising from of the smooth tube to , the wall temperatures decreased, indicating the improved heat transfer, and this trend was also well captured by the model. The underestimation by the computations might be attributed to the fact that in the actual physical tests, there exist wall roughness units with larger heights than the measured average value, which can result in more intensified turbulent activities.
FIGURE 2

Wall temperatures of rough sCO2 heat transfer from simulations predicted by the SST model and experimental tests by Chen et al. (2022).
2.4 Half-roughen scheme
As shown in Figure 3A for the smooth horizontal sCO2 flows, because of buoyancy effects, an obvious gap exists for the wall temperature profiles over the two peak surfaces; turbulent heat transfer impairs at the top and behaves normally around the bottom. The heat transfer difference can be also reflected by the circumferential distributions in Figure 3B, where the temperature starts to rise from the wall center line (). To mitigate the degraded heat transfer in the whole top half and then to level the peripheral distribution of wall temperature, the approach to half-roughen the horizontal pipe was applied. As illustrated in Figure 3C, the wall roughness is incorporated by particularly targeting the top half with higher values. The axial and circumferential distributions of wall temperatures of the half-roughen horizontal pipe under the same condition were added in Figures 3A, B, respectively. As seen, the top wall temperatures are significantly reduced to nearly overlap the bottom values, the degradation in the top is greatly improved, and the heat transfer becomes more homogenous.
FIGURE 3

Change in wall temperature profiles (A, B) of horizontal sCO2 heat transfer brought about by half-roughen approach (C) at , , , and .
3 Results and discussion
CFD calculations involving a range of roughness heights and operating parameters were performed to form a systematic study. The condition details are listed in Table 2. According to the classic tests on the piping flows with sand-grain roughness by Nikuradse (1950), five different values for the relative roughness heights () are used, and “” denotes the smooth tube.
TABLE 2
| Case code | Mass flux | Heat flux | Pressure | Inlet temperature () | Relative roughness height |
|---|---|---|---|---|---|
| Baseline (BL) | 400 | 18 | 7.59 | 15 | 0, 1/504, 1/252, 1/120, 1/60, 1/30 |
| G300 | 300 | 18 | 7.59 | 15 | |
| G500 | 500 | ||||
| Q8 | 400 | 8 | 7.59 | 15 | |
| Q28 | 28 | ||||
| P8.5 | 400 | 18 | 8.5 | 15 | |
| P9.5 | 9.5 | ||||
| T20 | 400 | 18 | 7.59 | 20 | |
| T25 | 25 |
Simulation conditions.
3.1 Baseline case
This section discusses the results of the baseline case, where medium-level buoyancy effects are induced under the specific condition. Since this work introduces sand-grain wall roughness aiming to relieve the top heat transfer degradation and then ameliorate heat transfer homogeneity, the wall temperature gap that directly illustrates the circumferential uniformity is presented. In addition, under the studied conditions of constant heat flux, the exhibited wall temperatures are able to well reflect the variations of the local heat transfer coefficient or Nusselt number. Figure 4 displays the axial distributions of top wall temperatures of horizontal sCO2 flowing in the smooth and various half-roughen tubes, where the bottom values of the smooth pipe are appended as a representative to exhibit the temperature difference (as well for the subsequent analysis). Circumferential profiles are not presented here due to the quite similar trends to those exhibited in Figure 3B. As can be seen from Figure 4, with the pipe half-roughened, the top wall temperatures decrease, and with the rising roughness height, the thermal entrance effect propagates further downstream. In the range of , the rising roughness height leads to a more pronounced decrease in the top wall temperatures, while a further increase beyond that range only brings around a slight difference and is likely to cause higher friction loss.
FIGURE 4

Temperature profiles along top wall of sCO2 flowing in smooth and half-roughen (with various roughness heights) horizontal tubes under the baseline condition.
Figure 5 compares the thermofluid behavior of horizontal sCO2 flowing in the smooth and half-roughen () pipes. As shown, for the smooth case (), the hotter and lighter sCO2 fluids accumulate around the top, where the boundary gets thicker, then the velocity gradient declines, and finally, the turbulence weakens. As the uniform wall roughness is added onto the top half, the accumulation is broken up and shrinks, and then, turbulent activities near the wall intensify. For the turbulence kinetic energy distribution of the half-roughen tube, it can be noted that a peak appears near the wall center line where the roughness begins. This is because when the buoyancy-induced secondary flow passes through the center point between the bottom and top halves, the abrupt change in the surface with roughness is likely to bring about strong intensification of the turbulence, which can be also reflected by the sharply dropped wall temperatures of rough sCO2 flows around , as displayed in Figure 3B.
FIGURE 5
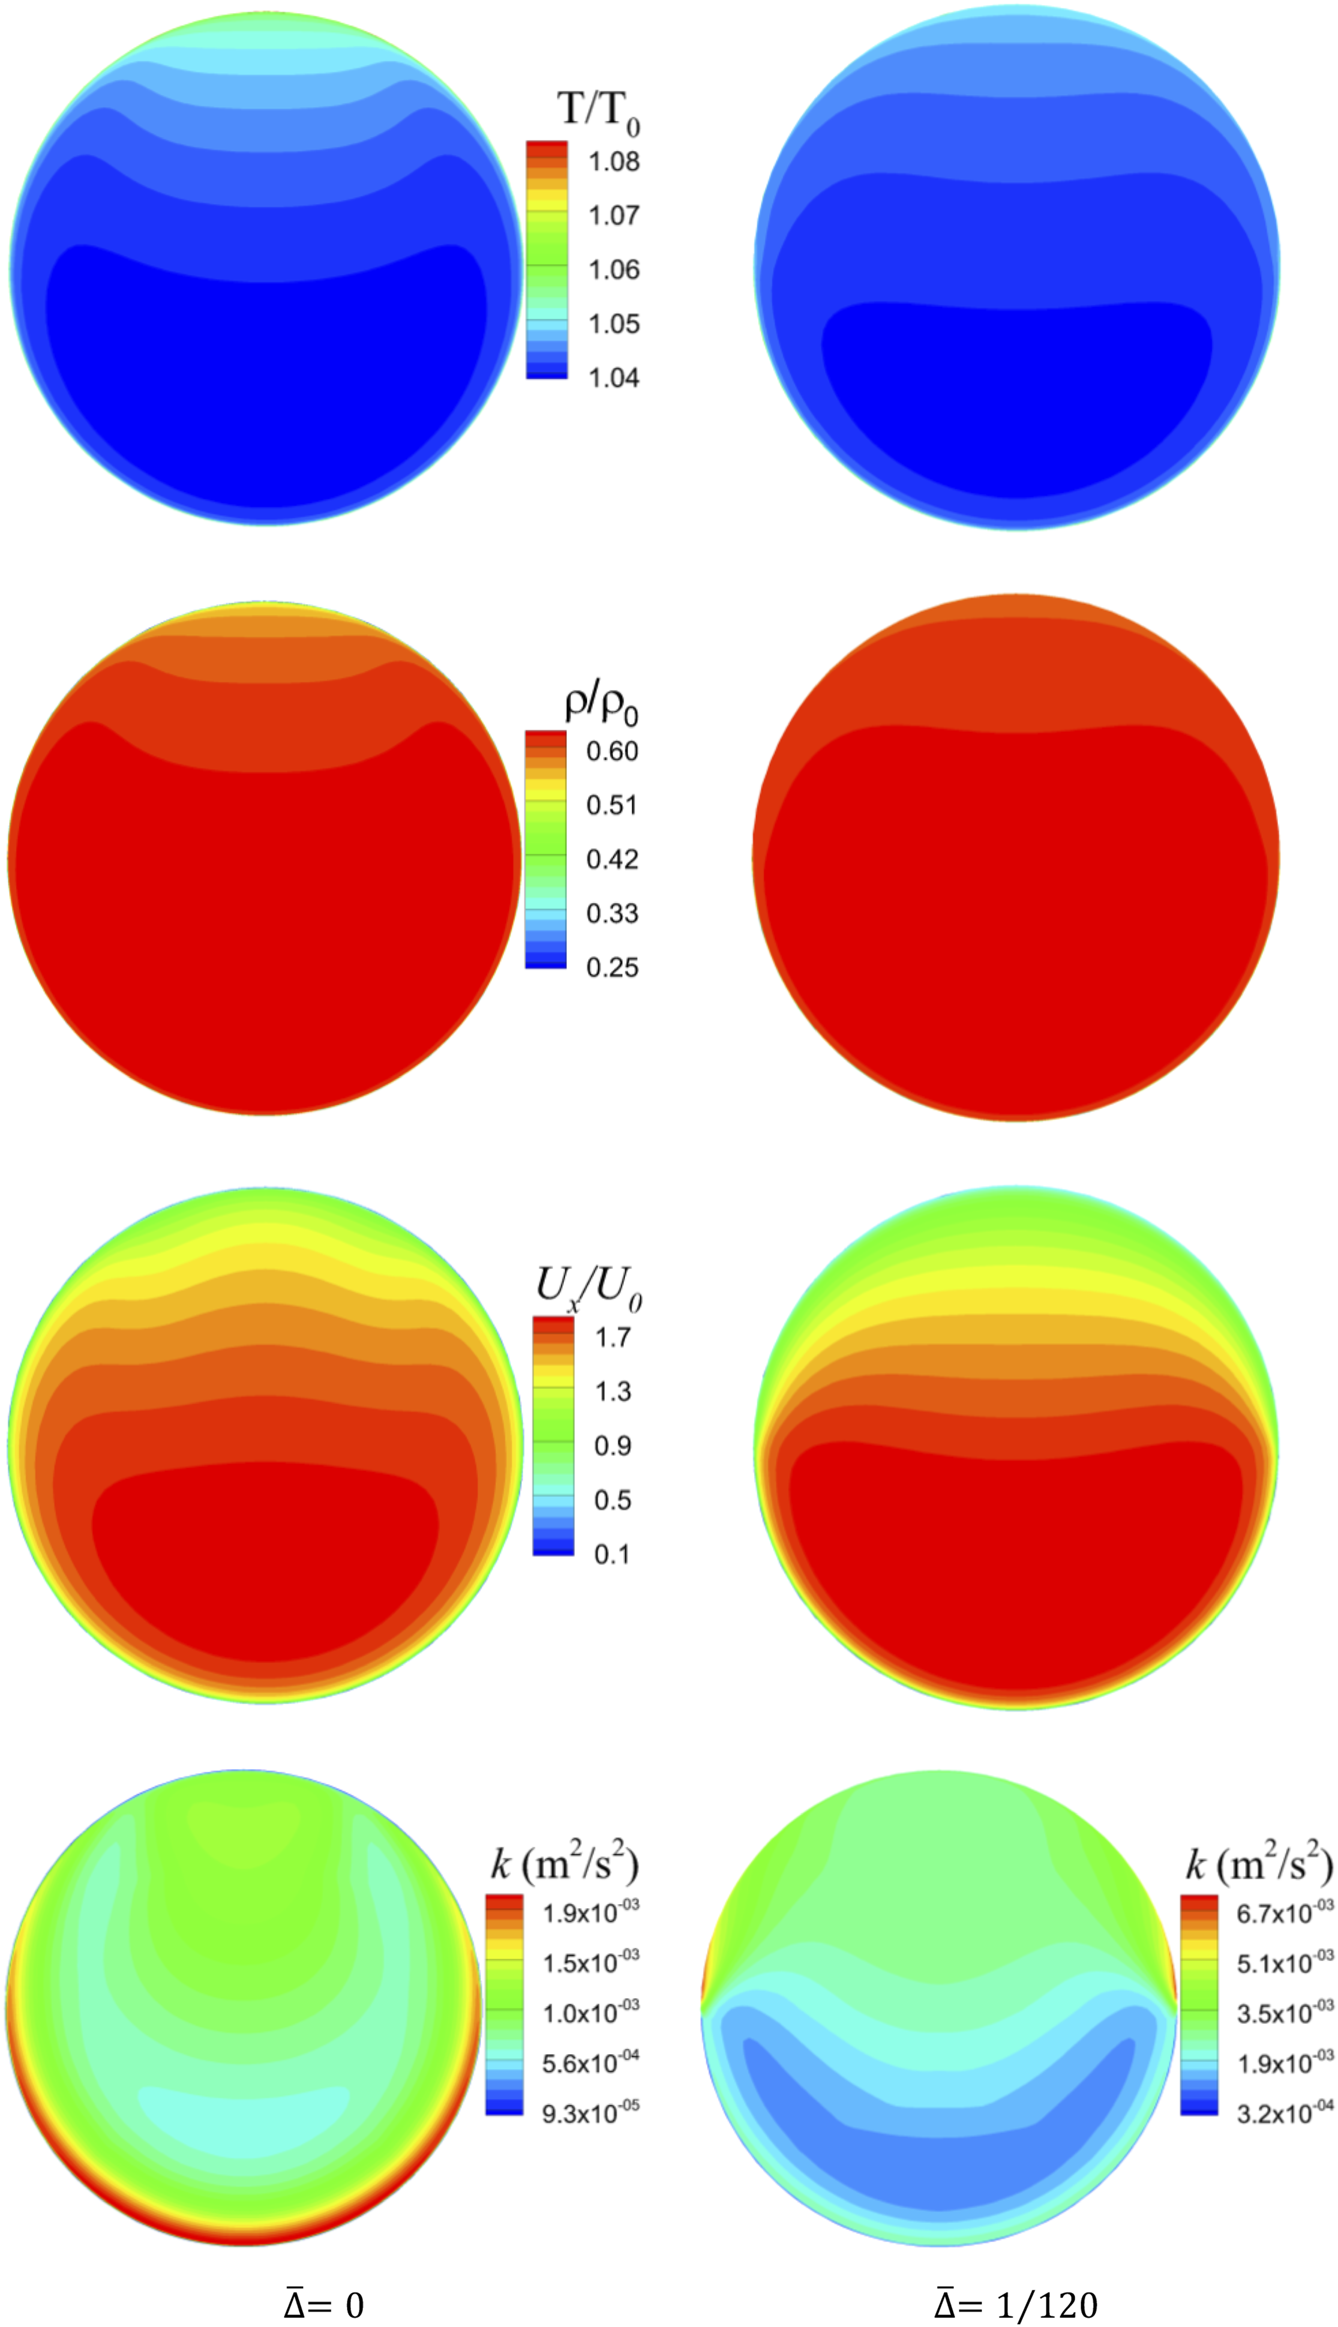
Influences of half-roughen wall roughness on thermofluids of horizontal sCO2 flows, where temperature , density , and axial velocity are normalized by inlet values.
3.2 Simulations under different operating conditions
3.2.1 Effect of mass flux
The influences of various typical operating parameters are then analyzed. Figures 6A, B show the top wall temperature distributions under two different mass fluxes, where other parameters are maintained the same as the baseline case. As can be seen, when the value of mass flux decreases to , the buoyant force increases and the gap grows between the two peak surfaces, and the optimal roughness height to homogenize the circumferential distributions increases to , which drops to for the increasing mass flux of .
FIGURE 6
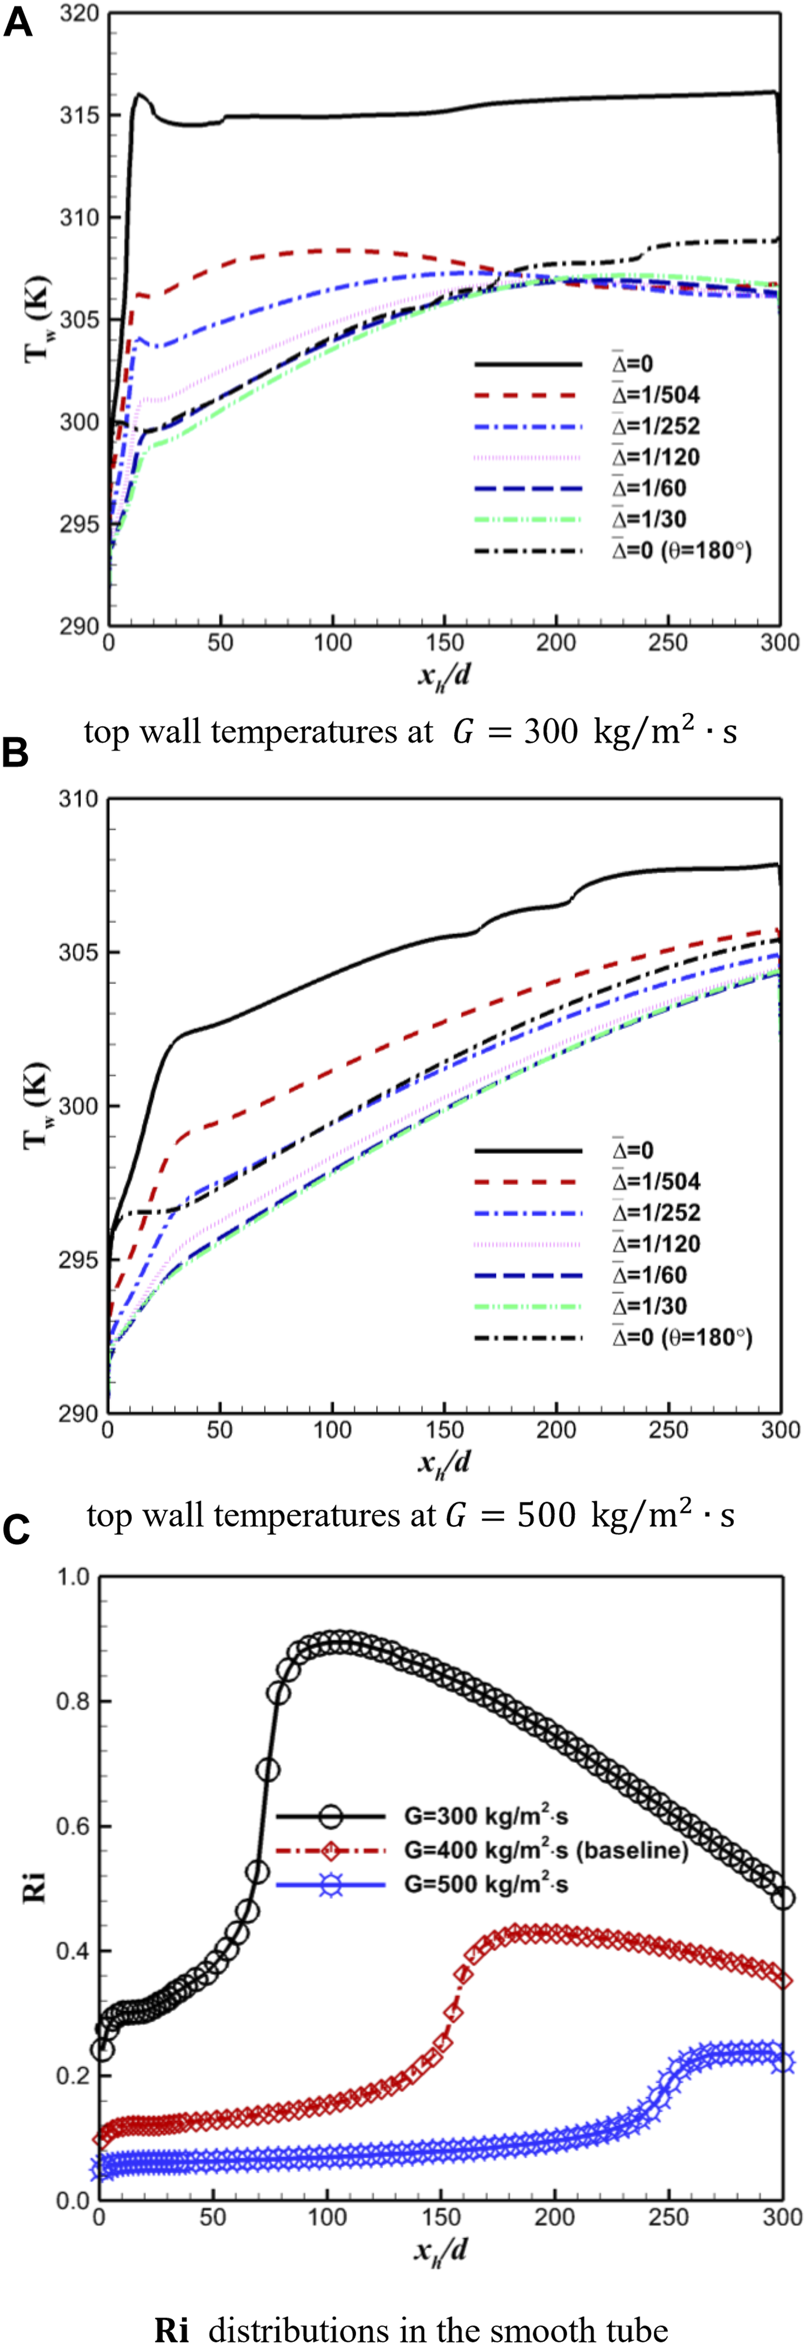
Temperature profiles along the top wall (A, B) of horizontal sCO2 heat transfer with various roughness heights and buoyancy strength variations (C) of smooth sCO2 flows under two characteristic mass fluxes.
Comparing the two sets of distributions, it is worth noting that for the higher mass flux of , the impact of roughness height () is salient through the entire sCO2 piping flows. However, the variations get complex under . In the upstream of horizontal sCO2 flows within , the rising roughness height results in greater reduction in the top wall temperature, but the values nearly remain unchanged with the varying roughness heights in the downstream at . The main reason behind these trends is that the buoyancy strength of sCO2 flows is directly related with the ratio and locally varies with the bulk stream as well.
Figure 6C presents the variations of Richardson number of smooth sCO2 flows under the two mass fluxes, where the values of the baseline case are also added for comparison. This buoyancy parameter () has been widely used in the literature (Chu and Laurien, 2016) for buoyancy quantification of heated horizontal sCO2 fluid flows. As shown, when the mass flux declines with heat flux fixed, the ratio rises, then the buoyancy strengthens, and the values augment. According to the presented influences by the buoyancy on the thermohydraulic behaviors of horizontal sCO2 fluids, the intensified buoyancy causes larger area of accumulation of low-momentum fluids in the top, thickening the boundary there that demands higher roughness height to totally break up. Considering the changing effect degree of roughness height along the bulk flow, the local distributions under each case are discussed. As shown for the high-mass-flux flow (), the buoyancy strength slowly grows and maintains the relatively low level throughout the entire flow. However, under the low mass flux of , the value first rises to the peak () and then drops in the downstream, which brings about the non-monotonic variation of boundary thickness at the top as well. Therefore, the roughness height exhibits the difference in the influence degree within the upstream and downstream. Based on the abovestated analysis, the converging point for the top wall temperature distributions of various roughness is expected to locate further downstream than the peak position to meet the lower level of buoyancy strength and the thinner boundary of high-temperature sCO2 flow, which has already been verified by the outcomes. Also, the impact of the roughness height gets suppressed in the far downstream under the baseline case, as seen in Figure 4. Figure 7A presents the temperature contours of horizontal sCO2 flowing in smooth pipe at , where three different cross sections at , and are intercepted. It can be clearly observed that the high-temperature field of accumulation shrinks with the mainstream in the downstream.
FIGURE 7
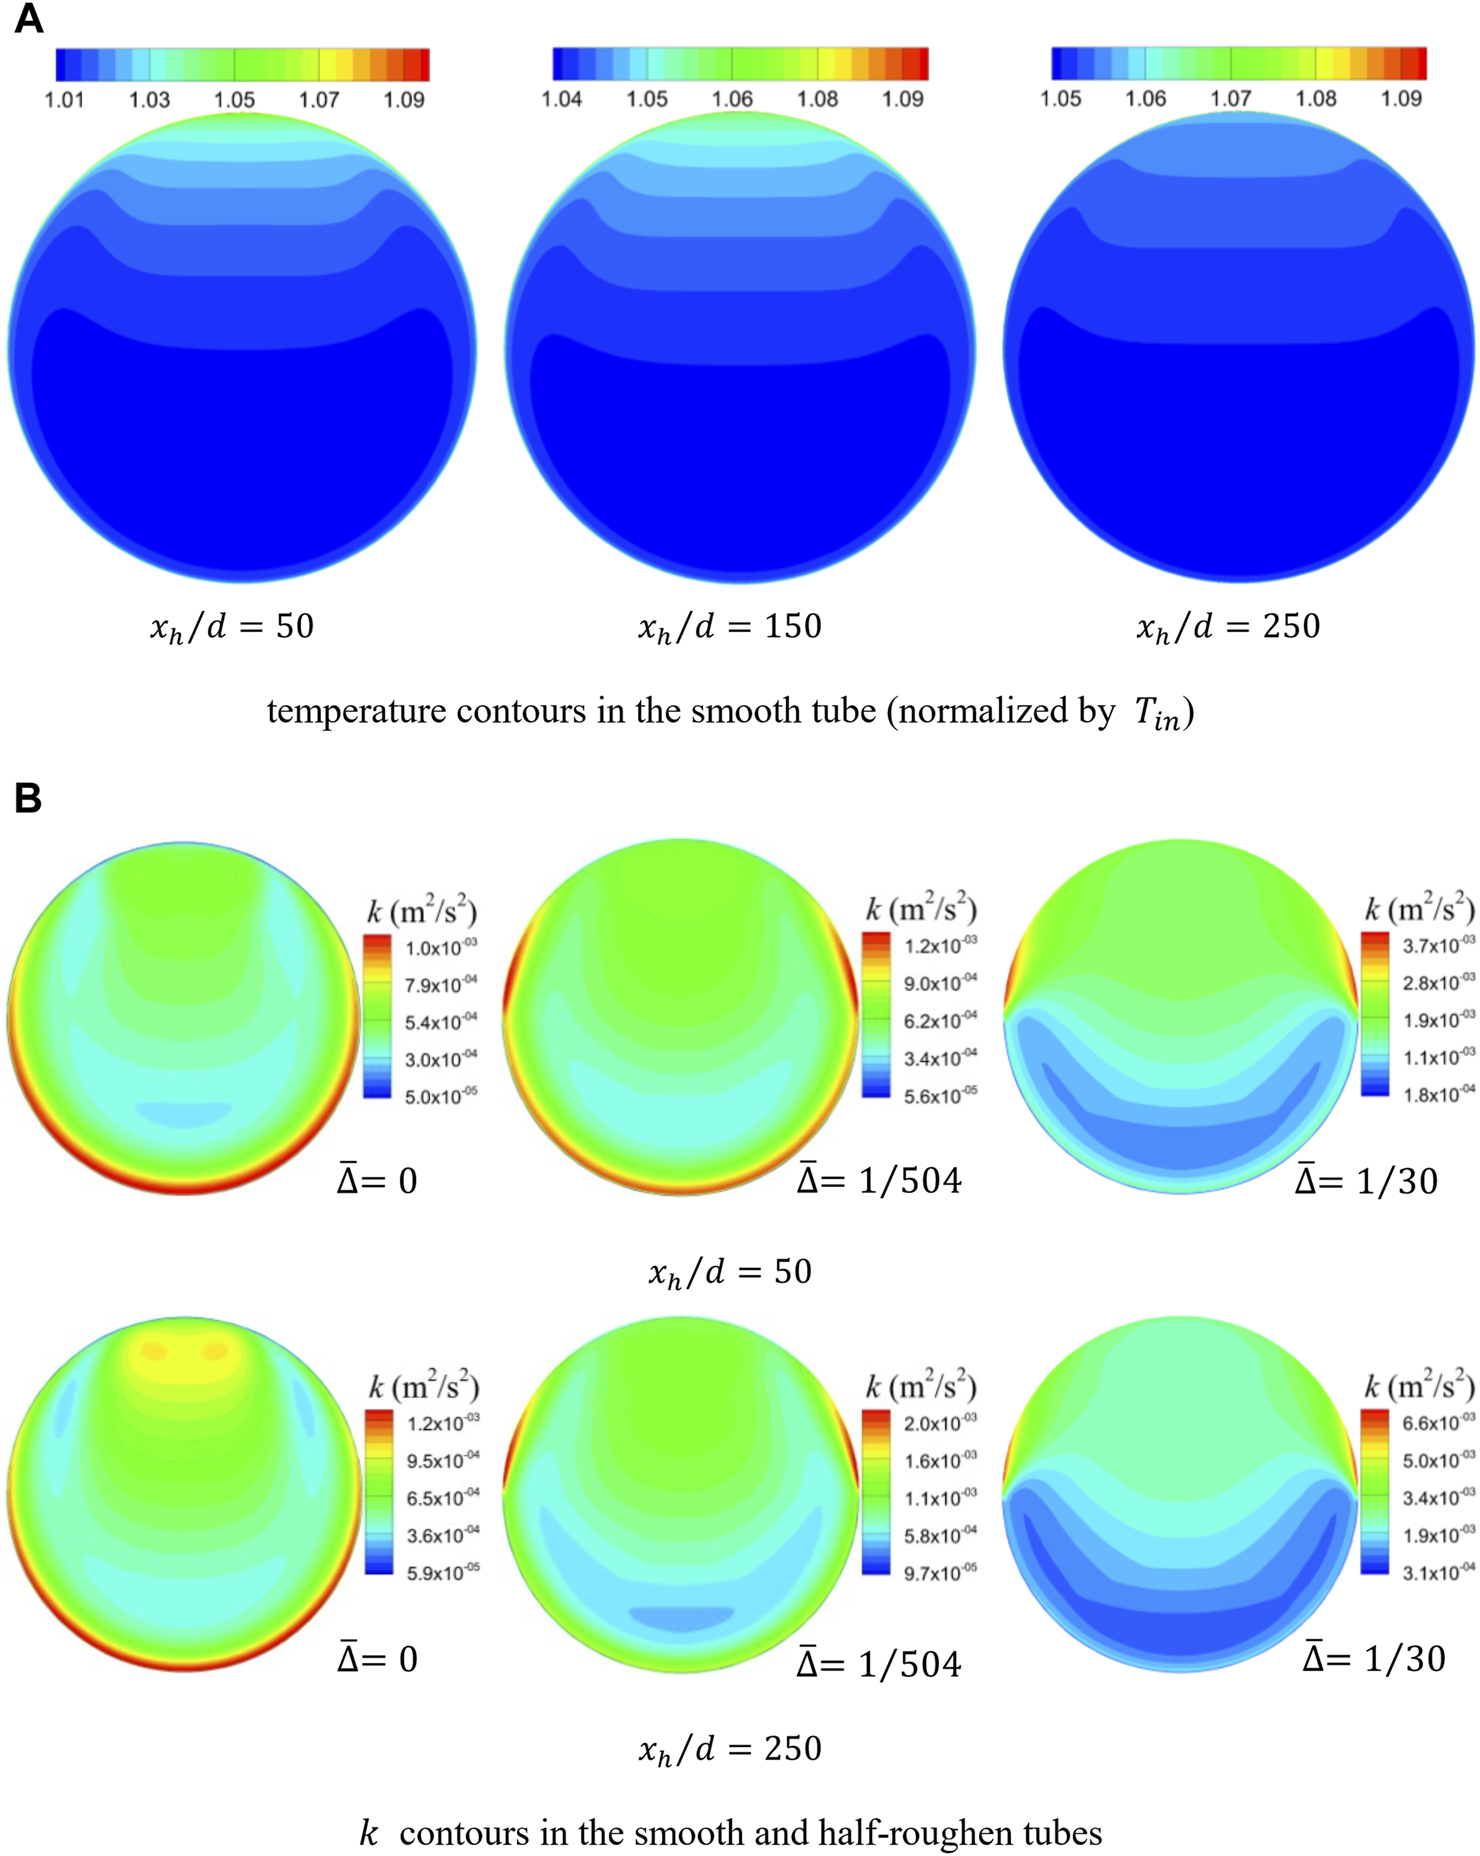
Temperature contours (A) of smooth sCO2 flows and turbulence kinetic energy contours (B) of horizontal sCO2 with various roughness heights at .
The turbulence () distributions over the cross sections of horizontal sCO2 flowing in the smooth and rough tubes at are given in Figure 7B, in which the two typical cross sections within the far upstream () and downstream () are chosen and two extreme roughness heights are issued. As shown, the turbulent activities of smooth sCO2 flows are more active near the bottom wall over both two profiles. When the roughness is incorporated, the differences in the turbulence kinetic energy distribution brought about by the roughness height are evident in the upstream region, where a large portion of the top wall is not effectively impacted by the low-height roughness and the values along the bottom wall are still much higher. However, within the downstream area, the introduced wall roughness with the lowest roughness height of is able to effectively intensify the turbulence near the entire top wall to be even higher than those over the bottom.
3.2.2 Effect of heat flux
With the change in the heat flux applied during the calculations, the calculation outcomes are displayed in Figure 8. For the low heat flux of , a roughness height of is able to close the wall temperature gap well. As the value increases up to , the temperature difference between the two peak walls remarkably grows, and similar to the trends exhibited in Figure 6A, the influence of the roughness height gets suppressed around . According to the previous analysis on the buoyancy affecting the optimal roughness height, the variation in the heat flux also brings the changing ratio, which directly determines the level of buoyancy. As exhibited in Figure 8C, for buoyancy parameter distributions of smooth sCO2 flows under these two heat fluxes, the values are low and hardly vary with the mainstream at , whereas for the high heat flux of , with a peak value emerging in the very upstream, the non-monotonic trend is exhibited for the distribution as well, which causes the difference in the impact of varying roughness height between the upstream and downstream.
FIGURE 8

Temperature profiles along the top wall (A, B) of horizontal sCO2 heat transfer with various roughness heights and buoyancy strength variations (C) of smooth sCO2 flows under two characteristic heat fluxes.
Here, it can be found that at , although the difference of smooth sCO2 flows is more significant, the incorporated roughness (even with the low roughness height) is able to greatly decline the top wall temperature, as illustrated in Figure 8B. The response of reduction to the roughness is more sensitive, which can be also reflected by the relatively larger temperature gap () in the downstream. This is because under high heat fluxes, the temperature gradient is higher in the near-wall sCO2 fluids, where the thermal boundary is generally thinner. For this thin thermal boundary, the incorporated roughness, even with the low height, is expected to generate a big jump in the turbulent activities.
3.2.3 Effect of pressure
Figures 9A, B present the top wall temperature distribution with the different roughness heights under two larger operating pressures of and . It can be concluded that the optimum height nearly remains the same as the baseline case ( in the upstream and in the far downstream), and the effect of rising operation pressure is slight. This can be explained by the fact that the pseudocritical temperature value increases with the increase in pressures, and the buoyancy strength maintains the low level within the regime of insignificant density variations, as shown in Figure 9C.
FIGURE 9
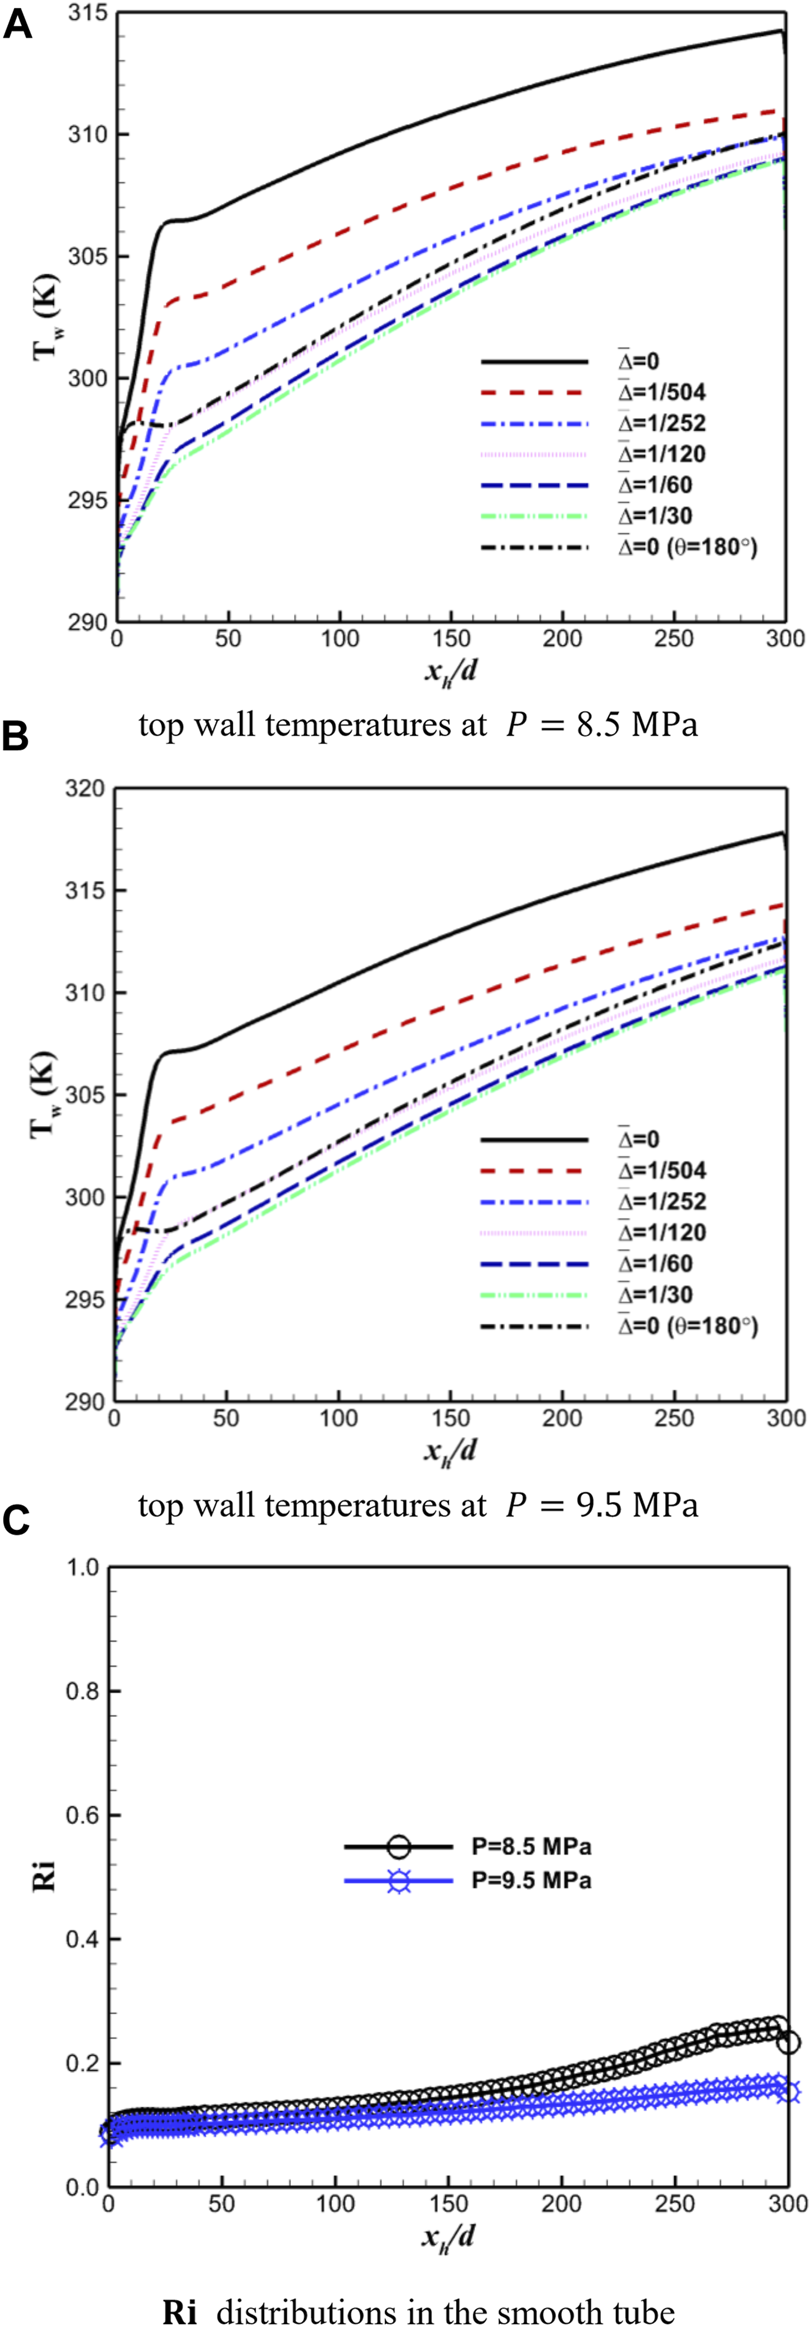
Temperature profiles along the top wall (A, B) of horizontal sCO2 heat transfer with various roughness heights and buoyancy strength variations (C) of smooth sCO2 flows under two characteristic pressures.
3.2.4 Effect of inlet temperature
With the inlet temperature increasing up to and , the outcomes are demonstrated in Figure 10. Compared to the baseline case, the optimum roughness height is still within the range of , while the influence suppression of varying roughness heights is evident in the downstream of horizontal sCO2 flows, and this happens earlier in the upstream at . The trends can be explained by the distributions of local buoyancy parameter of smooth sCO2 flows shown in Figure 10C, where the non-monotonic variations are in presence for both flow cases and the peak value emerges earlier in the upstream under the higher inlet temperature of . This is because the larger inlet temperature approaches more the pseudocritical point where the dramatic density variations are about to induce the significant buoyancy effect. Regarding the suppressed influence of varying roughness heights in the downstream, combined with the distributions presented in Figure 6A and Figure 8B, it is interesting to find that the top wall temperatures usually converged to be around the pseudocritical point () at the studied pressure. This is because when the top wall temperature drops to be around the pseudocritical point, heat transfer reinforcement caused by the favorable thermophysical properties (such as the high specific heat and thermal conductivity) rather than the changing roughness height is dominant. In particular, the molecular Prandtl number of sCO2 also reaches its peak, leading to the reinforced heat transfer, and then, the thermal boundary becomes thinner and could be totally destroyed by the small roughness size.
FIGURE 10
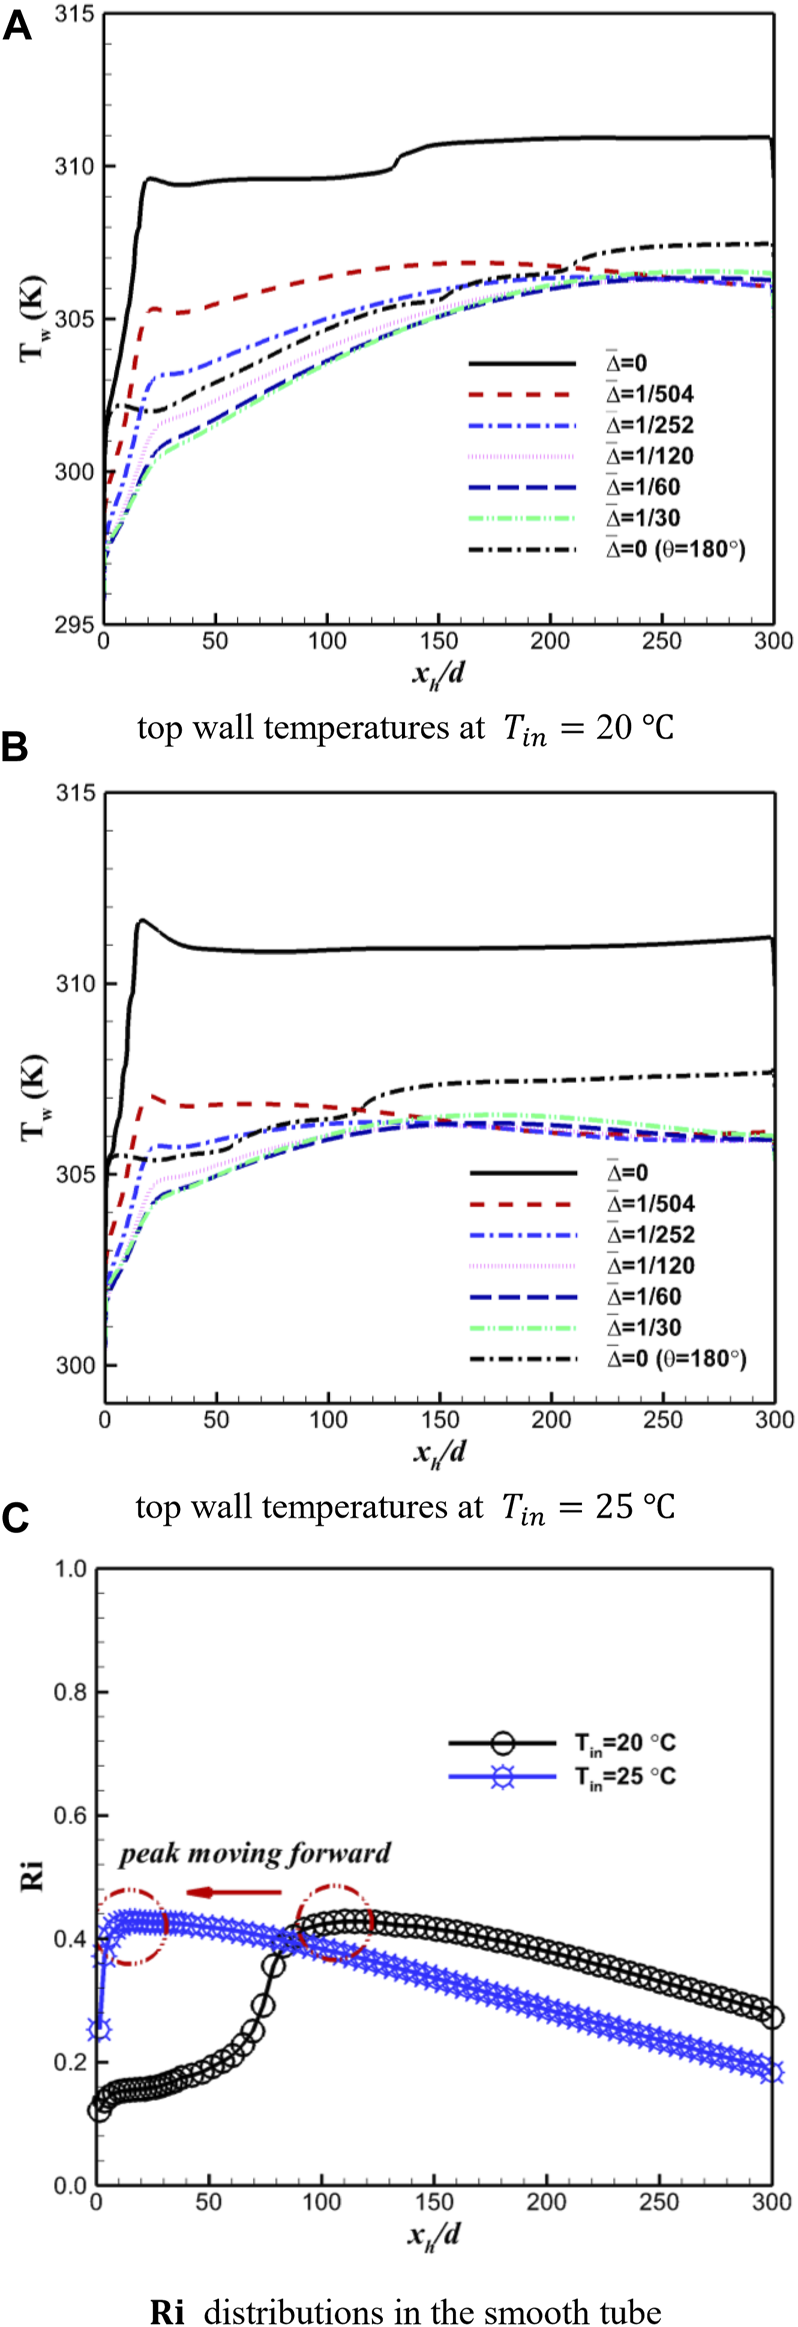
Temperature profiles along the top wall (A, B) of horizontal sCO2 heat transfer with various roughness heights and buoyancy strength variations (C) of smooth sCO2 flows under two characteristic inlet temperatures.
3.3 The overall evaluations
The buoyancy effect is critical in influencing the optimum roughness height of the half-roughen scheme to close the temperature gap between the two peak walls of horizontal sCO2 flows. Table 3 computes the average buoyancy parameter of smooth sCO2 flows under all the nine operating conditions investigated in this work, where the optimal (relative) heights of wall roughness to obtain heat transfer uniformity are listed, correspondingly. For the calculation of to demonstrate the overall buoyancy strength, the circumferentially averaged wall temperature and arithmetic mean bulk temperature are used. It can be noted that as the overall buoyancy level grows, the optimal roughness height nearly monotonously augments.
TABLE 3
| Case code | Average buoyancy parameter | Optimal roughness height (normalized by diameter) |
|---|---|---|
| BL | 0.188 | 1/252–1/120 |
| G300 | 0.925 | 1/60 |
| G500 | 0.078 | 1/252 |
| Q8 | 0.050 | 1/252 |
| Q28 | 0.563 | 1/120 |
| P8.5 | 0.144 | 1/252–1/120 |
| P9.5 | 0.124 | 1/252–1/120 |
| T20 | 0.441 | 1/252–1/120 |
| T25 | 0.399 | 1/252–1/120 |
Overall buoyancy level and optimal roughness height of various horizontal sCO2 flows.
4 Conclusion
Accounting for the particular sCO
2heat transfer features within the horizontal orientations, the circular wall was half-roughened with sand-grain wall roughness to close the significant wall temperature gap over the perimeter. With the help of the validated SST
model, numerous simulations were performed, and influences of the critical roughness height under a variety of operating conditions are discussed and analyzed in detail. The following conclusions can be drawn:
• Involving extensive operating conditions, horizontal sCO2 heat transfer with sand-grain wall roughness can be well reproduced by the SST model, and the maximum deviation is within for wall temperature predictions.
• The wall temperature gap encountered in horizontal sCO2 heat transfer can be effectively narrowed by the employed half-roughen scheme, and the circumferential homogeneity of heat transfer was greatly improved. An optimal roughness height exists, which increases with the rising ratio while hardly changing with the rising pressure and inlet temperature.
• Buoyancy is a crucial factor that determines the influences of wall roughness and its optimal height. The intensified buoyancy recirculates more low-momentum fluids to be accumulated in the top, which demands the larger roughness height to totally break. The local variations in the buoyancy strength lead to consequences as well. As the buoyancy level along the sCO2 mainstream presents a non-monotonic distribution with a peak value emerging in the upstream, the influences of varying roughness heights will be greatly suppressed in the downstream, and the top wall temperatures are likely to be converged around the pseudocritical point.
Statements
Data availability statement
The original contributions presented in the study are included in the article/Supplementary material; further inquiries can be directed to the corresponding author.
Author contributions
JY: investigation, methodology, and writing—original draft. XX: visualization and software. GT: validation and software. JW: conceptualization, funding acquisition, methodology, investigation, validation, and writing—review and editing. All authors contributed to the article and approved the submitted version.
Funding
This work was financially supported by the National Natural Foundation of China (Project No. 52006248) and Shenzhen Science and Technology Program (Project No. RCBS20210706092408013).
Conflict of interest
The authors declare that the research was conducted in the absence of any commercial or financial relationships that could be construed as a potential conflict of interest.
Publisher’s note
All claims expressed in this article are solely those of the authors and do not necessarily represent those of their affiliated organizations, or those of the publisher, the editors, and the reviewers. Any product that may be evaluated in this article, or claim that may be made by its manufacturer, is not guaranteed or endorsed by the publisher.
Abbreviations
sCO2, supercritical carbon dioxide; DNS, direct numerical simulation; and CFD, computational fluid dynamics.
References
1
Chen J. Yang S-G. Zhao R. Cheng W-L. (2022). Experimental study on the effect of wall roughness on heat transfer characteristics of supercritical carbon dioxide in vertical tubes. Int. J. Heat Mass Transf.196, 123258. 10.1016/j.ijheatmasstransfer.2022.123258
2
Chen J. Zhao R. Nian Y-L. Cheng W-L. (2023). Numerical study on the effects of cylindrical roughness on heat transfer performance and entropy generation of supercritical carbon dioxide in vertical tubes. Int. J. Heat Mass Transf.208, 124060. 10.1016/j.ijheatmasstransfer.2023.124060
3
Chu X. Laurien E. (2016). Flow stratification of supercritical Co2 in a heated horizontal pipe. J. Supercrit. Fluids116, 172–189. 10.1016/j.supflu.2016.05.003
4
Forooghi P. Stripf M. Frohnapfel B. (2018). A systematic study of turbulent heat transfer over rough walls. Int. J. Heat Mass Transf.127, 1157–1168. 10.1016/j.ijheatmasstransfer.2018.08.013
5
Han Z. Guo J. Liao H. Zhang Z. Huai X. (2022). Numerical investigation on the thermal-hydraulic performance of supercritical Co2 in a modified airfoil fins heat exchanger. J. Supercrit. Fluids187, 105643. 10.1016/j.supflu.2022.105643
6
Kumar N. Basu D. N. (2021). Role of buoyancy on the thermalhydraulic behavior of supercritical carbon dioxide flow through horizontal heated minichannel. Int. J. Therm. Sci.168, 107051. 10.1016/j.ijthermalsci.2021.107051
7
Latini B. Fiore M. Nasuti F. (2022). Modeling liquid rocket engine coolant flow and heat transfer in high roughness channels. Aerosp. Sci. Technol.126, 107672. 10.1016/j.ast.2022.107672
8
Liu Z. B. He Y. L. Qu Z. G. Tao W. Q. (2015). Experimental study of heat transfer and pressure drop of supercritical Co2 cooled in metal foam tubes. Int. J. Heat Mass Transf.85, 679–693. 10.1016/j.ijheatmasstransfer.2015.02.013
9
Mao S. Zhou T. Wei D. Liu W. Xue C. (2022). Numerical investigation on flow and thermal performance of supercritical Co2 in a horizontal ribbed tube. J. Supercrit. Fluids187, 105644. 10.1016/j.supflu.2022.105644
10
Mendez Cruz C. M. Rochau G. E. (2018). Sco2 brayton cycle: Roadmap to Sco2 power cycles Ne commercial applications. Albuquerque, NM United States: Sandia National Lab. SNL-NM.
11
Menter F. R. (1994). Two-equation eddy-viscosity turbulence models for engineering applications. AIAA J.32 (8), 1598–1605. 10.2514/3.12149
12
Nikuradse J. (1950). Laws of flow in rough pipes. J. Appl. Phys., 3.
13
Stimpson C. K. Snyder J. C. Thole K. A. Mongillo D. (2016). Roughness effects on flow and heat transfer for additively manufactured channels. J. Turbomach.138 (5), 051008. 10.1115/1.4032167
14
Theologou K. Mertz R. Laurien E. Starflinger J. (2022). Experimental investigations on heat transfer of Co2 under supercritical pressure in heated horizontal pipes. Energy254, 124171. 10.1016/j.energy.2022.124171
15
Wang J. Guan Z. Gurgenci H. Veeraragavan A. Kang X. Hooman K. (2019). A computationally derived heat transfer correlation for in-tube cooling turbulent supercritical Co2. Int. J. Therm. Sci.138, 190–205. 10.1016/j.ijthermalsci.2018.12.045
16
Wu P. Ma Y. Gao C. Liu W. Shan J. Huang Y. et al (2020). A review of research and development of supercritical carbon dioxide brayton cycle Technology in nuclear engineering applications. Nucl. Eng. Des.368, 110767. 10.1016/j.nucengdes.2020.110767
17
Yalcinkaya R. Biyikoğlu A. (2012). On usage of super-critical carbon-dioxide in a geothermal power cycle. J. Fac. Eng. Archit. Gazi Univ.27 (3).
18
Yang J. Yang Z. Duan Y. (2021). Novel design optimization of concentrated solar power plant with S-Co2 brayton cycle based on annual off-design performance. Appl. Therm. Eng.192, 116924. 10.1016/j.applthermaleng.2021.116924
19
Zhang S. Xu X. Liu C. Dang C. (2020). A review on application and heat transfer enhancement of supercritical Co2 in low-grade heat conversion. Appl. Energy269, 114962. 10.1016/j.apenergy.2020.114962
Summary
Keywords
supercritical CO2, horizontal, half-roughen, roughness height, buoyancy
Citation
Yang J, Xie X, Tang G and Wang J (2023) Computational investigation on turbulent heat transfer of supercritical CO2 in the half-roughen horizontal pipe. Front. Energy Res. 11:1249849. doi: 10.3389/fenrg.2023.1249849
Received
29 June 2023
Accepted
01 August 2023
Published
14 August 2023
Volume
11 - 2023
Edited by
Xiaohu Yang, Xi’an Jiaotong University, China
Reviewed by
Zhexi Wen, Central South University, China
Koichi Ichimiya, University of Yamanashi, Japan
Yuetao Shi, Shandong University, China
Updates
Copyright
© 2023 Yang, Xie, Tang and Wang.
This is an open-access article distributed under the terms of the Creative Commons Attribution License (CC BY). The use, distribution or reproduction in other forums is permitted, provided the original author(s) and the copyright owner(s) are credited and that the original publication in this journal is cited, in accordance with accepted academic practice. No use, distribution or reproduction is permitted which does not comply with these terms.
*Correspondence: Jianyong Wang, wangjiany5@mail.sysu.edu.cn
Disclaimer
All claims expressed in this article are solely those of the authors and do not necessarily represent those of their affiliated organizations, or those of the publisher, the editors and the reviewers. Any product that may be evaluated in this article or claim that may be made by its manufacturer is not guaranteed or endorsed by the publisher.