 Lei Wu1,2
 Chengao Zhu
95% of researchers rate our articles as excellent or good
Learn more about the work of our research integrity team to safeguard the quality of each article we publish.
Find out more
ORIGINAL RESEARCH article
Front. Energy Res. , 02 October 2023
Sec. Sustainable Energy Systems
Volume 11 - 2023 | https://doi.org/10.3389/fenrg.2023.1249092
This article is part of the Research Topic Recent Advances in Energy Systems for Sustainable Development View all 11 articles
Green economic growth is the main direction of China’s future economic development, while energy efficiency improvement—an important prerequisite for promoting the nation’s sustainable development—is a necessary way to guarantee its economic transformation and development. It is thus of great practical significance to study the relationship between energy efficiency improvement and green economic development. On the basis of analyzing the mechanism and how energy efficiency improvement influences green economic growth, this paper measures energy efficiency with the SBM model and constructs a system of green economic growth index, and verifies the relationship between energy efficiency improvement and green economic growth with an econometric model empirical analysis. It is found that, on the whole, the improvement of energy efficiency at this stage in China inhibits green economic growth. However, with the improvement of energy efficiency level, the inhibition effect gradually weakens, showing a non-linear trajectory of “inhibition–inhibition weakening”. At present, China’s energy rebound effect is still on the rise in the short term, and green economic development is restrained to a certain extent. The current expansion of the industrial sector will exacerbate resource consumption and pollutant emissions, while technological innovation and urbanization levels will alleviate the current energy rebound tension. The paper concludes with recommendations from the perspectives of the government, R&D institutions and personnel, the power sector, and urbanization.
With more than 40 years of the implementation of the reform and opening-up policy, China’s economy has witnessed a significantly steady development, creating a miracle of growth in the history of world economy. However, the traditional crude economic development approach has brought about certain consequences like high energy consumption and serious pollution, which are imposing considerable pressure on the nation’s natural resources and ecological environment. In order to achieve sustainable socio-economic development in China, a low-carbon green transformation of the economy is an inevitable choice. In 2020, China made a commitment to the world at the United Nations General Assembly that it would “peak at 2030 and become carbon neutral in 2060”; in 2021, China clearly proposed in its 14th Five-Year Plan that it would adhere to the path of green and sustainable development; and in 2022, China further emphasized the need to implement high-quality development, to unswervingly follow the ecological priority, green and low-carbon high-quality development path, and to make efforts to promote the comprehensive green transformation of economic and social development.
Energy utilization efficiency is one of the significant factors to measure the quality of contemporary economic development and an important means to achieve green economic growth. From the perspective of resource sustainability, Huang et al. (2023) pointed out that energy efficiency improvement could largely reduce the waste of resources, alleviate the contradiction triggered by resource allocation, and contribute to sustainable socio-economic development. From the perspective of environment, energy efficiency improvement can reduce pollutant emissions to the environment through energy-saving and carbon emission cuts. From the perspective of economic output, energy efficiency boost can lead to improved production efficiency and stimulate the increase of gross national product (GNP). From the perspective of international economic competition, an effective increase in energy efficiency can generate low-cost advantages for local manufacturing industries and enhance international market competitiveness. However, from the perspective of the whole economic system, energy efficiency improvement may also produce a series of negative impacts. For example, Li (2021) suggested that the energy rebound effect, which would render the potential goals of energy conservation and emission reduction unattainable, could result in the failure of environmental policies and thus hinder the prospect of green economic growth. At the same time, Zhang and Guo, (2023) found that the action mechanism of energy efficiency was also likely to be inhibited or exacerbated by other socio-economic development factors, such as the level of industrial structure, urbanization level, and technological level. Therefore, it has become urgent to explore the impact of energy efficiency improvement on green economic growth.
Earlier scholars believed that the path of economic growth was rather fixed and the main driving force came from traditional factors of production such as technology, capital and labor. The introduction of the concept of green growth has provided scholars with new research ideas, and at the same time, they pointed out the direction for optimizing economic growth. Green economic growth is influenced by a variety of factors, and is mostly analyzed from the perspectives of environmental policy, technological innovation and resource utilization on the basis of connotations. The mainstream view is that environmental policy, technological innovation and resource utilization all have positive effects on green economic growth. Wang and Liu (2015), by exploring whether energy conservation and emission reduction policies would impact green productivity from the perspective of total factor productivity (TFP), found that policies of energy conservation and emission reduction could significantly promote green economic growth and they achieved this mainly through technological progress. Zhang and Bai (2016), by including such green growth indices as technological gap, technological introduction and independent R&D in the measurement model, analyzed the green economic growth of Chinese industries, and finally found that the green economic growth in regions of high-tech levels mainly relied on independent R&D, and areas with medium and low levels of technology chiefly depended on technological introduction, while the technological gap between regions could contribute to green economic development. Li (2019) studied the levels and influencing factors of green economic growth based on data from Japan, and eventually found that technological innovation and the importance of basic education are the main drivers of green economic growth.
As a key part of resources, energy has both economic and environmental attributes, and the impact of its utilization on green economic growth has received much attention from the academic community. Current research mainly focuses on clean energy, energy consumption and energy efficiency. Regarding the greening process of energy use and green economic development, Wang and Li (2021) concluded that there was a two-way causal relationship between clean energy and green economic growth, and the positive effect of clean energy on green economic growth outweighed the negative effect. Shobande et al. (2023) argued that the development of renewable energy is important for reducing carbon emissions. Wan (2022) empirically demonstrated by the VAR model1 that the contribution of clean energy to green economic development is higher than that of other energy sources.
Differences, however, also exist in academic views on the relationship between energy consumption and economic growth. Han et al. (2004) argued that there is a two-way causal relationship between energy consumption and economic development, i.e., an increase in energy consumption can promote economic development, and economic development can also generate an increased demand for energy consumption. Another scholar Wang (2020) believed that economic growth is a one-way cause of the greening transition in energy use. In addition, some other scholars focus on energy efficiency. By definition, the increase in energy efficiency itself includes the economic benefits of energy conservation. However, quite some scholars have found through their research that this is not the case. After a study using the DSGE2 model, Wu et al. (2022) found that energy efficiency improvements can indirectly weaken economic growth through energy prices and environmental expenditures. Some scholars observed, by means of the energy rebound effect, the negative impact of energy efficiency improvement. For example, Zhang and Zhang (2014), after measuring the energy rebound, found that energy efficiency boost had generated unsatisfactory energy savings, and energy consumption had little impact on economic growth. Lin and Zhou (2022) found no significant improvement in the quality of economic growth by energy efficiency, but there was a significant U-shaped relationship between energy efficiency and the quality of economic growth. Hu et al. (2019) found that energy rebound existed in more than 60% of Chinese cities—with those in east and central China recording more obvious rebounds—and the energy rebound effect was more pronounced when technological progress improved energy efficiency. Xu et al. (2022) reported that technological progress has continuously exacerbated energy rebound in recent years, and the positive effect brought about by technological progress mainly flows to high energy-consuming sectors, making energy consumption intensity remain at a high level amidst economic growth, and virtually reaching a dilemma of low-level or inefficient energy conservation. Jia et al. (2022) analyzed carbon energy consumption and found that the carbon energy rebound effect lingered within a high rebound interval. Except for the period of relevant policy adjustment, the carbon energy rebound has shown an increasing trend for most of the time.
Although the research work on the factors influencing green economic growth is relatively mature, there is less literature directly linking energy efficiency with green economic growth. Therefore, based on the principle that the improvement of energy efficiency will bring about resource saving and new energy demand, this paper will sort out the channels and paths through which energy efficiency acts on green economic growth. It aims to measure the total factor energy efficiency and green economy level with the DEA method3 and entropy method, and to answer the question of whether energy efficiency can promote green economic growth through econometric models. The study is intended to fill the gap in research related to the role of energy efficiency in green economic growth.
Green economic growth is an economic development that integrates the concept of green development into economic growth while effectively combining resources and environment with economy. The improvement of energy efficiency demonstrates both positive and negative influencing mechanisms on green economic growth.
The mechanism of positive influence of energy efficiency improvement on green economic growth is manifested as follows. Firstly, there is the resource allocation effect. The improvement of energy efficiency can largely facilitate the reallocation of resources, reduce the possibility of resource mismatch and avoid the waste of resources. Wei and Li (2017) noted that the rational allocation of resources can effectively alleviate the pressure of resource shortage in the process of late-stage industrial development, thus improving output efficiency, maintaining sustainable economic development, and promoting green economic growth. Secondly, there is the effect of energy saving and carbon emission reduction. The improvement of energy efficiency can effectively relieve energy pressure, cut energy consumption and reduce pollutant emissions; the upgrading of energy technology can also play a positive role in combating pollution and improving the environment; while energy saving and emission reduction can effectively facilitate the development of green economy. Thirdly, increased energy efficiency promotes green energy consumption. The key to energy efficiency is to promote the development of green and clean energy technology, and the popularity of such technology can largely and widely expand the demand for new and green energy consumption, which in turn will speed up the development of green economy. Fourthly, energy efficiency boost contributes to the optimization of energy structure. Zheng et al. (2021) stated that one manifestation of lifted energy efficiency was the optimized energy structure. It can further enhance the effect of energy saving and emission reduction, and also accelerate the effect of resource allocation, thus further promoting the development of green economy.
Conversely, the mechanism of negative impact of energy efficiency improvement on green economic growth is demonstrated as follows. Firstly, it may lead to the excess of resource factors. Ji (2020) pointed out that energy efficiency enhancement could render the resource factors redundant, and the excess and underutilization of resource factors would, to a certain extent, hold back the development of green economy. Secondly, better energy efficiency may lead to an increase in energy consumption. Han et al. (2017) suggested that the improvement in energy efficiency had proved to produce the “energy rebound” effect. Amidst energy efficiency boost, energy prices may fall, thus stimulating consumption of more energy. Producers, on the other hand, tend to obtain more profits and expand production, resulting in more energy demand and eventually pumping up energy consumption. While the gross national product (GNP) has increased, the development of green economy has stalled. Thirdly, it could worsen environmental pollution. The increase in energy consumption stimulated by the boost in energy efficiency has churned out more greenhouse gases and pollutant emissions, a sudden increase in the pressure on environmental protection. With a considerable portion of resources invested in environmental conservation, the green economy is unavoidably hampered to some extent.
In the context of open innovation, be it external technology acquisition or independent technology development, Shan (2018) pointed out that there would be an obvious time lag between technological innovation and its performance in the development of social economy. Technological innovation is one of the main influencing factors for energy efficiency improvement. When the level of technological innovation is relatively low at the early stage of its development, energy efficiency can be effectively improved to promote the growth of green economy through energy saving and emission reduction. However, Wang (2020) stated that if compared with the capital cost, human cost and even energy consumption already invested in the early stage of its R&D, the improvement of energy efficiency usually failed to compensate for these resource investments, and thus the growth of green economy was inhibited. As technological innovation constantly develops, the innovative level keeps rising and the technology continues to mature, the positive externalities thus brought about not only help improve the efficiency of energy, reducing production costs, but they also yield high returns and low pollution. In addition, secondary innovation is a probable result of high-end technological development through the clustering effect of innovation factors. Liu and Sun (2008) pointed out—through an empirical study on the relationship between technological innovation, industrial structure and energy consumption—that technological innovation could also promote the upgrading of industrial structure and reduce resource mismatch, so as to increase gross national product (GNP).
Zhang and Cheng (2020) indicated that a proper industrial structure usually generated a significant influence on energy efficiency and green economic development. As the pillar of China’s economy, the secondary industry has been the main force of economic development. On the one hand, when the secondary industry accounts for a larger share of the economic structure, an improved economic level helps to increase the capital investment in the innovation of energy technology, facilitate the improvement of energy efficiency, reduce energy consumption for industries, and lower the intensity of carbon emissions. On the other hand, however, the expansion of traditional industrial sectors has brought about a huge increase in energy consumption, which has led to a relative decrease in energy efficiency. In general, due to the high pollution and high emission characteristics of the secondary industry, energy efficiency improvement can boost economic growth but ignore the green development of the economy, and instead, energy efficiency improvement actually hinders the growth of green economy. Compared with the secondary industry, the tertiary industry is less intensive in energy consumption and environmental pollution. When the proportion of tertiary industry increases in the economic structure, the investment increase in innovation elements like high technology can provide a better innovative environment for economic development and promote technological progress while improving energy efficiency. In addition, the rapid expansion and development of the tertiary sector can directly contribute to green economic growth by resolving social conflicts such as unemployment and community welfare through spillover effects and scale effects of population.
The urbanization process is an indicator reflecting the level of socio-economic development. At a low level of urbanization with a small urban population, the improvement of energy efficiency can lead to lower energy prices and reduce pollution emissions in production, but it cannot effectively stimulate the increase of consumption and production expansion, and the cost investment to improve energy efficiency may lead to lower enterprise performance and inhibit economic growth. When the urban population gradually increases, Wu (2020) argued that the effects of resource agglomeration, knowledge spillover and economies of scale would come into play, which on the one hand might stimulate competition, accelerate technological innovation, reduce resource mismatch, produce effective improvement of energy efficiency, promote industrial structure upgrading and increase output value. On the other hand, Li et al. (2021) indicated that as the economic level of urban areas improved, per capita income would go up and residents’ awareness of environmental protection increases, green consumption were likely to grow and ecological environment would improve. The above changes will generally promote energy efficiency, optimize the energy consumption structure, and reduce the pressure on resources and environment, thus effectively promoting green economic growth.
Based on the above theoretical analysis, the impact transmission mechanism of energy efficiency affecting green economic growth in this paper can be derived, as shown in Figure 1.
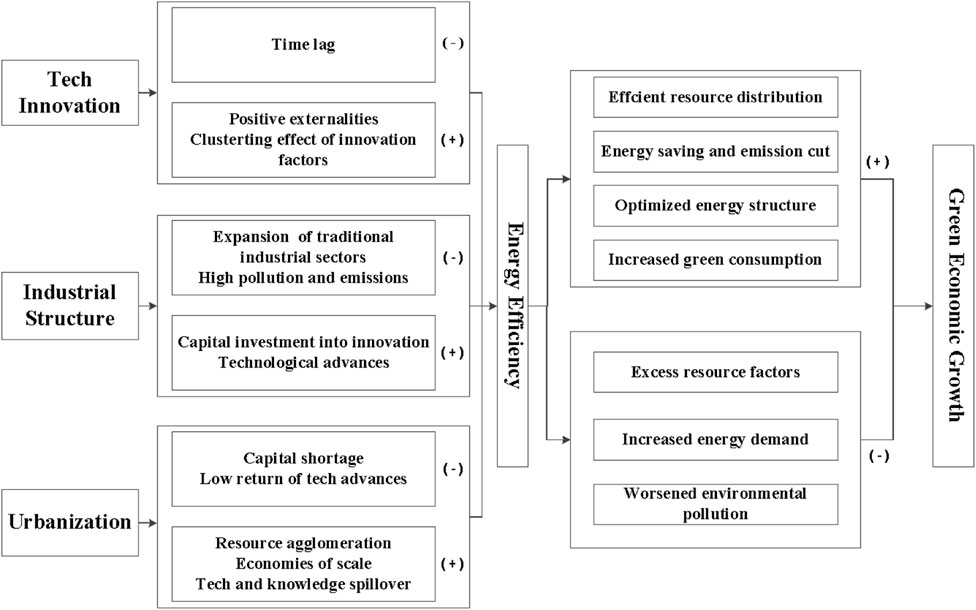
FIGURE 1. Transmission mechanism of energy efficiency affecting green economic growth.
Based on the previous analysis, and in order to explore the impact of energy efficiency on green economic growth in China, the following benchmark model is constructed, with reference to Chen et al. (2020), for this paper:
Where
Considering the possible non-linear effect of energy efficiency on green economic growth, this paper introduces the threshold model proposed by Hansen (1999). The model is constructed as follows:
Where the threshold variable is the energy efficiency, and I is an indicator function that takes 0 or 1. It takes the value 1 if the conditions in brackets are met; otherwise it takes 0. Eq. 2 is a single-threshold model, which can be changed to a multi-threshold form according to the actual demand and the threshold significance test.
In order to further test the possible mechanisms of the roles of industrial structure, technological innovation and urbanization level in the relationship between energy efficiency and green economic growth, with reference to Ye and Wen (2013), the moderating model is selected for mechanism testing in this paper, and the model is set below:
Where
Considering that the effect of energy efficiency on green economic growth may be differentially influenced by Stru, Tech and Urbn, the following model is thus set in this paper:
Where
Level of green economic growth (Gree). When scholars at home and abroad measure the index of green economic development level, most of them measure it from such three levels as economy, ecology and society. The Asian Development Bank (ADB) selected a total of 28 indicators to construct an inclusive measurement system of green growth index around three themes: economic growth, social equity and environmental sustainability; Gu (2022) selected 18 specific secondary indicators from the three dimensions of economic efficiency, social foundation and green environment. Geng and Huang (2022) subdivided the social perspective into hard conditions and soft guarantees to illustrate in more detail the degree of contribution of social development to green economic growth. Yang et al. (2022) and others introduced the government factor on the basis of the above two scholars, adding the indicator of government support; and at the second level indicators they roughly categorized the resource environment into resource consumption and environmental protection, while further subdividing social development into four categories: science and technology, education, innovation, and services.
According to the connotation of green economic growth and the actual situation of each province in China, and with reference to the relevant literature, we finally constructed a development measurement and evaluation index system for green economy consisting of three primary indicators—economic efficiency, resource environment, and society and livelihood—and 12 secondary indicators. Under the principles of scientificalness, factuality, data validity and accessibility, all the index data in this paper are selected from the National Bureau of Statistics of China (NBSC), the National Food and Strategic Reserves Administration of China (NFSRAC), the Ecology and Environment of China (MEEC), and the Ministry of Agriculture Rural Affairs of China (MARAC). The data of all the indicators are retrieved from the relevant databanks of NBSC, NFSRAC and MEEC between 2010 and 2020. The specific index system is shown in Table 1.
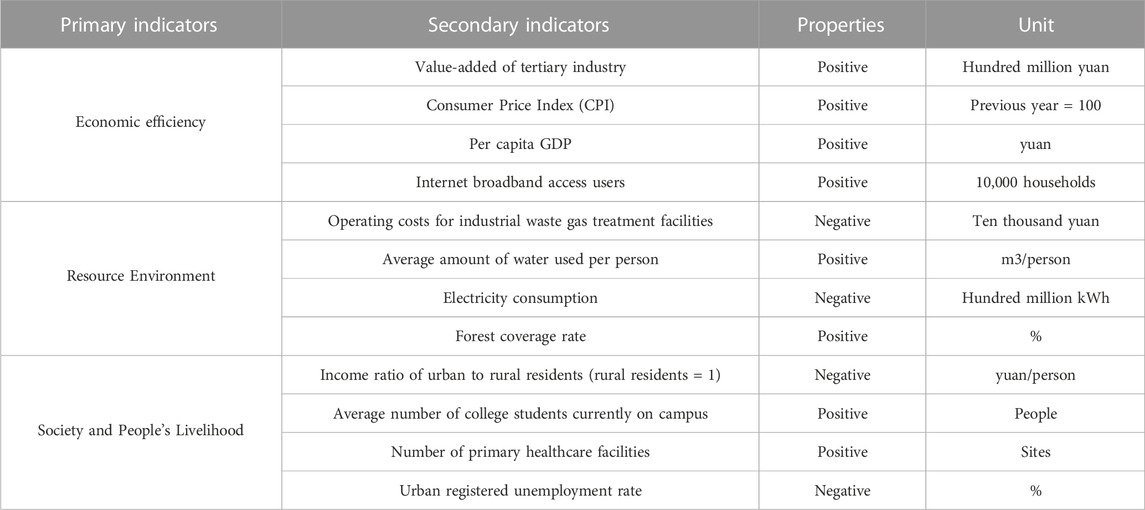
TABLE 1. Measurement index system of development level for green economy.
The results of the provincial measures of China’s green economy growth are shown in Figure 2. There are large differences in the growth level of green economy among the nation’s provinces both in time and space. From the geographical point of view, the high level of green economic growth is mostly concentrated in the eastern and southern regions, while the western and northern regions are generally at a lower level, showing the geographical distribution pattern of “strong in the east and south, weak in the west and north”; and the majority of the high-level regions are concentrated in the economically developed coastal areas, indicating that the level of green economic growth is influenced by the level of local economic development. From the perspective of time dimension, the growth of green economy in each province shows a general trend of “the east in the lead and the middle and west on the rise”. Additionally, the green growth rate in the eastern region is still progressing in the fast lane, and some provinces in the western region have also realized a gradient leap.
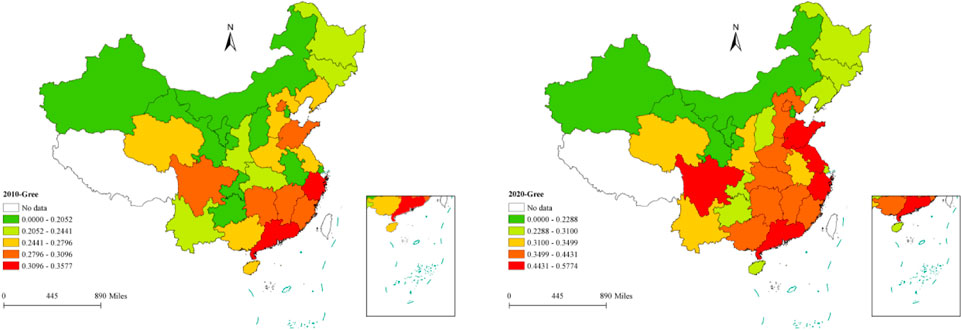
FIGURE 2. Regional differences of the level of green economic growth among 30 Chinese provinces, 2010-2020.
Energy efficiency (Effi). Energy efficiency is a comprehensive indicator reflecting the efficiency of energy consumption and energy utilization, thus the measure of economic efficiency from the input and output of energy factors alone does not fully reflect the energy utilization rate and high-quality economic development. Considering that the current energy efficiency is also influenced by other factors of production such as capital and labor, as well as the possible pollutant emissions brought about by energy consumption, this paper chooses the green total factor productivity—which allows for multifactor inputs and pollutant emissions—to measure the energy efficiency. Meanwhile, we make measurements of China’s provincial energy efficiency by drawing on Wang and Lu, (2021) practice of utilizing a super-efficiency SBM model with undesirable outputs. (See the appendix for the specific calculation process).
The input factors selected in this paper include capital, labor and energy consumption. Among them, capital is expressed with total social fixed asset investment. By referring to the study of Zhang et al. (2004), this paper adopts 2006 as the base period and estimates the capital stock with the perpetual inventory method. In the formula
Figure 3 shows the results of provincial measures of energy efficiency. It can be seen that the overall energy efficiency level of most provinces is low, and only some provinces show a more prominent level of energy efficiency. Over time, the southern and central provinces of China have experienced a rapid increase in energy efficiency, while the northern provinces are all at low levels of energy efficiency, with the gap in energy efficiency levels widening. The fact that there are quite some provinces with boosted gradients indicates that energy efficiency as a whole has been partially improved, showing a distribution pattern of “central and southern regions leading, and northern regions lagging behind”.
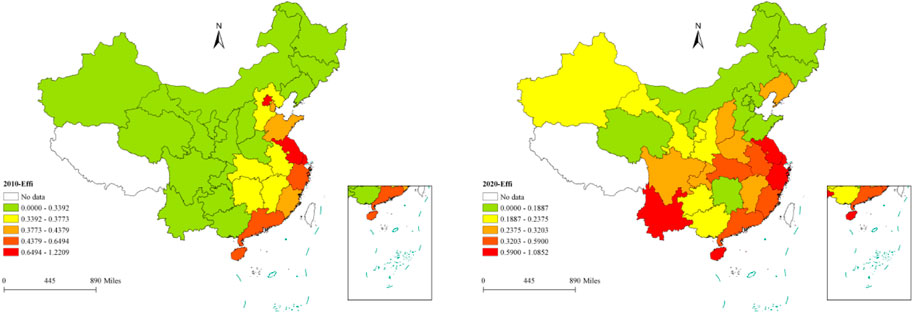
FIGURE 3. Regional differences of energy efficiency levels among 30 Chinese provinces, 2010-2020.
Urbanization level (Urbn): The promotion of urbanization can accelerate the intensive use of resources and the improvement of industrialization level, which is a general rule of socio-economic development. Generally speaking, urbanization level is closely related to both energy efficiency and green economic growth, and the level of urbanization affects energy efficiency and directly contributes to green economic growth. In this paper, we adopt the urbanization rate suggested by Hu et al. (2018) to demonstrate the level of urbanization.
Foreign direct investment (FDI): As a factor of capital production, direct investment by multinational companies also enables the transfer of technology and environmental costs, so FDI can significantly act on industries that require bulky capital and technological inputs, and eventually affect the industrial structure of China. Therefore, this paper will refer to Yuan and Xie (2014) and utilize the FDI index.
Disposable income of urban residents (Disp): Considering that disposable income of urban residents can directly affect the development of green economy and energy consumption demand of urban residents, their disposable income (its logarithm value) is used to express this control variable.
Human capital (Huma): With the gradual massification of higher education in China, human capital shows a more significant correlation with graduates bearing a bachelor’s degree, and college graduates can increasingly represent the quality level of human capital.
Environmental regulation (Envi): Standards, institutions and market incentives for the purposes of environmental protection can significantly influence the development of regional green economies, and the related expenditure on environmental protection needs to be borne by the whole society. Therefore, this paper presents, by drawing on the practice of Tao and Zhou (2015), the level of environmental regulation with the intensity of environmental regulation, which is measured by the ratio of completed investment in industrial pollution control to the added-value of the secondary industry.
Industrial structure (Stru): The secondary industry, as the largest energy-consuming sector, is the mainstay of resource consumption and environmental pollution. Therefore, this paper draws on the practice of Duan and Du, (2022) and uses the proportion of secondary industry (percentage) to measure the change in regional industrial structure.
Level of governmental financial support (Gove): The development of green economy cannot be separated from the support and guidance of the government and market managers, so this paper follows the same approach as Yang et al. (2023) and employs the proportion of financial expenditure to GDP in expressing the level of financial support.
Level of technological innovation (Tech): Scientific and technological innovation can develop synergistically with energy efficiency, and green economic development is also inseparable from the support of green innovative technology. Therefore, this paper draws on the practice of Wang et al. (2023) to interpret the level of technological innovation by the logarithm of the number of patent applications granted.
In this paper, Stru, Tech and Urbn are used as threshold variables, with the selection of specific measurement indicators already shown in the above Section: Control variables.
Considering that since 2010, the Chinese government has gradually introduced policies to start phasing out backward production capacities and increasing investment in clean energy, China’s domestic energy and environmental policies have been significantly modified. To ensure the completeness of the panel data and the robustness of the regression results, this paper selects data between 2010 and 2020 from 30 provinces (municipalities) in China to conduct the study, and after data processing, 330 data samples are obtained as province-year observations. The data used for the study in this paper are mainly from the EPS database, Wind database and the Chinese City Statistical Yearbook of the 11 years Table 2 shows the results of descriptive statistics of the variables in this paper. The results show that the mean value of Gree is 0.2897, with the maximum value at 0.5813, the minimum at 0.1021, and the standard deviation at 0.0812, indicating that there are large differences in green economic growth levels among different provinces and municipalities. The mean value of Effi is 0.4304, with the maximum value at 1.2818, the minimum value at 0.0000, and the standard deviation at 0.2751, indicating that there is a large difference in energy efficiency between different places. The rest control variables also have significant variability among different provinces.
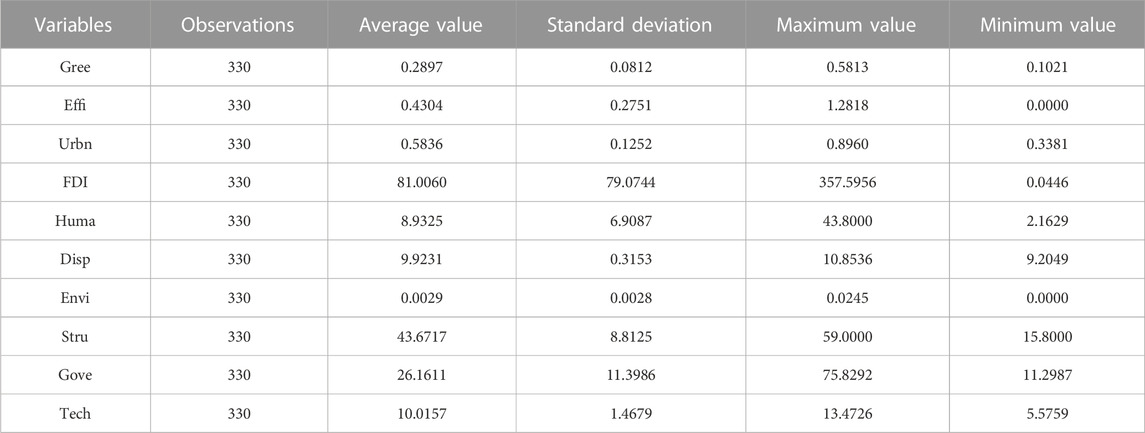
TABLE 2. Statistical description of the variables.
In this paper, the software Stata 17.0 and a benchmark regression model are applied to the selected full sample data of 30 provinces (municipalities) across China from 2010 to 2020. Meanwhile, in order to further explore the different impacts of energy efficiency improvement on green economic growth in different regions of China, this paper, referring to Liu et al. (2022), divides the selected Chinese provinces into three sub-regions, i.e., eastern, central and western regions, to probe the characteristics of the spatial distribution in different sub-regions regarding the impacts of energy efficiency on green economic growth. The results are shown in Table 3.
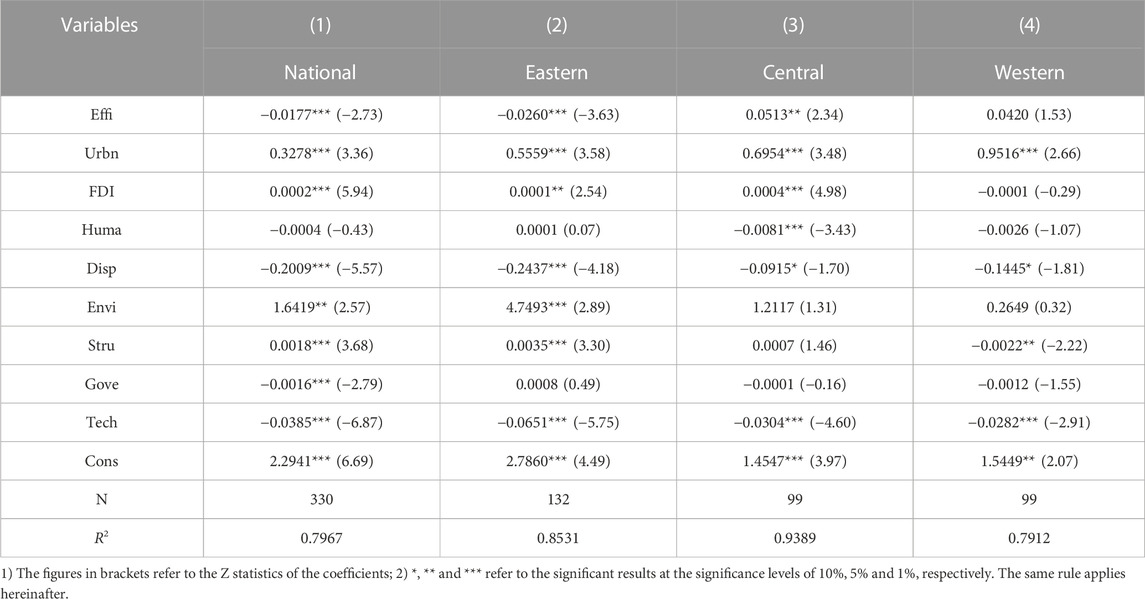
TABLE 3. Spatial distribution of energy efficiency Impacts on green economic growth.
Table 3 above reports the results of the benchmark regression model for the impact of energy efficiency improvement on green economic growth in China. In Column (1) of the table, the estimated coefficient of the core explanatory variable, energy efficiency (Effi), is significantly negative, indicating that the higher the energy efficiency, the lower the level of green economic growth. In other words, the increase in energy efficiency inhibits the green economic growth in China at this stage. The reason for this could be that China is still in the rising period of energy “rebound effect”, and the increase of energy efficiency level further increases the consumption of energy, which in turn hinders the green economic growth. Among the remaining control variables, urbanization level and FDI show a significant positive effect on green economic growth, while technological innovation, government financial support and urban disposable income show a significant inhibitory effect on green economic growth, with human capital having no effect on green economic growth.
The regression results in Columns (2)–(4) of Table 3 reflect different coefficients of energy efficiency (Effi) in relation to green economic performance in the three sub-regions. The coefficient of energy efficiency improvement on green economic growth in the eastern region is −0.0260, significant at a 1% level of significance, i.e., energy efficiency in the eastern provinces inhibits the growth of their green economies. The coefficient of the central region is 0.0513, significant at 5%, i.e., increases in energy efficiency in the middle part of China promote regional development of green economy. The coefficient of the western sub-region, however, is 0.0420, not significant, suggesting that energy efficiency boost and green economic growth there do not show a strong correlation. Generally, the eastern, central and western regions show a spatial pattern of “inhibiting—promoting—not significant”. Given the actual situation, the eastern region has a developed economy, strong technological innovation capability, advanced production technologies, and high efficiency of resource utilization, and the rebound effect there is dominant. The central region, where energy efficiency is low, however, has not reached, or incompletely reached, the rebound stage of energy efficiency improvement, and is currently in the partial rebound stages according to Hu et al. (2019). The effect of energy saving and production expansion generated by energy efficiency improvement is greater than that of increased resource consumption brought about by energy rebound, as is reflected in promoting the development of green economy. At this stage, energy efficiency improvement can reduce energy consumption, which in turn promotes the development of green economy. As for the western sub-region, the effect of energy efficiency increase on green economic growth has not been reflected yet, probably because the western provinces are rich in fossil energy resources and located in less developed areas, and thus the economic development thereof does not heavily rely on energy. Furthermore, the western region is mostly an environmental protection zone—which attaches more importance to environmental conservation than the eastern and central sub-regions—so energy efficiency improvement and green economic development are not directly interrelated.
Before estimating the threshold model, a test for the existence of the panel threshold is conducted based on Hansen, (1999) method. After 300 iterations of Bootstrap self-sustaining sampling, the results show that in the threshold model test with energy efficiency as the explanatory variable, the energy efficiency level threshold significantly passes the single threshold but fails the double and triple threshold tests. Therefore, the regression model with a single threshold is set on this basis, and the regression results are obtained as shown in Table 4.
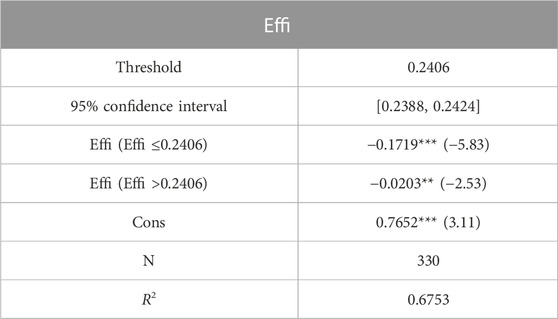
TABLE 4. Results of energy efficiency threshold.
The results in Table 4 show that with the increase of energy efficiency, the impact of energy efficiency on China’s green economic growth shows different degrees of inhibition, i.e., the impact of energy efficiency on green economic growth has a non-linear trajectory of “inhibition—weakening inhibition”. Specifically, when the threshold energy efficiency is lower than 0.2406, the coefficient of energy efficiency on green economic growth is −0.1719, which means that energy efficiency at a low level hinders the development of green economy as a whole; when energy efficiency is equal to or higher than 0.2406, the coefficient of energy efficiency on green economic growth is −0.0203, and the coefficient of energy efficiency on green economic growth is still negative, but the inhibitory effect is gradually weakening. Furthermore, as China is currently in a critical period of industrial structure upgrading and energy structure transformation, the engine of the old economic growth mode has been slightly weak and worn out; the driving power of the new economic growth mode, however, has not been fully incubated, and the economic growth is therefore lacking in strength. Moreover, the coal-based energy structure hardly fits into the current environment of green economic growth, and the rebound effect from energy efficiency improvement has not yet reached its peak, resulting in the fact that at this stage China’s green economic growth is blocked with great resistance.
It is found, on the basis of the preceding theoretical analysis, that Stru, Tech and Urbn all play a role in the influence of energy efficiency on the level of green economic growth. In order to verify this theoretical hypothesis, the moderating model is selected for empirical testing in this paper, and the regression results are shown in Table 5.

TABLE 5. Results of mechanism test.
In Column (1), the coefficients of Effi and Effi
To verify the above analysis of the moderating mechanism, this paper explores the threshold effect of industrial structure to test whether the rationalization of industrial structure contributes to green economic growth. By testing the existence of the panel threshold, it is found that the industrial structure threshold does not pass the double threshold and triple threshold tests, and there is a nonlinear single threshold relationship. Therefore, the regression model of a single threshold is set on this basis, and the regression results are obtained as shown in Table 6.

TABLE 6. Results of Industrial structure threshold.
As shown in Table 6, the effect of energy efficiency on green economic growth shows a non-linear relationship of “insignificant—inhibition” with the increase of the proportion of secondary industry in the industrial structure observations. When Stru ≤44.6, the coefficient of energy efficiency on green economic growth is 0.0047, but the p-value is not significant, which indicates that when the proportion of the secondary industry is low, the effect of energy efficiency improvement on green economic growth is not significant; when Stru >44.6, the coefficient is −0.0656, and energy efficiency significantly inhibits green economic development at the 1% level, which suggests that when the proportion of industrial manufacturing is too large, energy efficiency improvement hinders green economic development instead. The fact suggests that a large share of the secondary sectors means that most of the production factors such as technology and capital are flowing to the energy-intensive industrial manufacturing sectors. The expansion of the industrial sectors will intensify resource consumption, increase energy consumption and pollutant emissions, and thus reduce the level of green economic growth.
This paper explores the threshold effect of technological innovation to test whether technological innovation contributes to green economic growth. By testing the existence of the panel threshold, it is found that the threshold of technological innovation fails the dual-threshold and triple-threshold tests, and there is a nonlinear single-threshold relationship. Therefore, the regression model of a single threshold was set on this basis, and the regression results were obtained as in Table 7.
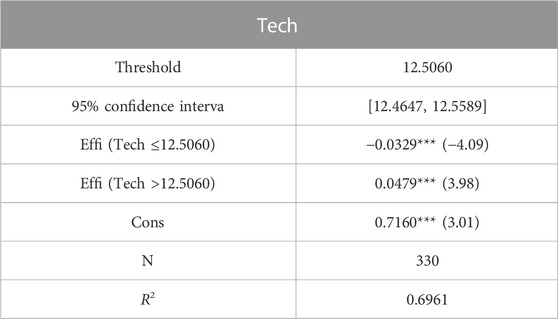
TABLE 7. Results of technological innovation level threshold.
As shown in Table 7, the effect of energy efficiency on green economic growth shows a non-linear relationship of “inhibiting—promoting” as the level of technological innovation increases. When Tech ≤12.5060, energy efficiency improvement significantly inhibits the growth of green economy, and when Tech >12.5060, energy efficiency increase significantly promotes the growth of green economy. To start with, in light of the characteristics of technological innovation, the effectiveness of technological innovation has a time lag. At the initial low level of technological innovation, in order to achieve the progress of sci-tech innovation, the demand for energy resources in enterprises increases, and a large amount of capital, manpower, resources and other innovation factors are invested, only to obtain a small increase in energy efficiency. The effect of energy saving and emission reduction at this stage is not noticeable, with the effective growth of the green economy inhibited. Next, the improvement of technological innovation level will stimulate industrial production and increase energy demand, while the boost of energy efficiency is limited by the bottleneck of technological innovation, and the overall downward trend of green economic development level is observed when comparing the two. In the later stage, with the continuous level improvement of technological innovation, the industrial structure is optimized, the energy efficiency improvement effect is prominent, and the green and low-carbon technology is continuously moving towards maturity and application, which will further benefit the green economic growth.
This paper explores the threshold effect of technological innovation to test whether the level of urbanization contributes to green economic growth. By testing the existence of the panel threshold, it is found that the threshold of urbanization level fails the triple-threshold test, while the double thresholds pass the significance test with a nonlinear double-threshold relationship. Therefore, the regression model of the double thresholds is set on this basis, and the regression results are obtained as shown in Table 8.
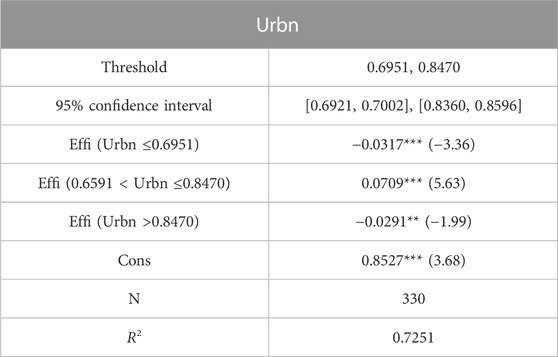
TABLE 8. Results of urbanization level threshold.
The regression results of the double panel thresholds are shown in the above table. The results indicate that there is a significant double-threshold effect of urbanization between energy efficiency and green economic growth, showing an inverse “N-type” non-linear effect. When Urbn ≤0.6951, energy efficiency improvement shows a significant negative effect on green economic growth. When 0.6951 < Urbn <0.8470, energy efficiency increases, making a significant contribution to green economic growth. When Urbn >0.8470, energy efficiency enhancement significantly inhibits the green economic growth in China.
In light of the actual analysis, when the level of urbanization is low, the economic growth rate and range are restricted, green technologies are developed to some extent but incompletely, energy efficiency enhancement is limited, and the high cost of putting green low-carbon technologies into use may lead to the closure or bankruptcy crisis of small- and medium-sized enterprises. As urbanization deepens, the per capita income of residents increases, and public awareness of environmental protection strengthens, and the consumption structure can be effectively influenced. This, in turn, drives the product structure toward high-tech and green directions, and improves the energy efficiency in line with the demand for green development. Resources are effectively allocated, pollution emissions are reduced, and production efficiency is improved, jointly promoting the green and quality growth of the national economy. However, when urbanization develops faster than necessary, urban diseases emerge. For example, energy efficiency improvement stimulates residents’ energy consumption, more energy will be consumed. Population concentration also leads to lower urban operation efficiency and increases energy consumption, both of which exacerbate the pressure on resource supply and inhibit the development of green economy.
As there may be some bias in the previous regression results, this paper further employs endogeneity tests and sample subintervals for the following robustness tests.
A key point of empirical research is to address the endogeneity issue. As for the research content of this paper, there may be reverse causality between energy efficiency and green economic growth, which could influence each other. On the other hand, there are plentiful exogenous factors affecting green economic growth, and some influencing variables are likely to have been omitted. As the systematic GMM method4 is an important method to test the endogeneity issue, this paper constructs a two-step systematic GMM method for endogeneity test to deal with the possible endogeneity slip in order to ensure the reliability of the empirical results. The model setup is shown as follows:
Where
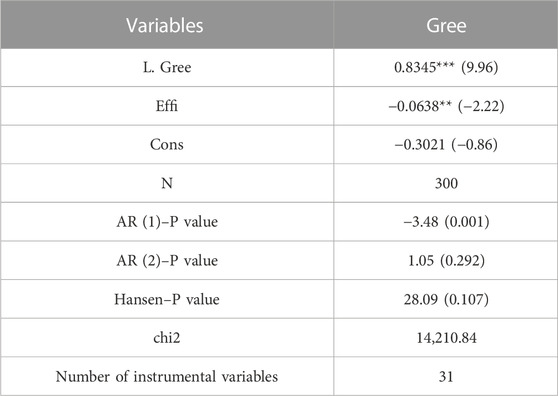
TABLE 9. Endogeneity test results.
The Arellano-Bond test results in Table 9 show that AR (1) passes the 1% significance level test and AR (2) fails the significance test. It suggests that there is first-order autocorrelation in the differences of the model perturbation terms, which do not pass second-order autocorrelation, i.e., the perturbation terms are not auto-correlated, and thus estimation with the systematic GMM model is feasible. Additionally, the results of Hansen’s test show that the original hypothesis cannot be rejected, indicating the validity of all instrumental variables. Therefore, all the instrumental variables selected in this paper are rational and valid.
The coefficient of L. Gree is positive and significant at the 1% level of significance, indicating that green economic growth in the previous period is highly positively correlated with that in the current period, and that green economic growth is fairly persistent over time. The coefficient of Effi is significantly negative, indicating that the energy efficiency has a dampening effect on green economic growth, a result that remains largely consistent with the regression results of the benchmark model, confirming the robustness of the conclusions in the paper.
As the COVID-19 pandemic has imposed a lingering negative impact on the energy industry and green sectors, as well as on many others, this paper draws on Duan and Zhuang, (2021) practice, and chooses to exclude the sample data for 2019 and 2020, the early stage of the pandemic, to further examine the model’s estimation results for the sample subintervals. The results are shown in Table 10.
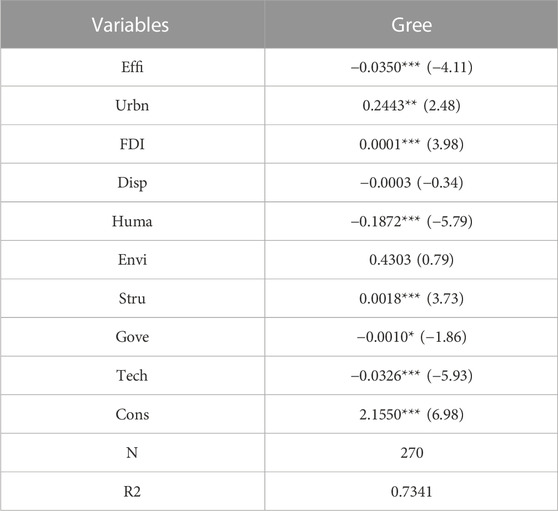
TABLE 10. Model estimation results for sample subintervals.
The estimation results of the sample subintervals in Table 10 show that the energy efficiency continues to exert a significant negative effect on China’s green economic growth, and the remaining control variables stay largely consistent, indicating the validity of the theoretical hypotheses in this paper and further confirming the robustness of the benchmark regression results.
This paper, by constructing an analysis of the impact mechanism of energy efficiency improvement on green economic growth, has explained the linear as well as nonlinear effects between them, and studied the impact of energy efficiency improvement on green economic growth from different perspectives such as technological innovation, industrial structure and urbanization level, before empirically verifying the relevant theories based on provincial-level regional panel data in China. Three major findings are reached. 1) On the whole, energy efficiency improvement is currently inhibiting the growth of its green economy. However, as the energy efficiency level increases, the inhibitory effect gradually weakens, showing a non-linear trajectory of “inhibition—weakening inhibition”. 2) In the short term, China is still in the expansion stage of energy consumption, and the development of its green economy is thus limited to a certain extent. 3) The expansion of the nation’s industrial sectors will intensify resource consumption and pollutant emissions, while technological innovation and urbanization levels can ease the current strenuous status of energy rebound.
Based on the aforementioned research findings, this paper presents the following policy implications. Firstly, with regard to the government, there is a need to intensify efforts towards energy structure reform while concurrently promoting energy efficiency. Given the presence of the energy rebound effect, it is crucial to adjust the energy consumption structure based on the specific attributes of various energy sources and the distinct characteristics exhibited by different regions. In alignment with such adjustments, it becomes essential to optimize emission reduction strategies. Furthermore, there exists an opportunity to pursue the enhancement of efficiency by utilizing non-renewable conventional energy sources, including coal, charcoal, and oil. Simultaneously, endeavors to broaden the scope and utilization of cleaner energy sources, such as hydropower and solar energy, should be undertaken. With a combination of measures such as energy pricing, taxation, and subsidies, certain regions can employ administrative and market mechanisms to alleviate their reliance on traditional energy consumption patterns.
Secondly, in order to foster a greater inclination among R&D institutions and personnel to enhance their investments in eco-friendly innovation technologies, it is imperative for research organizations to augment their financial commitments towards green technologies. At the same time, they should introduce novel technological advancements and innovative management approaches while effectuating institutional reforms. Concurrently, it is imperative to prioritize the cultivation of relevant technical expertise and foster the intra-regional mobility of proficient practitioners, thus resulting in a synergistic confluence of industry, academia, and research. This shall afford a heightened fluidity to the process of industrializing green innovation technology. Additionally, magnifying collaborations with green innovation enterprises shall effectively mitigate the barriers constraining enterprises’ endeavors in embracing eco-friendly transformations.
Thirdly, for the electricity industry, it is crucial to prioritize the feedback effect of industrial and technological structure, thereby avoiding the energy-saving trap caused by an excessive concentration of production factors in high energy-consuming sectors. By employing market mechanisms to eliminate outdated capacity and reorganize surplus productivity in high energy-consuming sectors, we can guide advanced technologies and supportive policies towards low energy-consuming sectors, thus reducing the counteractive rebound effect of energy consumption. Furthermore, enhancing the deep integration of the manufacturing industry and the modern service sector can effectively reduce resource waste and energy consumption, thereby offering greater development opportunities for environmentally friendly industries like renewable energy.
Lastly, it is imperative to maintain an appropriate level of urbanization. High-quality urban development should be firmly grounded in reality, avoiding the pitfalls of urbanization that are detached from industrial and agricultural foundations or overly inflated by the tertiary sector. By intensifying the efficient use of resources through urban economics, it is possible to facilitate the optimization of industrial structures, as well as the concentration of human and financial capital. This not only enhances energy efficiency but also augments the potential for regional green growth. Strengthening the provision of public services in cities can mitigate social inequities that may otherwise obstruct the process of sustainable growth.
Publicly available datasets were analyzed in this study. This data can be found here: EPS database, Wind database and the Chinese City Statistical Yearbook.
LW: Conceptualization; Investigation; Project administration; Formal analysis; Resources; Supervision; Methodology; Writing–original draft; Writing–review and editing. CZ: Conceptualization; Investigation; Data curation; Methodology; Software; Formal analysis; Writing–original draft; Writing–review and editing. MC: Supervision; Methodology; Formal analysis; Writing–review and editing. WD: Supervision; Methodology; Formal analysis; Writing–review and editing. GW: Supervision; Formal analysis; Writing–original draft; Writing–review and editing. All authors contributed to the article and approved the submitted version.
This work was supported by a grant of the general program from Hubei Research Center for Eco-Civilization (grant numbers STZK 2023Y05) and the soft science research base of regional innovation capability monitoring and analysis in Hubei Province (grant numbers HBQY 2023z02).
This paper benefited from years of thinking about these issues and the discussion with many colleagues related to energy economics at that time.
The authors declare that the research was conducted in the absence of any commercial or financial relationships that could be construed as a potential conflict of interest.
All claims expressed in this article are solely those of the authors and do not necessarily represent those of their affiliated organizations, or those of the publisher, the editors and the reviewers. Any product that may be evaluated in this article, or claim that may be made by its manufacturer, is not guaranteed or endorsed by the publisher.
1VAR model(Vector Autoregressive Model) is a model of unstructured system of equations used to estimate the dynamic relationship between multiple variables.
2DSGE (Dynamic Stochastic General Equilibrium) model is an equation for the optimal behavior of each economic agent in the face of a variety of different environmental constraints, coupled with market conditions, before obtaining the final equation for the overall economic satisfaction in the uncertain environment.
3DEA method(Data envelopment analysis)is expressed as a ratio of outputs to inputs. It is primarily a quantitative analysis method for evaluating the relative effectiveness of comparable units of the same type on the basis of multiple input indicators and multiple output indicators, utilizing the method of linear programming.
4GMM (Generalized Method of Moment) is a model that explains economic phenomena based on a finite number of mathematical parameters. It uses optimal estimation techniques to fit large amounts of data to predict and analyze the patterns hidden behind them.
Chen, Q. Y., Lin, S. T., and Zhang, X. (2020). The effect of China’s incentive policies for technological innovation: incentivizing quantity or quality. China Ind. Econ. 385 (4), 79–96. doi:10.19581/j.cnki.ciejournal.2020.04.004
Duan, D. Z., and Du, D. B. (2022). Spatial and temporal distribution characteristics and influencing factors of green technology innovation in Chinese cities. Acta Geogr. Sin. 77 (12), 3125–3145. doi:10.11821/dlxb202212012
Duan, J. S., and Zhuang, X. D. (2021). Financial investment behavior and enterprise technological innovation—Motivation analysis and empirical evidence. China Ind. Econ. 394 (01), 155–173. doi:10.19581/j.cnki.ciejournal.2021.01.009
Geng, J., and Huang, P. P. (2022). Measurement and spatial variability analysis of provincial green economy development in China. Invest. Entrepreneursh. 33 (21), 33–36.
Gu, S. T. (2022). A study on the measurement and spatial and temporal evolution of green economy development in China: A TOPSIS evaluation model based on mahalanobis distance. China Price 402 (10), 3–7.
Han, Y., Zhai, J. L., and Shi, J. H. (2017). “Research on provincial energy rebound effect in China,” in Proceedings of the 2017 2nd International Conference on Civil, Transportation and Environmental Engineering (ICCTE 2017) (Atlantis Press).
Han, Z. Y., Wei, Y. M., Jiao, J. L., et al. (2004). On the co-integration and causality between Chinese GDP and energy consumption. Syst. Eng. 22 (12), 17–21.
Hansen, B. E. (1999). Threshold effects in non-dynamic panels: estimation, testing, and inference. J. Econ. 93 (02), 345–368. doi:10.1016/S0304-4076(99)00025-1
Hu, A. J., Guo, A. J., Zhong, F. L., et al. (2018). Can the high-tech industrial agglomeration improve the green economic efficiency of the region? China population. Resour. Environ. 28 (09), 93–101. doi:10.12062/cpre.20180404
Hu, D. L., Shen, H., and Liu, Z. (2019). Study on the spatial-temporal evolution and formation mechanism of energy rebound effect in Chinese cities. China Soft Sci. 347 (11), 96–108.
Huang, Y. H., Cu, J. B., and Lin, S. (2023). Green technology innovation under China’s new development concept: the effects of policy-push and demand-pull on renewable energy innovation. Soc. Sci. China 44 (1), 158–180. doi:10.1080/02529203.2023.2192093
Ji, Z. (2020). Does factor market distortion affect industrial pollution intensity? Evidence from China. J. Clean. Produc-tion 267, 122136. doi:10.1016/j.jclepro.2020.122136
Jia, R. N., Shao, S., Du, K. R., et al. (2022). Spatial-temporal pattern, dynamic evolution, and driving factors of carbon rebound effect in China:based on improved stochastic frontier model of carbon emission. China Soft Sci. 384 (12), 23–34.
Li, X. L. (2019). Regional green growth: measurement, decomposition and driving factor. J. Hebei Univ. Econ. Bus. 40 (5), 24–34. doi:10.14178/j.cnki.issn1007-2101.2019.05.004
Li, X. Y. (2021). Study on the impact of energy rebound effect on carbon emission reduction at different stages of urbanization in China. Ecol. Indic. 120 (7), 106983. doi:10.1016/j.ecolind.2020.106983
Li, X. Y., Zhang, D. Y., and Zhang, T. (2021). Awareness, energy consumption and pro-environmental choices of Chinese households. J. Clean. Prod. 279 (5), 123734. doi:10.1016/j.jclepro.2020.123734
Lin, B. Q., and Zhou, Y. C. (2022). Does energy efficiency make sense in China? Based on the perspective of economic growth quality. Sci. Total Environ. 804, 149895. doi:10.1016/j.scitotenv.2021.149895
Liu, F. Z., and Sun, Y. T. (2008). Effect of innovation' industrial change on energy consumption. China Popul. Resour.
Liu, M. L., Huang, X., and Sun, J. (2022). Impact of digital finance on China’s green development and its mechanism. China Popul. Resour. Environ. 32 (06), 113–122. doi:10.12062/cpre20220426
Shan, Y. (2018). “The impact of technological innovation on China's economic level,” in Proceedings of the 2018 International Symposium on Humanities and Social Sciences, Management and Education Engineering (HSSMEE 2018) (Atlantis Press).
Shobande, O. A., Ogbeifun, L., and Tiwari, A. K. (2023). Re-Evaluating the impacts of green innovations and renewable energy on carbon neutrality: does social inclusiveness really matters? J. Environ. Manag. 336, 117670. doi:10.1016/j.jenvman.2023.117670
Tao, C. Q., and Zhou, X. (2015). Effect analysis of industrial structure optimization and upgrading—Empirical research on coupling of information industry and manufacturing. Industrial Econ. Res. 76 (03), 21–31+110. doi:10.13269/j.cnki.ier.2015.03.003
Wan, Y. Y. (2022). Green economic development, clean energy consumption and carbon dioxide emissions. Ecol. Econ. 38 (05), 40–46.
Wang, B., and Liu, G. T. (2015). Energy conservation and emission reduction and China’s green economic growth—Based on a total factor productivity perspective. China Ind. Econ. 326 (5), 57–69. doi:10.19581/j.cnki.ciejournal.2015.05.006
Wang, L., Xiao, Q., and Deng, F. F. (2023). The impact of artificial intelligence on innovation in Chinese manufacturing: evidence from the adoption of robots. Collect. Essays Finance Econ., 1–14. doi:10.13762/j.cnki.cjlc.20230227.001
Wang, Q. Y., and Lu, F. Z. (2021). Economic effects of high-speed rail: emission reduction and efficiency enhancement. Stat. Res. 38 (2), 29–44. doi:10.19343/j.cnki.11-1302/c.2021.02.003
Wang, S., Zhou, S. Y., Xie, X. Y., Zhao, L., Fu, Y., Cai, G. Z., et al. (2020). Comparison of the acute toxicity, analgesic and anti-inflammatory activities and chemical composition changes in Rhizoma anemones Raddeanae caused by vinegar processing. Soft Sci. 34 (10), 7–11+24. doi:10.1186/s12906-019-2785-0
Wang, Y. B., and Li, A. H. (2021). Research on the dynamic relationship between clean energy and green economic growth in hubei province-based on VAR model. Spec. Zone Econ. 390 (07), 71–76.
WangYuLiu, J. Y. S. A. T. S. (2021). A theoretical analysis of the direct rebound effect caused by energy efficiency improvement of private consumers. Econ. Analysis Policy 69, 171–181. doi:10.1016/j.eap.2020.12.002
Wei, C., and Li, C. Z. (2017). Resource misallocation in Chinese manufacturing enterprises: evidence from firm-level data. J. Clean. Prod. 142, 837–845. doi:10.1016/j.jclepro.2016.04.083
Wu, X. L., Wang, D., and Chao, J. F. (2022). Energy use efficiency, economic growth and ecological environmental quality: based on the DSGE model containing carbon emissions. J. Tech. Econ. Manag. 315 (10), 28–33.
Wu, Z. H. (2020). Urbanization, human capital agglomeration and industrial structure adjustment. Reform Econ. Syst. (1), 59–65.
Xu, G. Q., Zhang, W. D., and Chen, X. Y. (2022). Estimation of macro energy rebound effects considering technological progress and structural change. Econ. Theory Bus. Manag. 42 (11), 26–41.
Yang, D. Y., Zhang, H., Miao, C. H., et al. (2023). Study on eco-efficiency and the driving effects of industrial structure transformation in the Yellow River basin. J. Henan Normal Univ. Nat. Sci. Ed. 51 (01), 1–11+171. doi:10.16366/j.cnki.1000-2367.2023.01.001
Yang, Q., Zhao, Y., Zhang, R. G., et al. (2022). Government innovation preference, industrial structure optimization and green economy development level. Statistics Decis. 38 (19), 169–173. doi:10.13546/j.cnki.tjyjc.2022.19.034
Ye, B. J., and Wen, Z. L. (2013). A discussion on testing methods for mediated moderation models: discrimination and integration. Acta Psychol. Sin. 45 (9), 1050–1060. doi:10.3724/SP.J.1041.2013.01050
Yuan, Y. J., and Xie, R. H. (2014). Research on effect of the environmental regulations to industrial restructuring-empirical test based on provincial panel data of China. China Ind. Econ. 317 (08), 57–69. doi:10.19581/j.cnki.ciejournal.2014.08.005
Zhang, D. M., and Bai, X. Y. (2016). Technology gap, technology introduction and green economic growth of Chinese industry. Soc. Sci. Guangxi 247 (1), 71–76. doi:10.3969/j.issn.1004-6917.2016.01.014
Zhang, J., and Guo, L. F. (2023). Study on the impact of digital economy on regional total factor energy efficiency. Coal Econ. Res. 43 (3), 4–12. doi:10.13202/j.cnki.cer.2023.03.015
Zhang, J., Wu, G. Y., and Zhang, J. P. (2004). The estimation of China’s provincial capital stock:1952—2000. Econ. Res. J. 10 (10), 35–44. http://CNKI:SUN:JJYJ.0.2004-10-004
Zhang, J. Q., and Cheng, Q. (2020). The research on the impact of industrial structure upgrading on energy efficiency in the yangtze river economic Belt. J. Industrial Technol. Econ. 39 (1), 129–135. doi:10.3969/j.issn.1004-910X.2020.01.015
Zhang, J. S., and Zhang, X. K. (2014). Technological progress, energy efficiency and rebound effect-empirical estimation based on China’s provincial panel data. J. Shanxi Univ. Finance Econ. 36 (11), 50–59. doi:10.13781/j.cnki.1007-9556.2014.11.003
Keywords: energy efficiency, green economic growth, energy rebound, technological innovation, industrial structure, urbanization
Citation: Wu L, Zhu C, Cheng M, Dai W and Wang G (2023) Should energy efficiency be improved? the impact of energy efficiency improvements on green economic growth—evidence from China. Front. Energy Res. 11:1249092. doi: 10.3389/fenrg.2023.1249092
Received: 28 June 2023; Accepted: 19 September 2023;
Published: 02 October 2023.
Edited by:
Sunday Olayinka Oyedepo, Covenant University, NigeriaReviewed by:
Moses Omolayo Petinrin, University of Ibadan, NigeriaCopyright © 2023 Wu, Zhu, Cheng, Dai and Wang. This is an open-access article distributed under the terms of the Creative Commons Attribution License (CC BY). The use, distribution or reproduction in other forums is permitted, provided the original author(s) and the copyright owner(s) are credited and that the original publication in this journal is cited, in accordance with accepted academic practice. No use, distribution or reproduction is permitted which does not comply with these terms.
*Correspondence: Guonian Wang, Ym9iYnl3YW5nQGN1Zy5lZHUuY24=
Disclaimer: All claims expressed in this article are solely those of the authors and do not necessarily represent those of their affiliated organizations, or those of the publisher, the editors and the reviewers. Any product that may be evaluated in this article or claim that may be made by its manufacturer is not guaranteed or endorsed by the publisher.
Research integrity at Frontiers
Learn more about the work of our research integrity team to safeguard the quality of each article we publish.