 Hongyu Wang
 Jianxin Liu
 Wenbo Guo2
- 1School of Geosciences and Info-Physics of Central South University, Changsha, Hunan, China
- 2Xi’an Non-Ferrous Metals Geophysical and Geochemical Exploration Co., Northwest Bureau of Geological, Xi’an, Shaanxi, China
For old mines, numerous mining tunnels exist, which can potentially bring us closer to the deep ore-bearing structures. Therefore, we propose a surface-tunnel frequency domain electromagnetic (EM) method to utilize these mining tunnels for geophysical exploration. In this method, the transmitter is placed on the Earth’s surface, while the receiver is positioned within the tunnel space, providing higher resolution due to its proximity to the target body. This paper presents the derived analytical solution for the electric field in the surface-tunnel configuration. We also propose a survey system for our surface-tunnel frequency domain electromagnetic method and provide a field example of lead-zinc deposits in Tajikistan. Synthetic cases demonstrate a significant enhancement of the EM signal when the receiver is moved into the tunnel. The field application validates the practicality of our surface-tunnel frequency domain EM method for deep mineral exploration in active mines.
1 Introduction
The depletion of near-surface mineral resources necessitates the need for deep ore exploration in older mines (Wang, 2011; Di et al., 2019; Di et al., 2020). Generally, there are two scenarios for exploring mineral deposits: large-scale greenfield exploration based on geological mapping or geophysical surveys, as well as localized exploration for concealed mineral resources near existing production areas. Among various geophysical methods, the electromagnetic (EM) methods are popular for prospecting deeply buried mineral deposits (Tikhonov, 1951; Cagniard, 1953). The validity of these methods is primarily based on the fact that media with different resistivities exhibit different electromagnetic responses. By analyzing the temporal and spatial distribution of electromagnetic fields, it is possible to infer the hidden geoelectric structure that produces electromagnetic anomalies. Both frequency domain (FD) and time domain (TD) approaches have been developed for decades (Yin et al., 2015; Guo et al., 2020; Wang et al., 2023).
Cagniard (1953) proposes the magnetotelluric (MT) method, which utilizes natural EM sources to detect resistivity anomalies at significant depths. However, due to the weak natural signals, Goldstein and Strangway (1975) have developed the Controlled Source Audio-frequency Magnetotelluric (CSAMT) method based on the theory of the MT method. In this method, artificial audio-frequency (0.1–10 kHz) EM signals are transmitted into the ground (Goldstein and Strangway, 1975; Zonge et al., 1981; Boschetto and Hohmann, 1991). This method provides stronger and controllable signals compared to MT, allowing for better signal quality and the detection of EM responses from underground geological bodies at different depths. As a result, the CSAMT method has found wide applications in metal, oil, gas, and environmental explorations. For example, Di et al. (2010) conducted a CSAMT survey in Tangshan, China, to identify the extent of potentially weak geological structures. The survey successfully located, determined the depth of, and determined the distribution range of the cisticola seam block and karst fracture zone. These findings provided geophysical evidence for risk assessment in high-rise building development. And Xue et al. (2015) used CSAMT for coal mine exploration and discovered a Major Coal Deposit in north of china.
While the CSAMT method offers the advantage of a stronger signal compared to the MT method, it shares the assumption that electromagnetic (EM) fields propagate as plane waves. As a result, its applicability is limited to the far-field region where the receiver is sufficiently distant from the transmitter, allowing us to ignore the curvature of the spherical wave (Chen and Yan, 1995). However, determining the far-field region can be challenging and often impossible. To overcome this limitation, He and Xue propose a wide-field EM (WFEM) method, which does not restrict observations to the far-field region (HE, 2010; HE, 2018; HE and Xue, 2018). In this method, the plane wave assumption is not necessary, allowing the receiver to be positioned closer to the source. Various receiver arrays have been developed, including the E − Ex (Li, 2017) (where E represents a horizontal grounded electric dipole and Ex denotes the collection of the x-component electric field), E − Er (HE, 2010), and E − Hz (Tong, 2010). In mineral exploration, the E − Ex measurement is more widely used due to its suitability for unfavorable topographies.
So far, WFEM is developed mainly for surface observation, in which both the transmitter and the receiver are placed on the surface (Jiang, 2010). However, due to the escalating intensity of human activity, the surface data commonly suffer from the strong EM interference, and it has become difficult to obtain high-quality EM signals in industry area, especially in areas with productive mines. In such cases, obtaining the useful EM response from deep structures can pose significant challenges. One fact is that in production mines, there are numerous tunnels existing, which is closer to the deep targets. If we can move our receivers to the tunnel space rather than on the surface, it is expected that we can get stronger EM response from deep targets. For instance, this approach has been utilized with the SOTEM system (Su et al., 2010; Xue et al., 2013; Xue et al., 2021; Xue et al., 2022; Chen et al., 2015), they move both the transmitter and receiver to the underground tunnel and successfully improve the signal produced by the water-bearing fault.
Chang et al. (2019) get the Surface-to-Coal Mine Roadway TEM Responses to Water-Enriched Bodies. While, in this paper, we propose a new EM observation system called the Surface-Tunnel Frequency Domain Electromagnetic (FDEM) method, aimed at enhancing the EM signal from deeper mineral targets. In our approach, the EM signal is transmitted on the surface, while the receiver records a single component of the EM field deployed in the tunnel, closer to the deeply buried targets. By moving the receiver closer to the anomalous bodies, we expect a stronger signal and reduced noise generated by human activity. Additionally, the tunnel space offers a typically flat and favorable terrain, avoiding the challenges encountered on the surface. To demonstrate the effectiveness of the Surface-Tunnel FDEM method, we initially conduct forward modeling using simple synthetic models. The results indicate that this method has superior capability in distinguishing deep anomalies compared to the surface-surface measurement array. Finally, we apply our proposed method to lead-zinc exploration in the Tajikistan area, where we investigate its practical utility and performance.
2 Response of surface-tunnel FDEM method
2.1 Theory of surface-tunnel FDEM method
Due to the limited space in the tunnel, it is not possible to place the receivers along the principal direction or azimuthal direction as used in the traditional receiver array. To distinguish the traditional receiver array and the one utilized in this paper, we refer our receiver arrangement as the E − Emn receiver array, which can be placed along the direction, dependent on the tunnel (as shown in Figure 1). To get the E − Emn electric field components, we start with the electric field in the principal and azimuthal directions. Under the quasi-static approximation, the Cartesian coordinate system is defined with the x-axis along the electric dipole direction and the z-axis being vertically downward, and the cylindrical coordinate system is defined with r representing the distance between transmitter and receiver, φ denoting the azimuth between transmitter and receiver (as shown in Figure 2). Then we can obtain the field components in both the Cartesian coordinate system and cylindrical coordinate system as (HE, 2010)
Where I is the current, dL the length of the dipole, i a pure imaginary number, ρ the Earth resistivity, α the angle between the center of the transmitting electric dipole and the receiver dipole, ranging between −90° and 90°, and k is the wave number. Ex and Ey can be obtained through (HE, 2010).
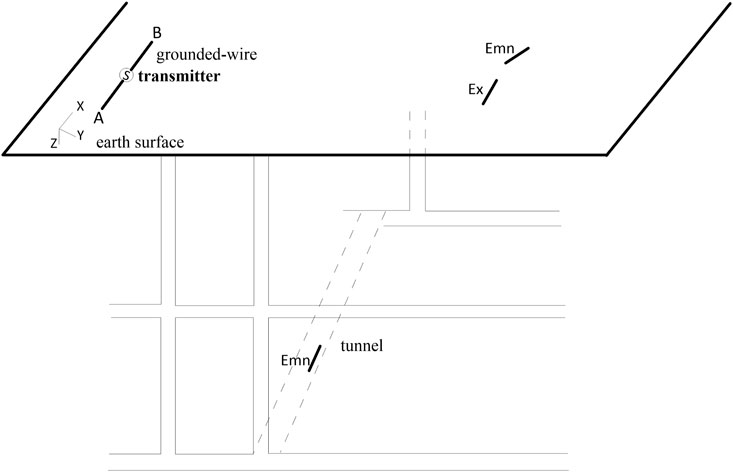
FIGURE 1. Measurement configuration for E − Ex wide-field electromagnetic method and the surface-tunnel frequency domain electromagnetic method.

FIGURE 2. Schematic diagram of the wide-field electromagnetic coordinate system.
Based on Eqs 5, 6, the E − Emn components can be considered as a weighted sum of two principal electrical components, which can be written as
Equations 1, 8 can be used to obtain the expression of the apparent resistivity for the E − Ex WFEM observation and the E − Emn WFEM observation, given by Eq. 9 (HE, 2010) and (10)
Through the iterative method in numerical modeling or the inverse spline interpolation technique, the resistivity values in Eqs 9, 10 can be obtained.
According to Maxwell’s equations and the theory of EM fields, the emitted electric components from the ground electric dipole are shown (HE, 2010).
Where z is the depth of the underground body from surface,J0 is a Bessel function of order 0, J1 is a Bessel function of order 1,
The FDEM method is used to detect geoelectrical structure at different depths by varying the frequency (KS, 1966; Tan et al., 2003). However, unlike the previous studies where the excitation signal is transmitted using a single frequency each time, we use a pseudo-random algorithm to generate signal with different frequencies simultaneously in our WFEM exploration to improve the exploration efficiency (HE, 2010). Compared with the traditional transmission mode, the pseudo-random signal can be measured at multiple frequencies at the same time. Thus, our proposed surface -tunnel configuration can be more efficient and has stronger anti-interference ability (HE and Xue, 2018).
2.2 Forward modeling of surface-tunnel frequency domain electromagnetic
The integral equation method (Li, 2017; Wang et al., 2019) is employed in this paper to perform three-dimensional numerical simulations for artificial source electromagnetic fields. The simulations were conducted using the SimPEG open-source software package, which was developed by the UBC-GIF (University of British Columbia - Geophysical Inversion Facility) research group. To simulate the real geology of a skarn lead-zinc deposit, a high resistivity model is established, as shown in Figure 3. A 240 m×100 m × 100 m anomaly block with resistivity of 1,000 Ω⋅m is buried at a depth of 100 m in the half-space of 100 Ω⋅m. A 500 m-thick layer of10 Ω⋅m overlies the half-space. To simulate the EM response, we discretize the model with a mesh of 8 × 8 × 12 cells. The uniform grid size is 12.5 m × 12.5 m × 20 m.
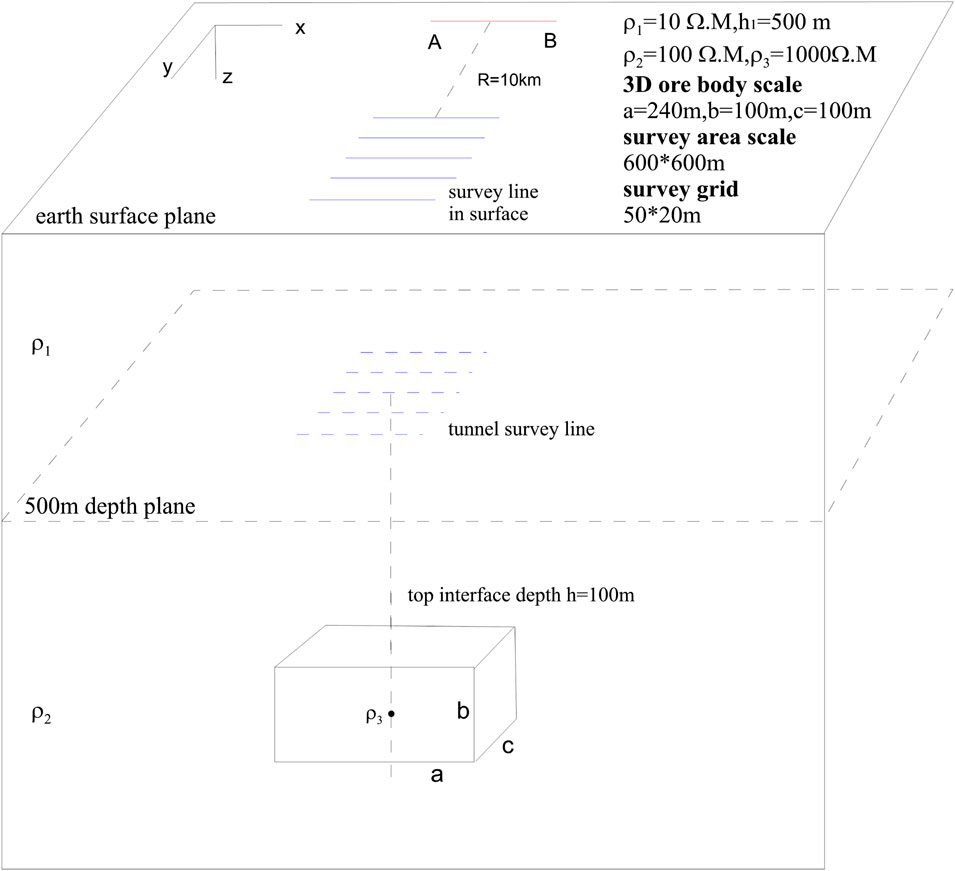
FIGURE 3. The high resistivity model and measurement arrangement for the surface-tunnel frequency domain electromagnetic method.
Figure 4A shows the horizontal component of the electric field at 16Hz. The left panel shows the results for the surface receivers, and the right panel shows the results for receivers deployed in the tunnel. Compared with the surface results, the measured EM response in the tunnel is stronger, indicating a more evident EM anomaly for the high-resistivity block. Similar results are also indicated at 1Hz and 0.0625Hz, as shown in Figures 4B, C. These results demonstrate the advantages of the surface-tunnel configuration.
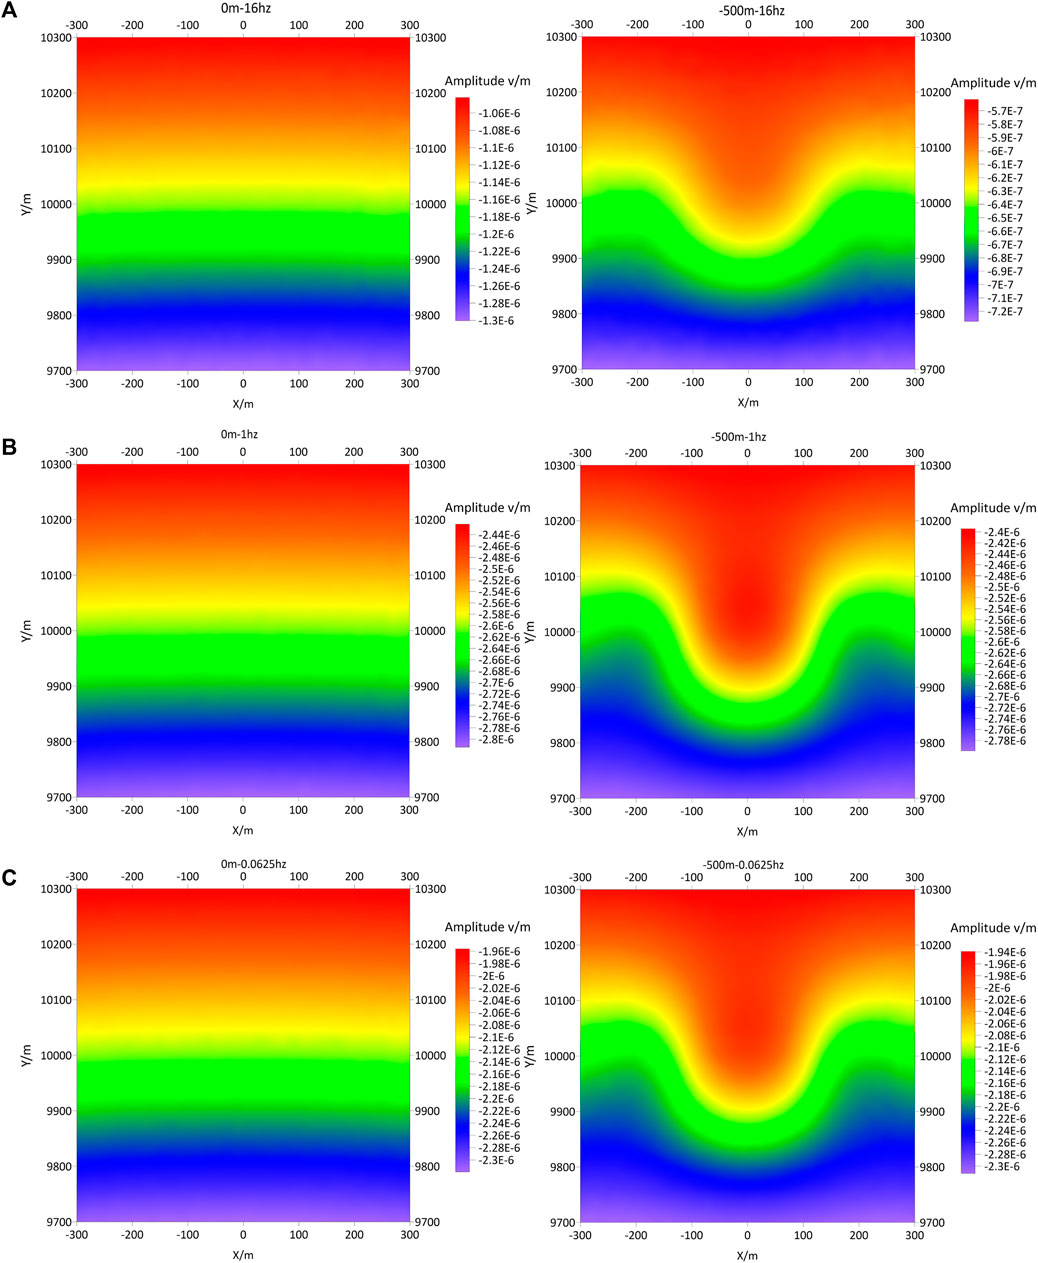
FIGURE 4. (A) The x-component electric field on the surface for the high resistivity model at 16 Hz at 0 m depth (left panel) and at −500 m depth (right pannel) for x-directed electrical dipole. (B) The x-component electric field on the surface for the high resistivity model at 1 Hz at 0 m depth (left panel) and at −500 m depth (right panel) for x-directed electrical dipole. (C) The x-component electric field on the surface for the high resistivity model at 0.0625 Hz at 0 m depth (left panel) and at −500 m depth (right panel) for x-directed electrical dipole.
Based on the model as shown in Figure 4 we change the resistivity of the first layer to 1,000 Ω⋅m and the resistivity of the anomalous block to 10 Ω⋅m, refereed as the low resistivity model. The same discretization as in the previous test case is applied. Figures 5A–C show the horizontal electric field results for cases with receivers placed on the surface and in the tunnel, respectively. The frequencies of 16Hz, 1Hz, and 0.0625 Hz are taken into consideration. For the low resistivity model, the amplitude of the electric field in the tunnel is generally much larger than that on the surface. The anomaly amplitude caused by the low resistivity body is clearly indicated in the tunnel data, which can be hardly seen in the surface data.
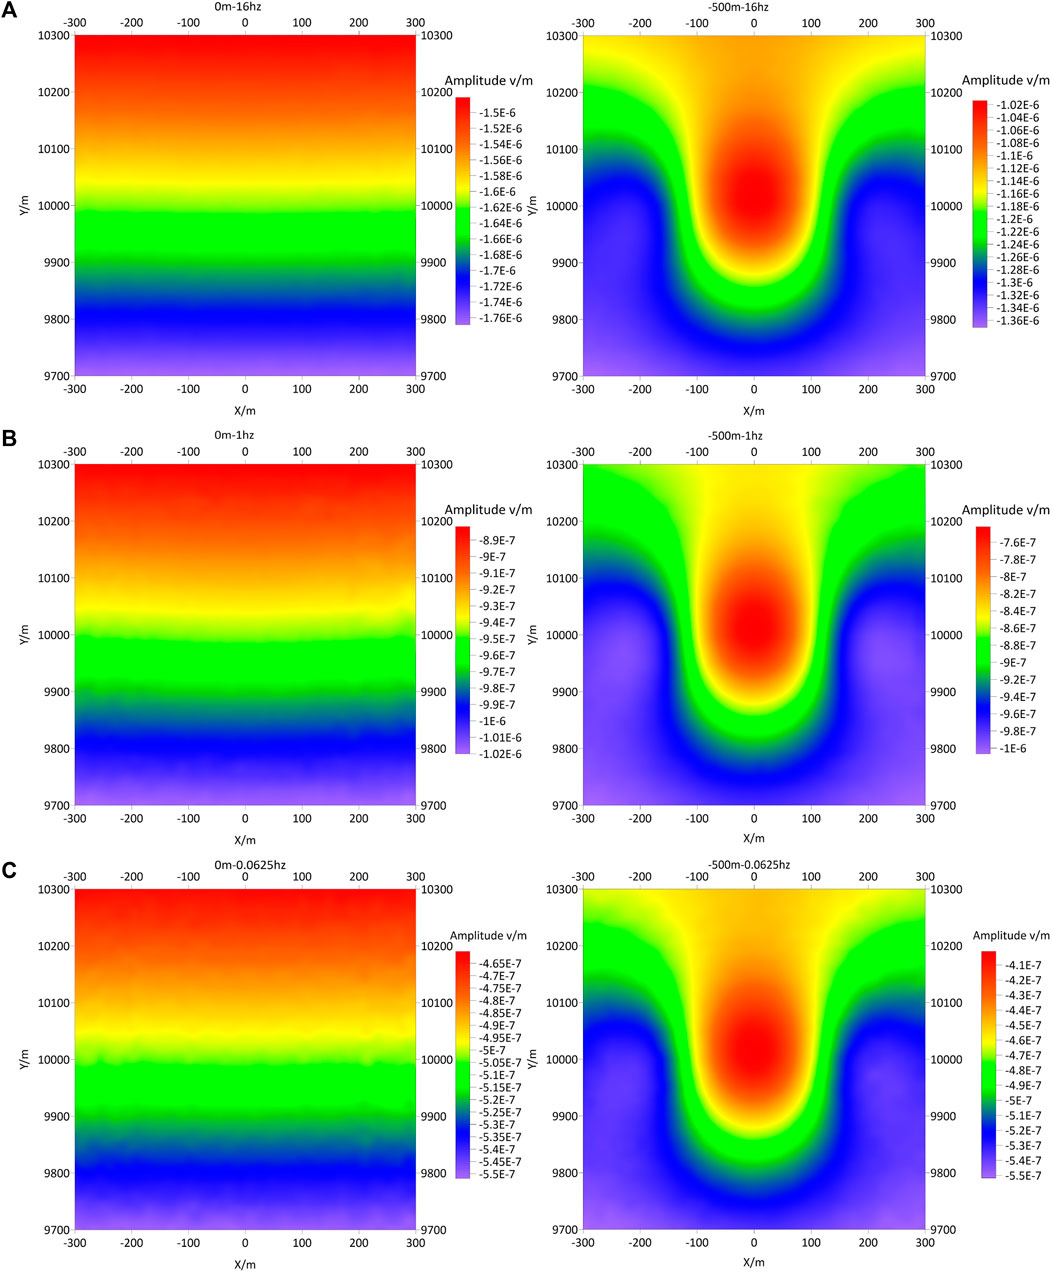
FIGURE 5. (A) The x-component electric field in the tunnel for the low resistivity model at 16 Hz at 0 m depth (left panel) and at −500 m depth (right pannel) for x-directed electrical dipole. (B) The x-component electric field in the tunnel for the low resistivity model at 1 Hz at 0 m depth (left panel) and at −500 m depth (right panel) for x-directed electrical dipole. (C) The x-component electric field in the tunnel for the low resistivity model at 0.0625 Hz at 0 m depth (left panel) and at −500 m depth (right panel) for x-directed electrical dipole.
For a more comparison, we give the detailed comparison on the largest anomaly amplitude for both the high and low resistivity models in Table 1, normalized by the background fields. It intuitively shows that when the receivers are moved to the tunnel, closer to the target, the anomaly amplitude increases significantly against that on the surface. Compared with the high resistivity model, the anomaly amplitude generated by the low resistivity block is generally much larger, indicating the higher sensitivity of our proposed configuration to the low resistivity structure.
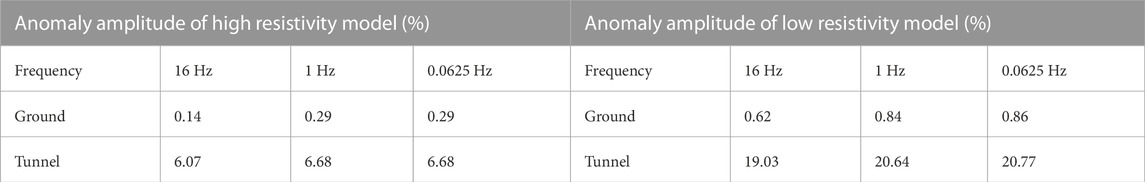
TABLE 1. The abnormal amplitude of the surface-tunnel measurement method.
3 Application of the surface-tunnel frequency domain electromagnetic method for lead-zinc exploration in Tajikistan
The mining site is located 110 km north of Khujand, the second largest city in Tajikistan. It is located at the southern edge of the Tianshan orogenic belt in the Kazakhstan-Junggar plate, belonging to the Kuramin Carboniferous Permian volcanic basin. The deposit represents a typical skarn-type deposit, with mining operations reaching depths of below 500 m. The exploration carried out is to target the deep resources buried in the range of 500–1,000 m.The outcrops of the mining site include the Devonian volcaniclastic rock, volcanic metamorphic rock, carbonate rock, and early Carboniferous limestone. The intrusive rock in this area includes granodiorite porphyry, granite porphyry, and quartz porphyry, discovered in a series of granite veins. The distribution of the deposit is controlled by the main fault, and skarn-type ore bodies generally occur in the contact zone of granite veins and limestone. Granite diorite porphyry veins have the metallogenic significance in this area, and their contact zone with the surrounding limestone is considered as the main ore-controlling structure. Minerals occurring in this deposit mainly include galena, sphalerite, pyrite, and chalcopyrite, together with minor magnetite and hematite. The petrophysical testing results show that the resistivities of granite and limestone are significantly different. This difference is highly dependent on the skarnization of limestone. The delineation of skarnization region is considered as the main task for this geophysical exploration, since it is typically taken as the indication for potential mineral deposits.
At present, the ore deposit has been mined from an elevation of 1,400 m on the surface to an elevation of 920 m. Mining goafs are common in the mining area. Surface geophysical explorations were conducted previously to delineate the distribution of ore deposits between a depth of 500 m and 1,500 m and they are heavily affected by widely distributed goafs and on-going mining operations. To overcome the above challenges, the surface-tunnel FDEM method is applied to carry out the deep ore prospection along the 800 m long-tunnel as indicated in Figure 6 (The line spacing is 40 m, Transmitting and receiving distance is 6 km in the northwest of the survey area). The tunnel observation can weaken the EM noise from the upper production area and can also avoid the unfavored rugged topography for surveys on the surface.
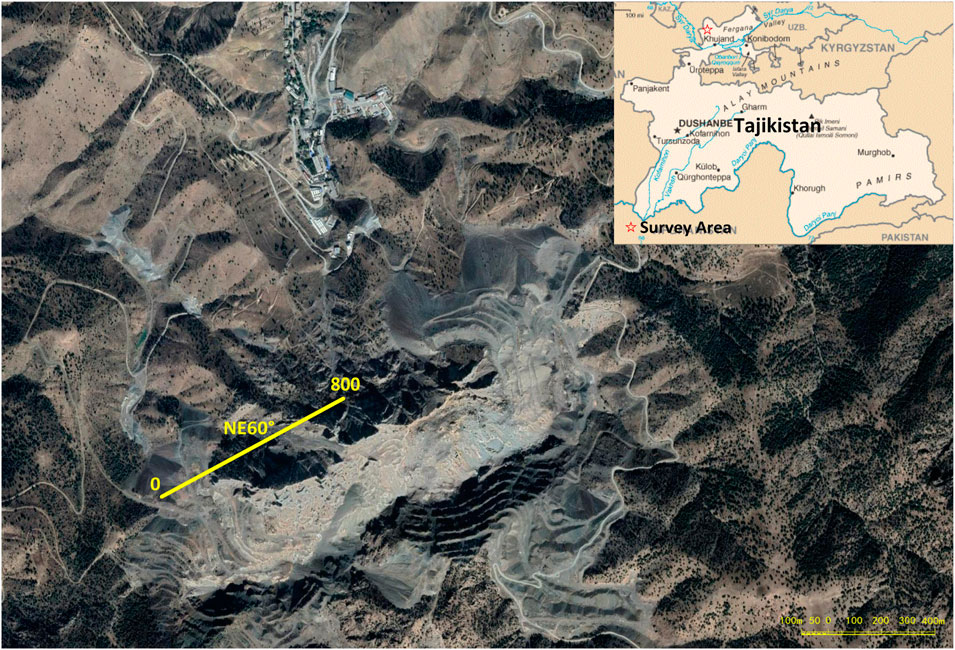
FIGURE 6. Survey configuration. The yellow line indicates the 800 m-long survey line the source is located 6 km away from the survey line in the northwest of the survey area (outside the map).
Since the test site is still in production, and EM interference is quite strong. Before the survey, we performed experiments in an adjacent area with similar strong EM interferences to examine the data quality for different transmitted currents. It is important to note that the mining operations were ongoing during the testing phase. As shown in Figure 7, when the transmitted currents are 10, 20, and 40 A, the frequency-domain electric field curves are not smooth, and heavy distortions are presented in both the high-frequency and low-frequency bands. When the electric current is greater than 60 A, the electric field becomes smooth, and there are only a few small jumps in the high-frequency band. When the transmitting current is 70 A, the quality of the measured data is the best, and the comprehensive mean square error of the measured data is less than 5%. Based on the test results, we choose the transmitting current of 70 A for our geophysical survey. This observation suggests that despite the presence of strong interferences, the surface-tunnel FDEM method proposed in this paper is capable of acquiring high-quality EM data.
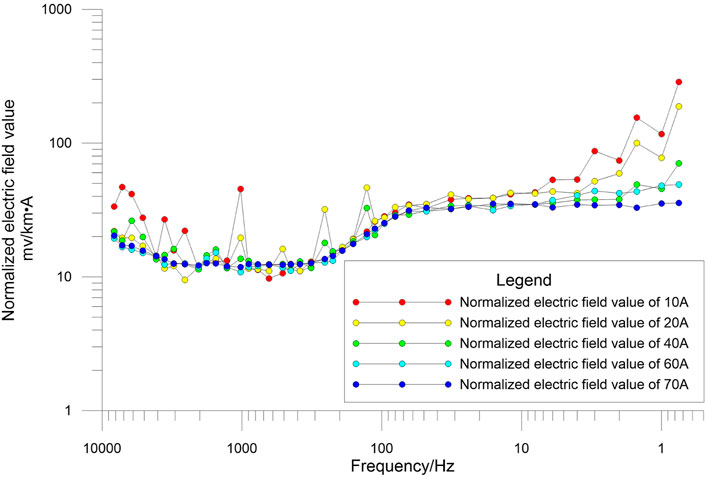
FIGURE 7. Normalized electric field for the surface-tunnel frequency domain electromagnetic method using different transmitting currents.
Figure 8 shows the comparison of the electric field amplitude for different measurement configurations (i.e., ground survey and surface-tunnel survey) for one typical site. It shows that while surface-tunnel survey manifests clear regional variations in amplitude caused possibly by the shallow subsurface structure, the survey on the surface is dominated by remarkable local variations over the considered frequency range, possibly caused by near-surface resistivity changes or EM noise from human facility, which is not present in the result from surface-tunnel survey. The surface-tunnel result indicates a clear smooth variation pattern, may reflecting more realistic resistivity variation of the subsurface. One obvious reason for this is that the space above the tunnel can work as a filter for high frequency noise, and also for part of high frequency signal. Because of this filtering effect, our measurement lose some high frequency information. The sharp jump in our result may be caused by EM noise. The data from surface-tunnel survey indicate more consistent and smooth anomalies caused by the subsurface structure, illustrating the benefit of moving the receivers from ground surface to tunnels.
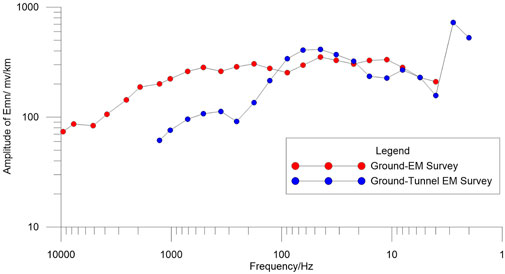
FIGURE 8. Electromagnetic sounding curve of WFEM and surface-tunnel WFEM measurement mode.
Bostic inversion is carried out for this survey line, with results interpolated to generate a 2D resistivity pseudo section as indicated in Figure 9. As shown in the figure, the near-surface resistivity variation is remarkable, which is consistent with the near-surface geological structure. There is a relative uniform high resistivity structure at a depth from 200 m to 600 m. In the deeper region, the resistivity distribution is more complex with several low resistivity blocks embedded in the high resistivity background. The geology in this area is consistent with the resistivity distribution from Bostic inversion, which will be shown later.
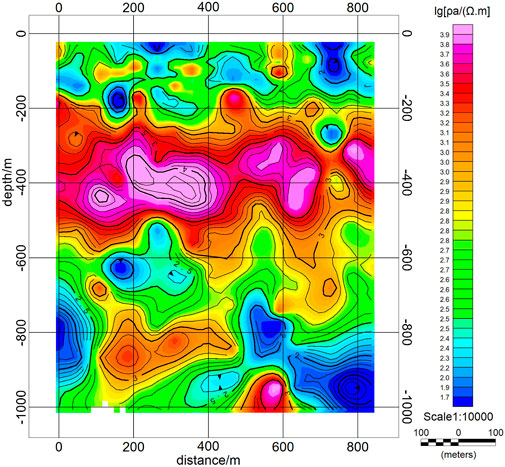
FIGURE 9. Pseudo section interpolated based on Bostic inversion of data from surface-tunnel WFEM survey for a super-large lead-zinc mine in Tajikistan.
Based on the Bostic inversion and available geology information, we produce a geological prediction map as shown in Figure 10. According to the pattern of the mineralization in this area, the skarnization of limestone is an important indicator for mineralization. Ferrite alteration and sericite alteration of silicate are also important indicators of mineralization alteration. The delineation of skarnization and pyrite sericite from the Bostic inversion result for the surface-tunnel FDEM method can provide important indications for deep ore exploration. Based on this, we infer two potential mineralization anomalies, with respective spatial extents ranging from −650 m to −750 m and from-650 m to −850 m below the tunnel. Please note that the small low resistivity anomalies at that depth may not be resolved by EM fields. However, as a whole, EM fields are sensitive to low resistivity structure. The two favorable areas correspond to resistivity transition zones, which are geologically interpreted as the contact regions of the limestone and the intrusive rock. Since strong hydrothermal alteration has been undergone in these regions, reducing their resistivity. The mineralization of the two inferred target areas has been verified by subsequent drilling.
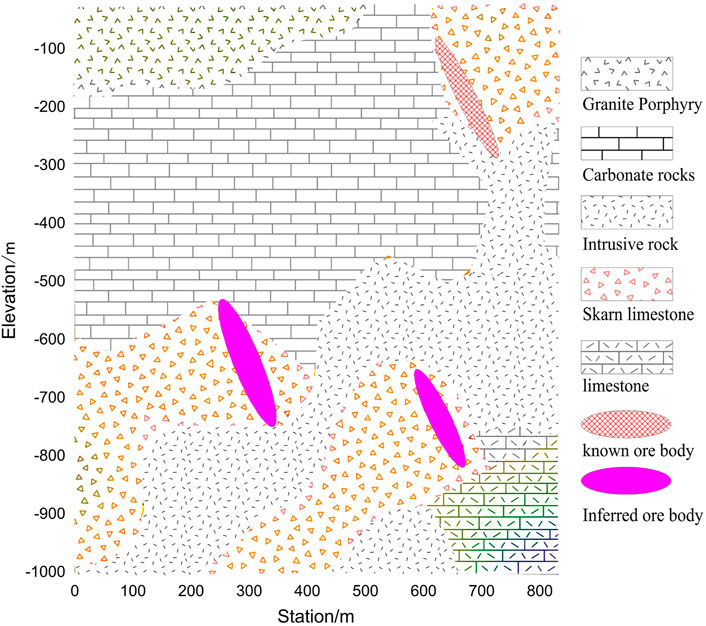
FIGURE 10. The inferred geological map based on data collected using surface-tunnel frequency domain electromagnetic method from a super-large lead-zinc mine of Tajikistan.
4 Conclusion
In this paper, we present the Surface-Tunnel Frequency Domain Electromagnetic (FDEM) method as a novel approach for ore exploration in active mines with rugged topography. We leverage existing tunnels in old mines to develop this method, which involves transmitting pseudo-random EM signals from the ground source and deploying receivers in the tunnels, closer to the target areas.
To assess the effectiveness of the proposed method, we compare the EM field signals obtained by moving the receivers into the tunnel with those obtained using the surface FDEM configuration, using a synthetic model. The results demonstrate that moving the receivers into the tunnel significantly increases the signal strength, particularly for low resistivity targets, due to their proximity to the regions of interest.
We then apply the surface-tunnel FDEM method to lead-zinc exploration in an old mine located in Tajikistan to validate its applicability in real-world scenarios. The results indicate that moving the receivers into the tunnel effectively mitigates the impact of unfavorable near-surface structures and human activities. As a result, the deeper target ore deposits generate stronger signals at the receivers installed in the tunnel. By combining the EM data with local geological information, we successfully image two potential ore deposits, which are subsequently verified through drilling activities.
Overall, our findings suggest that the surface-tunnel FDEM method holds promise for deep ore exploration in old mines, offering a viable option for future endeavors in this field.
Data availability statement
The raw data supporting the conclusion of this article will be made available by the authors, without undue reservation.
Author contributions
HW and JL ran the examples, plotted the results and wrote the draft. ST has reviewed and edited the paper. WG supervised the project and provided fund support. All authors contributed to the article and approved the submitted version.
Funding
This work was financially supported by the National Natural Science Foundation of China (42130810). And supported by Surface-tunnel Frequency Domain Electromagnetic Method Application Research and Engineering Demonstration [NWME post (2019)No. 84]. It is also supported by Scientific Equipment Instrument and Development Project of the Chinese Academy of Sciences (YJKYYQ20190004).
Conflict of interest
Authors HW and WG were employed by Xi’an Non-Ferrous Metals Geophysical and Geochemical Exploration Co.
The remaining authors declare that the research was conducted in the absence of any commercial or financial relationships that could be construed as a potential conflict of interest.
Publisher’s note
All claims expressed in this article are solely those of the authors and do not necessarily represent those of their affiliated organizations, or those of the publisher, the editors and the reviewers. Any product that may be evaluated in this article, or claim that may be made by its manufacturer, is not guaranteed or endorsed by the publisher.
References
Boschetto, N., and Hohmann, G. (1991). Controlled-source audiofrequency magnetotelluric responses of three-dimensional bodies. Geophysics 56, 255–264. doi:10.1190/1.1443038
Cagniard, L. (1953). Basic theory of the magneto-telluric method of geophysical prospecting. Geophysics 18, 605–635. doi:10.1190/1.1437915
Chang, J., Xue, G., and Malekian, R. (2019). A comparison of surface-to-coal mine roadway tem and surface tem responses to water-enriched bodies. IEEE Access 7, 167320–167328. doi:10.1109/access.2019.2953844
Chen, M., and Yan, S. (1995). Discussion some question in the application of frequency-domain sounding. Beijing: Geological Publishing House.
Chen, W., Xue, G., Muhammad, Y. K., Gelius, L., Zhou, N., Li, H., et al. (2015). Application of short-offset tem (sotem) technique in mapping water-enriched zones of coal stratum, an example from east China. Pure Appl. Geophys. 172, 1643–1651. doi:10.1007/s00024-014-1028-z
Di, Q., Li, D., Cheng, H., and Fu, C. (2010). An article on site investigation with geophysical methods in tangshan city of China. Geol. Act. 2010, 1793–1801.
Di, Q., Xue, G., Yin, C., and Li, X. (2020). New methods of controlled-source electromagnetic detection in China. Sci. China Earth Sci. 63, 1268–1277. doi:10.1007/s11430-019-9583-9
Di, Q., Zhu, R., Xue, G., Yin, C., and Li, X. (2019). New development of the electromagnetic (em) methods for deep exploration. Chin. J. Geophys. 62, 2128–2138. doi:10.6038/cjg2019M0633
Goldstein, M., and Strangway, D. (1975). Audio-frequency magnetotellurics with a grounded electric dipole source. Geophysics 40, 669–683. doi:10.1190/1.1440558
Guo, Z., Xue, G., Liu, J., and Wu, X. (2020). Electromagnetic methods for mineral exploration in China: a review. Ore Geol. Rev. 118, 103357. doi:10.1016/j.oregeorev.2020.103357
He, J. (2010). Wide area electromagnetic method and pseudo-random signal electric method. Beijing: Higher Education Press.
He, J. (2018). Review of the key techniques on short-offset electromagnetic detection. Chin. J. Geophys. 61, 1–8. doi:10.6038/cjg2018L0003
He, J., and Xue, G. (2018). Review of the key techniques on short-offset electromagnetic detection. Chin. J. Geophys. 61, 667–675.
Jiang, Q. (2010). “Research on key Technologies of wide-area electromagnetic depth sounder,” (Changsha: Central South University). Ph.D. thesis.
Ks, Y. (1966). Numerical solution of initial boundary value problems involving maxwell’s equations in isotropic media. IEEE Trans. Antennas Propag. 14, 302–307. doi:10.1109/tap.1966.1138693
Li, D. (2017). Measurement range of e and e wide field electromagnetic methods. Shiyou Diqiu Wuli Kantan/Oil Geophys. Prospect. 52, 1315–1323. doi:10.13810/j.cnki.issn.1000-7210.2017.06.023
Su, M., Li, S., Xue, Y., Li, X., and Qiu, D. (2010). Study on the interpretation method of transients electromagnetic vertical conductivity in tunnel geological prediction. Chin. J. Geotechnical Eng. 32, 1722–1726.
Tan, H., Yu, Q., John, B., and Wei, W. (2003). Numerical simulation of three-dimensional staggered grid finite difference method for magnetotelluric method. Chin. J. Geophys. 46, 705–711.
Tikhonov, A. N. (1951). Determination of the electrical characteristics of the deep strata of the Earth’s crust. Metcalfe House, Delhi: Scientific Information Centre.
Tong, T. (2010). “Research on E-hz broadband electromagnetic method,” (Changsha: Central South University). Ph.D. thesis.
Wang, Y. (2011). “Research on time-frequency joint electromagnetic detection method for deep mineral resources,” (China: Jilin University). Ph.D. thesis.
Wang, Y., Guo, R., Liu, J., Li, J., Liu, R., Chen, H., et al. (2023). A divergence free vector finite element method for efficient 3D magnetotelluric forward modeling. Geophysics 2023, 1–50. doi:10.1190/geo2023-0037.1
Wang, Y., Liu, J., Liu, R., Guo, R., and Feng, D. (2019). Frequency-domain magnetotelluric footprint analysis for 3d earths. J. Geophys. Eng. 16, 1151–1163. doi:10.1093/jge/gxz085
Xue, G., Chen, W., and Wu, X. (2022). Theory and application of SOTEM. Beijing, China: Science Press.
Xue, G., Chen, W., Zhou, N., and Li, H. (2013). Short-offset tem technique with a grounded wire source for deep sounding. Chin. J. Geophys. 56, 255–261.
Xue, G., Yan, S., Gelius, L.-J., Chen, W., Zhou, N., and Li, H. (2015). Discovery of a major coal deposit in China with the use of a modified csamt method. Environ. Earth Sci. 20, 47–56. doi:10.2113/jeeg20.1.47
Xue, G., Zhou, N., Wang, R., Liu, H., and Guo, W. (2021). Exploration of lead-zinc deposits using electromagnetic method: a case study in Fengtai ore deposits in Western China. Geol. J. 56, 3314–3321. doi:10.1002/gj.4103
Yin, C., Zhang, B., Liu, Y., Ren, X., Qi, Y., Pei, Y., et al. (2015). Development and prospect of airborne electromagnetic survey technology. Chin. J. Geophys. 58, 2637–2653.
Keywords: surface-tunnel, frequency domain, electromagnetic method, mineral exploration, Tajikistan area
Citation: Wang H, Liu J, Guo W and Tian S (2023) A surface-tunnel frequency domain electromagnetic method for mineral exploration in Tajikistan area. Front. Energy Res. 11:1247346. doi: 10.3389/fenrg.2023.1247346
Received: 26 June 2023; Accepted: 30 November 2023;
Published: 15 December 2023.
Edited by:
Yongchun Zhao, Huazhong University of Science and Technology, ChinaReviewed by:
Jing Li, Jilin University, ChinaXiaoyue Cao, Key Laboratory of Exploration Technologies for Oil and Gas Resource (Yangtze University), China
Copyright © 2023 Wang, Liu, Guo and Tian. This is an open-access article distributed under the terms of the Creative Commons Attribution License (CC BY). The use, distribution or reproduction in other forums is permitted, provided the original author(s) and the copyright owner(s) are credited and that the original publication in this journal is cited, in accordance with accepted academic practice. No use, distribution or reproduction is permitted which does not comply with these terms.
*Correspondence: Hongyu Wang, d2h5X3d1dGFuQDE2My5jb20=