 Han Shaohua
 Fang Xin2*
- 1State Grid Jiangsu Electric Power Co., Ltd. Suqian Power Supply Branch, Suqian City, Jiangsu, China
- 2State Grid Jiangsu Electric Power Company Limited Electric Power Research Institute, Nanjing City, Jiangsu, China
To address the challenge of predicting distributed photovoltaic (PV) power output for improved system integration and stability, this study proposes a novel method. Given the expanding scale of distributed PV systems and their economic constraints, accurate power output prediction becomes pivotal. Conventional prediction methods are hindered by the lack of meteorological stations at most distributed PV stations. In response, we present a dynamic convolutional generative adversarial network (DC-GAN) approach coupled with satellite cloud map video frames. By extracting shading features from satellite cloud images and utilizing DC-GAN, our method forecasts short-term cloud shading effects on future radiation. We further integrate radiation data from centralized PV stations, spatial correlations of distributed PV stations, and cloud shading characteristics. This information is used to construct a predictive model combining Convolutional Neural Networks (CNN) and Long short-term memory (LSTM), enhancing prediction accuracy. Comparative experiments confirm the superiority of our proposed method over traditional approaches, substantiating its effectiveness and practicality. Our method achieves notable accuracy improvements, establishing its value in predicting distributed PV power output. This research’s findings offer a valuable contribution to the field of renewable energy integration. In numerical assessments, our method demonstrates a significant increase in prediction accuracy, outperforming conventional techniques by 3.3%. This underscores the practical relevance and efficiency of our proposed approach in enhancing distributed PV power output prediction.
1 Introduction
Amidst the backdrop of “Peak Carbon Emissions, Carbon Neutrality,” China is actively revamping its energy structure, with a focus on bolstering the installed capacity of distributed photovoltaics. This surge is fueled by supportive policies (ZHANG et al., 2019; Tian et al., 2022). However, when juxtaposed with centralized photovoltaics, distributed photovoltaic stations are dispersed across various locations, presenting a formidable hurdle in establishing an efficient meteorological monitoring system. Consequently, regulating their power output becomes a complex endeavor, casting a shadow over the seamless operation of the emerging power infrastructure. Elevating the precision of distributed photovoltaic power prediction holds paramount importance in driving up its integration rate within the novel power grid (Jiang et al., 2018).
With the continuous advancement of artificial intelligence technology, prediction methods for photovoltaic power output, rooted in deep learning and machine learning, have garnered widespread utilization. Within these methodologies, historical photovoltaic output data, Numerical Weather Prediction (NWP), and meteorological data serve as inputs for prediction models, enabling the execution of short-term photovoltaic power output forecasts (Hou et al., 2018). Notably, among these variables, solar irradiance emerges as the most pivotal factor influencing photovoltaic power output prediction (Botong et al., 2022). In centralized photovoltaic power output prediction, meteorological monitoring systems are integrated within photovoltaic power stations, allowing for direct acquisition of solar irradiance data. Conversely, in distributed photovoltaic systems, logistical and economic considerations render the installation of meteorological monitoring systems at each photovoltaic power station impractical (BIAN and SUN, 2021). Typically, meteorological data sourced from centralized photovoltaic sites in proximity to distributed photovoltaic stations are employed for prediction. However, this approach overlooks the dynamic shading effects of clouds on irradiance over time. Consequently, forecast errors tend to be substantial, rendering the fulfillment of load control requirements for the emerging power system a challenging feat (ZHU et al., 2020). Against this backdrop, this research delves into the prediction of power output from distributed photovoltaic stations, employing deep learning algorithms. This investigation takes into account the spatial correlation between distributed and centralized photovoltaics, as well as the time-evolving shading characteristics induced by clouds.
With the advancement of artificial intelligence technology, methods for predicting photovoltaic power output using deep learning and machine learning have gained widespread traction. In these approaches, historical photovoltaic output data, Numerical Weather Prediction (NWP), and meteorological information are harnessed as inputs for the prediction model, facilitating short-term forecasting of photovoltaic power output (Hou et al., 2018). Among these inputs, solar irradiance emerges as a paramount factor significantly influencing photovoltaic power output prediction (Botong et al., 2022). In centralized photovoltaic power output prediction, meteorological monitoring systems are seamlessly integrated within photovoltaic power stations, enabling direct acquisition of solar irradiance data. However, the scenario differs for distributed photovoltaic systems due to their dispersed installation sites and economic constraints, rendering the deployment of meteorological monitoring systems at each photovoltaic power station infeasible (BIAN and SUN, 2021). Commonly, meteorological data sourced from centralized photovoltaic installations in proximity to the distributed photovoltaic station are employed for prediction. Yet, this practice disregards the dynamic shading effects of clouds on irradiance over time. As a result, prediction discrepancies tend to be substantial, impeding the fulfillment of load control requirements within the emerging power system (ZHU et al., 2020). Taking these factors into consideration, this study delves into power output prediction for distributed photovoltaic stations utilizing deep learning algorithms. The investigation takes into account both the spatial correlation between distributed and centralized photovoltaics and the time-varying cloud shading characteristics.
Due to limitations in hardware infrastructure, the prevailing approach for predicting distributed photovoltaic output combines data augmentation techniques with deep learning algorithms. In reference (Peng et al., 2020), an ultra-short-term method for forecasting distributed photovoltaic power is introduced, employing satellite remote sensing. Initially, the Res-UNet model is employed for temporal and spatial prediction of short-term irradiation grids. Subsequently, spatial interpolation is applied to the predicted SWR (shortwave radiation) grid to ascertain future irradiance at ground-based distributed stations. Lastly, a long-short-term memory model based on an encoder-decoder architecture is utilized for photovoltaic output prediction.
In a similar vein, reference (QIAO et al., 2021) presents a short-term power prediction method for grid-distributed power stations, focusing on areas with limited territory coverage. This method partitions a larger region into smaller grids and selects comparable days for the entire region based on curve feature distances to mitigate distortion in individual grid data. Ultimately, a three-dimensional convolutional neural network is employed to establish a mapping relationship between grid irradiation prediction and grid photovoltaic power output. Incorporating temporal adjustments to meteorological data, reference (Chen et al., 2022) proposes a hybrid prediction method. This approach utilizes an optimized time shift to rectify meteorological data in the prediction model. On a different note, reference (Si et al., 2021) introduces a novel satellite image-based strategy for photovoltaic power forecasting. Addressing the limitations of infrequent satellite image updates and significant changes in cloud coverage, a non-linear cloud motion prediction model is devised for hourly imagery changes. In reference (Yu et al., 2020), a photovoltaic power generation forecasting model is put forth, incorporating a cloud cover prediction network trained using satellite imagery. Additionally, the proposed model integrates convolutional self-attention to effectively capture historical features, thereby extracting valuable insights from weather forecasts. Meanwhile, in reference (Son et al., 2022), an artificial neural network (ANN) model is employed for data performance evaluation, predicting cloud cover, visible light images, infrared images, and combinations thereof, using consistent hyperparameters or settings. Lastly, reference (Cheng et al., 2021) introduces an ultra-short-term photovoltaic power prediction approach grounded in satellite image data. This method amalgamates spatio-temporal correlations between multiple power plants with power and cloud data. Initially, relevant adjacent power stations are selected via spatio-temporal cross-correlation analysis. Subsequently, global cloud distribution information is extracted from satellite imagery and incorporated as an additional input, along with general meteorological and electrical data, for training the forecasting model.
Although the aforementioned methods have yielded commendable predictive outcomes, they all derive predictions indirectly based on meteorological data near the distributed photovoltaic power station (Yu et al., 2020; Si et al., 2021), or directly from predicted satellite cloud images. The prevalent irradiance prediction techniques centered on satellite cloud images often encounter the following challenges. Primarily, direct prediction of satellite cloud images involves a graphical variable. The resultant data volume post-conversion is relatively substantial, demanding significant computational resources for processing. Secondly, the utilization of spatial correlations among photovoltaic power plants across different regions for prediction is a common practice. While these predominant techniques may yield certain predictive capabilities, they disregard the time-varying dynamics between centralized and distributed photovoltaic power plants situated in akin locations. Consequently, the predictive efficacy remains insufficient to fulfill the requisite accuracy standards for load control within the emergent power system (Son et al., 2022). Among these considerations, the shading effects of clouds on irradiance emerge as the pivotal determinant influencing the time-varying output of distributed photovoltaic power plants. Distinct cloud layers’ shading effects predominantly manifest through varying thicknesses and types. Consequently, for an accurate depiction of cloud shading effects, precise prediction of cloud layer thickness and type attributes becomes indispensable.
Hence, this paper introduces a novel approach for forecasting distributed photovoltaic power plant outputs, leveraging DC-GAN and satellite cloud image video frames. The methodology encompasses several key steps. Firstly, historical satellite cloud image data related to distributed photovoltaic power plants in a designated locale is procured from publicly accessible meteorological data repositories. Subsequently, the cloud images’ shading characteristics at different time intervals are extracted to derive irradiance implications. Employing the DC-GAN network, the forthcoming short-term cloud shading effects are predicted, utilizing the shading characteristics of cloud images at different temporal snapshots as model input. Ultimately, by integrating centralized photovoltaic power plant irradiance data, the spatial relationship between centralized and distributed photovoltaic power plants, and the anticipated short-term cloud shading traits, a predictive model for distributed photovoltaic power output is constructed, employing a CNN-LSTM architecture as its structural framework. The efficacy of the proposed methodology is corroborated through its application to photovoltaic power plant data obtained from a specific region in Yongzhou City, Hunan Province, China. Experimental results underscore the capacity of this approach to not only optimize computational resources but also capitalize on the spatial interconnections among photovoltaic power plants, thereby enhancing the prediction accuracy of distributed photovoltaic power outputs. In summary, the key contributions of this study can be succinctly outlined as follows.
(1) The method proposed in this research effectively enhances the accuracy of output prediction for distributed photovoltaic power plants.
(2) A novel approach for predicting satellite cloud images is introduced, leveraging the DC-GAN neural network.
(3) The method delineated in this study offers comparatively precise irradiance data for distributed photovoltaic power plants.
The subsequent sections of this research are structured as follows: In Section 2, we expound on the method of irradiance shading feature extraction predicated on satellite cloud images for the location of the distributed photovoltaic power station. Section 3 outlines the approach to predicting irradiance shading features utilizing the DC-GAN model. Section 4 elucidates the technique for irradiance and output prediction of distributed photovoltaic power plants employing neural networks. Furthermore, in Section 5, the effectiveness of the proposed method is validated through an analysis of real-world cases.
In the study of the shading effect of clouds on irradiance, it has been found that the shading effect of clouds on irradiance mainly depends on two feature dimensions: cloud thickness and cloud type. Therefore, in order to obtain relatively accurate values of irradiance at the location of distributed photovoltaics, it is necessary to accurately predict the thickness and type of clouds at that location.
1.1 Preprocessing of cloud data
Given that satellite cloud images are captured from elevated angles by satellites, they inherently encompass information beyond cloud formations, including ground features. To obtain relatively unadulterated cloud-related information, a background removal procedure becomes imperative for the original satellite cloud images.
Prior to commencing the background removal procedure, standardization of the cloud images is necessary. Satellite cloud images consist of matrices with varying pixel intensities, where each pixel’s value is intricately linked to the elevation and angle of incident sunlight. The computation for determining the intensity of each pixel within the matrix can be formulated as follows:
In the formula, K represents the solar constant,
In the formula,
Considering that the proximity between sunlight and cloud positions is considerably shorter compared to the distance between sunlight and the ground, pixel values within the cloud image tend to be higher at cloud locations than at non-cloud areas. Essentially, the minimum pixel value within the image signifies the ground. In order to eliminate comprehensive ground information from the cloud image, it is imperative to acquire satellite cloud images captured at various time intervals within the identical latitude and longitude range.
First, the satellite cloud images taken at different times within the same latitude and longitude range are obtained from the database of the “Fengyun-4” satellite data platform, and the cloud images at different times are numbered. In this study, we extracted a set of satellite cloud images taken at different times during the day from 8 a.m. to 8 p.m. as the research object. The expression of the pixel matrix of the standardized original cloud image is:
In the expression,
The expression for the ground pixel matrix is obtained by cross-calculating the pixel values of the satellite cloud images taken at different times:
Therefore, after standardizing and removing the ground information, the pixel expression of the satellite cloud image is:
Here,
The results of the processing procedure are shown in Figure 1.
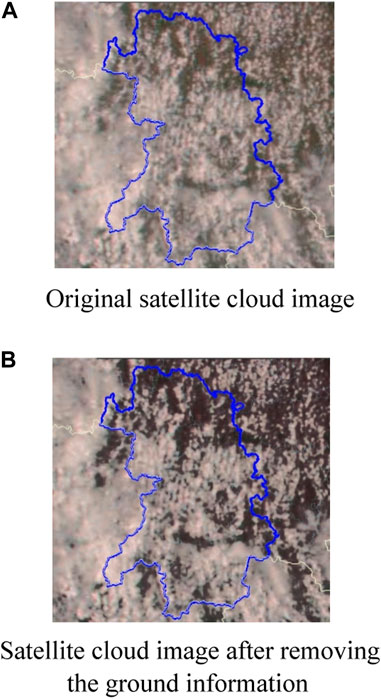
FIGURE 1. Satellite cloud image preprocessing process.
1.2 Cloud type feature extraction
Following the preprocessing steps, we attain satellite cloud images from which distributed photovoltaic locations and ground-related data have been extracted. To extract shading characteristics across distinct positions within the cloud image, additional processing steps are requisite.
The thickness and classification of the cloud layer constitute critical parameters for deducing shading attributes. Given that satellites are positioned above cloud formations, thicker clouds tend to reflect a greater amount of sunlight, thereby resulting in higher brightness levels within the cloud image. As pixel values in the cloud image are directly correlated with brightness, the thickness of the cloud layer can be inferred from the pixel values.
To determine the cloud thickness at the site of the distributed photovoltaic power station, the initial step involves conducting grayscale manipulation on the original satellite cloud image. In this study, the average method for grayscale computation is employed. The formula for this calculation is as follows:
Among them, represent the
Moreover, the acquisition of cloud layer type information is imperative. In the satellite datasets originating from China’s FY-4 meteorological satellite platform, cloud type data from historical meteorological cloud images can be directly retrieved. These cloud types encompass categories such as “warm water clouds,” “supercooled water clouds,” “mixed clouds,” “thick ice clouds,” “cirrus clouds,” and “multilayered clouds.” Distinct cloud types impart varying shading effects on sunlight. Within this data platform, diverse cloud types are distinguished by distinct colors within the cloud image. Once the cloud type image data from different historical moments is obtained, subsequent processing steps are required to extract the pertinent cloud type data.
An alternative image representation, known as HSV (Hue, Saturation, and Value), adeptly captures the inherent cloud type attributes within the image. Consequently, prior to computing the cloud layer thickness, the original satellite cloud image must be transformed into the HSV format through the applicable conversion formula:
Here, max = max (R, G, B), min = min (R, G, B). H represents the hue of the image, S represents the saturation, and V represents the brightness (Zheng et al., 2018). The V component presents the original brightness level at each position, in other words, the color brightness level feature, which corresponds to the interval [0,1]. If the color contains light source color information, the brightness value is related to the luminance of the light source.
The threshold segmentation model is used to divide the “ground-removed” cloud image into different thickness regions. According to the clear-sky theory, the transmittance coefficient at positions not covered by cloud clusters is set to 1, and the projection coefficient is inversely proportional to the thickness of the cloud cluster. The transmittance matrix
Therefore, the formula for calculating the shading feature of the cloud layer based on the color feature of the cloud layer type in this public data platform can be expressed as follows:
Here,
As time progresses, clouds at distinct locations will manifest specific dynamic traits, illustrating a process of change depicted in Figure 2.
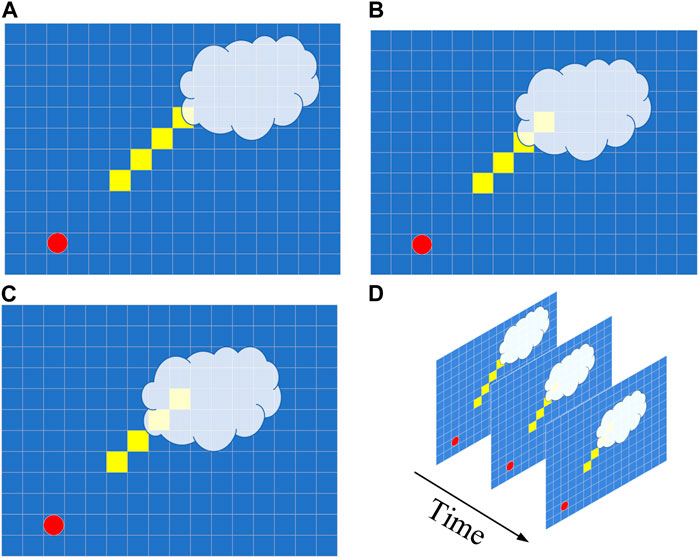
FIGURE 2. Schematic diagram of extracting cloud image masking features. (A) t0, (B) t1, (C) t2 and (D) t3.
In the illustration, red designates the Sun’s position, yellow squares denote photovoltaic power plants situated at varying locations, and the white portion represents the cloud layer. Figure 2A–C illustrate the cloud cover effects at different positions during time instances t0, t1, and t2, correspondingly. The overarching changes throughout the process are depicted in Figure 2D. The varying masking attributes at distinct positions and times can be articulated using Formula (12). Each time point t’s masking attributes are delineated by Formula (11), encompassing both gray and the aforementioned attributes. In the ensuing section, these masking characteristics at divergent times and positions serve as time series inputs within the forecasting model, facilitating the computation of masking features for forthcoming time instances.
2 Prediction of shading characteristics based on satellite cloud images
2.1 Shading feature prediction model
The thickness and shape of the cloud layer are the main factors affecting the shading effect of the cloud layer on solar irradiance, and the thickness and shape characteristics of the cloud layer change over time. In order to obtain accurate predictions of distributed photovoltaic output, it is necessary to effectively predict the cloud layer over a short period of time.
Given the dynamic alterations inherent in satellite cloud images, it becomes possible to amalgamate thickness attributes with cloud types, thereby constructing a three-dimensional matrix encapsulating shading features. The three-dimensional matrices established across distinct historical moments can then serve as historical shading sequences, enabling the prediction of forthcoming shading characteristics at future instances.
The three-dimensional shading characteristics can be represented as:
Here,
Owing to its varying dynamics across different time points, the dataset can be conceptualized as an aggregation of satellite cloud image video frames exhibiting distinct temporal attributes. Within the domain of video frame prediction models, Graph Convolutional Networks (GCN) have demonstrated effective predictive capabilities. Given the three-dimensional nature of the data across disparate moments, to ensure a dependable three-dimensional graphical prediction outcome, enhancements are necessary for the existing GCN network. Building upon this premise, the current research introduces a DC-GAN prediction model.
The proposed model amalgamates the functional attributes of Conv-LSTM, GAN network, and Convolutional Dynamic Neural Advection (CDNA) modules (de Freitas Viscondi and Alves-Souza, 2019). This fusion not only refines the three-dimensional structural characteristics within video frames but also enhances the temporal precision across these frames. The schematic representation of the prediction model is illustrated in Figure 3.
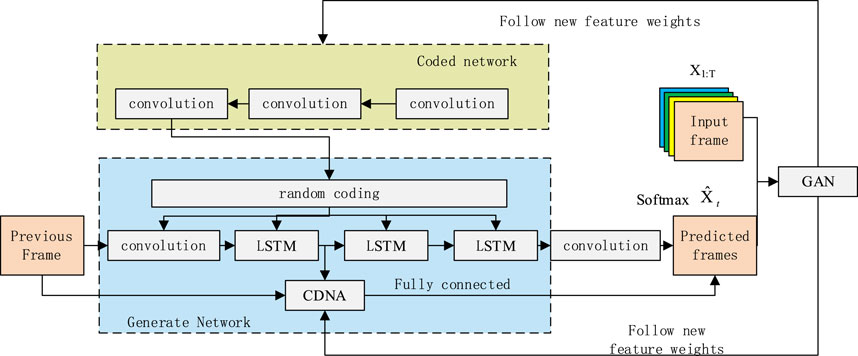
FIGURE 3. Video frame prediction model of network satellite cloud image based on DC-GAN.
The model architecture encompasses three primary components: an encoding network, a generating network, and a generative adversarial network (GAN). The encoding network is primarily tasked with feature extraction from the sample sequence. These extracted features are then utilized as inputs to the generating network, which aims to rectify the real-time sequence attributes of the video. The generating module, highlighted within the blue region in Figure 1, is primarily constituted by multiple layers of convolutional LSTM and CDNA.
Given that video frame prediction fundamentally entails sequence prediction, LSTM exhibits commendable predictive prowess within time series forecasting models. Consequently, multiple layers of convolutional LSTM are employed for video frame prediction. However, in practical scenarios employing the original LSTM model for video frame prediction, the preservation of object structure information across numerous frames and the accuracy of cloud layer position prediction after multiple frames prove challenging. To surmount these limitations, CDNA is introduced to enhance the original convolutional LSTM model. The abovementioned architecture strives to address these limitations and achieve improved video frame prediction results.
In the generating network of the model, the computation function of the GAN (Gu et al., 2021) is:
Here,
The CDNA module is added to the generating network optimization module. A set of convolutional kernels predicted by CDNA module is applied to the previous frame image to obtain multiple intermediate images with the same resolution, and their formula is:
Here,
After the optimization with CDNA, the generating network can effectively improve the difference between the cloud masking features generated at future time steps and the real masking features, thereby improving the prediction accuracy of the model.
2.2 Evaluation indicators for prediction results
To validate the effectiveness of the proposed model for video frame prediction, the Structural Similarity Index (SSIM) is used as the evaluation metric.
SSIM has a value range of 0–1, with a larger value indicating a higher similarity between the predicted and real frames, which indicates better prediction performance of the model (Zhang et al., 2020). The SSIM formula is based on three comparison measures between samples X and Y, namely, luminance, contrast, and structure. The calculation formulas are represented as follows:
In the formula,
If
3 Distributed photovoltaic irradiance and power output prediction
Building upon the outlined steps, the shading characteristics pertinent to the distributed photovoltaic system can be derived. To progress beyond and acquire irradiance and output data for the distributed photovoltaic system, the establishment of a robust prediction model becomes imperative.
In forecasting the irradiance of the distributed photovoltaic system, owing to the temporal correlation inherent in the cloud shading attributes at its location and the spatial correlation with irradiance data from neighboring centralized photovoltaic systems, a prediction model can be formulated grounded in the temporal traits of adjacent centralized photovoltaic system irradiance data and cloud shading characteristics. As for projecting the output of the distributed photovoltaic system, given its time-series nature tightly linked with variables such as irradiance, temperature, photovoltaic capacity, and others, a prediction model akin to the irradiance prediction model can be employed.
In the domain of time-series prediction, Long Short-Term Memory (LSTM) networks possess exceptional prowess in generating sequential outputs and predictions, and they have garnered widespread application in recent years. For the prediction model’s data preprocessing, the irradiance data derived from cloud maps requires transformation into time-series data. Moreover, variables like temperature, humidity, wind speed, precipitation, and barometric pressure, which influence photovoltaic output, necessitate consideration. Convolutional Neural Networks (CNNs) are adept at extracting features and can be employed to extract cloud map-based irradiance data and process other relevant variables impacting photovoltaic output. In the central component of the output prediction model, a multilayer LSTM network is deployed to fulfill the output prediction task. The architectural representation of the distributed photovoltaic system’s irradiance and output prediction models is delineated in Figure 4.
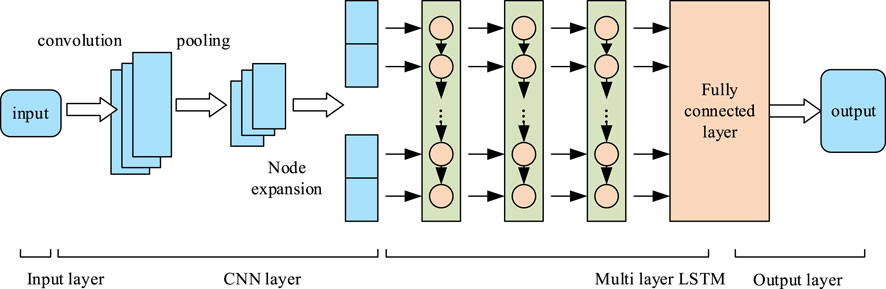
FIGURE 4. Distributed photovoltaic output forecast flow chart.
4 Case study
4.1 The simulation data of experiment
To validate the effectiveness of the proposed method, the experimental section selects photovoltaic data from Jianghua Yao Autonomous County, Yongzhou City, Hunan Province as the research object. The basic information of the photovoltaic power plants in the region is shown in Table 1. Among them, the Zhugu Ba Photovoltaic Power Station (No. 4) is considered as a nearby centralized photovoltaic power station, and the rest are considered as distributed photovoltaic power stations.

TABLE 1. Basic information of photovoltaic power station.
Due to the sampling frequency of the power output data in the photovoltaic power station being 15 min per data point, while the irradiance data being 5 min per data point, downsampling of the irradiance data is required to maintain consistency between the two frequencies. After downsampling, the sampling frequency of both the photovoltaic output data and irradiance data is 15 min per data point.
The prediction part of the experiment is divided into two parts: irradiance prediction and photovoltaic output prediction for distributed photovoltaic power stations. The prediction results are evaluated using Mean Absolute Error (MAE), Root Mean Square Error (RMSE) Mean Absolute Percentage Error (MAPE) and
In irradiance prediction,
4.2 Simulation environment and important parameters setting
The software in the experimental platform of this research is built based on TensorFlow and PyTorch in the python language, and the hardware platform is built with Intel Core i5-10210 (CPU) and NVIDIA GeForce GTX 1660 Ti (GPU).
In the prediction of cloud cover characteristics, a graph-based prediction model is used, and the graph is converted into corresponding matrix parameters after data preprocessing. The size of the input frame of the transformed data is a matrix of 64
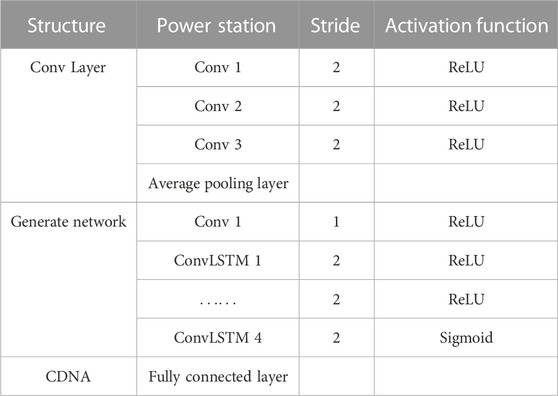
TABLE 2. Masking feature prediction model related parameters.
In the photovoltaic output forecast, the input variables include satellite cloud image shading features (2-dimensional), historical output, temperature, moderate, wind speed, precipitation, air pressure, which are 8-dimensional time series. Therefore, the input of the model is a vector of 8
4.3 Evaluation indicators for prediction results
To verify the effectiveness of the proposed irradiance prediction method based on DC-GAN using satellite cloud map video frames, real irradiance data was used as the benchmark to compare with NWP irradiance data and the irradiance data calculated in this research. Additionally, the accuracy of irradiance prediction under different weather conditions was also taken into consideration. To accomplish this, historical irradiance data under sunny, light rain, overcast, and cloudy conditions were extracted for the region during 2021. The irradiance data during the sunny period was from 13 February 2021 7:00 to 15 February 2021 19:00. The data during the change from light rain to overcast to cloudy weather conditions was from 10 February 2021 7:00 to 12 February 2021 19:00.
Before evaluating the accuracy of irradiance prediction, an evaluation of the prediction results based on satellite cloud map video frames was necessary. As mentioned in the research, Structural Similarity Index (SSIM) was used as the evaluation metric for the prediction results of video frames. Because the SSIM of the prediction results for different video frames at different times is not the same, the average prediction error of the video frames within a 4-h period under different weather conditions was used as the evaluation metric. The average SSIM of cloud map video frame predictions during different time periods are shown in Table 3.
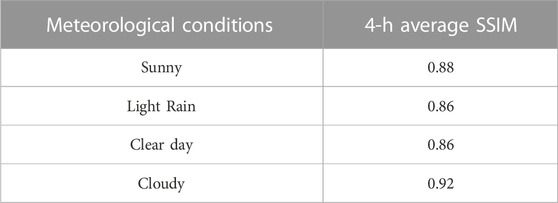
TABLE 3. Prediction error results of irradiance under different meteorological conditions.
From Table 2, it can be seen that the average SSIM of video frame predictions based on satellite cloud map shading features is above 0.86, which achieves the ideal prediction result.
After completing the prediction of video frames based on the shading features, future satellite cloud maps were obtained. The proposed method in this research was then applied to calculate the future irradiance based on the cloud maps. To avoid unreliable calculation results caused by large errors in the irradiance data of individual photovoltaic power stations, the average irradiance data of the three power stations mentioned above were used as the evaluation metric. The irradiance prediction curves under different weather conditions are shown in Figure 5.
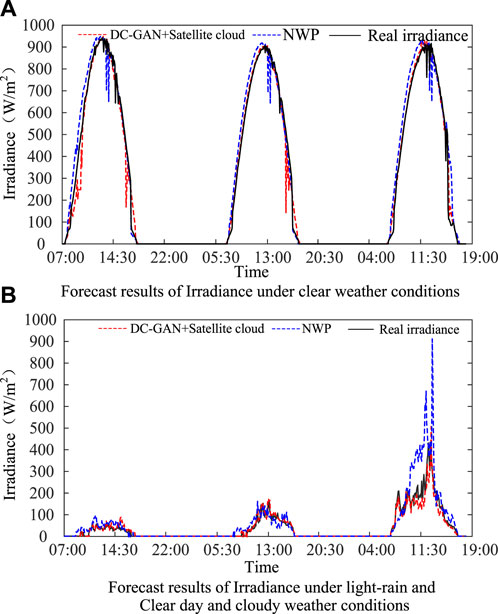
FIGURE 5. Comparison of irradiance prediction results.
From Figure 5A, it can be seen that under sunny conditions, the irradiance prediction results based on DC-GAN and satellite cloud map and NWP are both close to the real irradiance curve. Table 4 details the MAE and RMSE values of the irradiance results obtained from different methods.
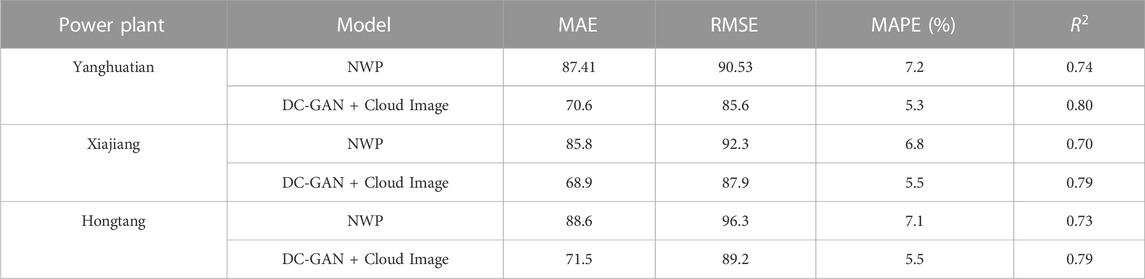
TABLE 4. Irradiance error results of different power stations.
From Figure 5B, it can be seen that under continuously changing weather conditions, the method proposed in this research is closer to the real irradiance curve compared to NWP. Table 5 records the average irradiance error results for different power stations under sunny conditions.
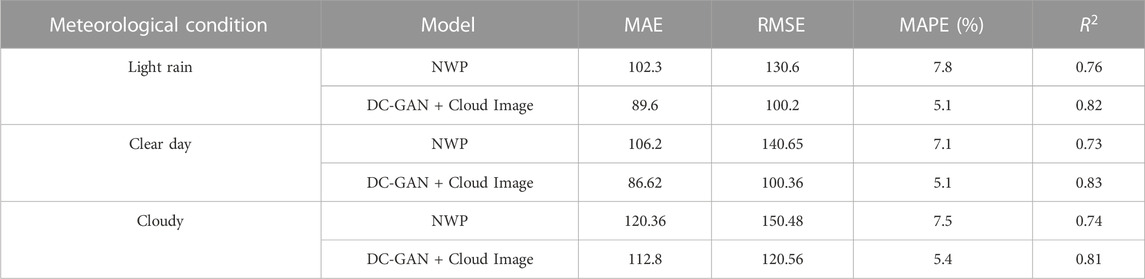
TABLE 5. Prediction error results of irradiance under different meteorological conditions.
From the table, it can be seen that under light rain and overcast conditions, the method proposed in this research and the NWP-based irradiance values have relatively small errors. However, under cloudy weather conditions, although both the method proposed in this research and the NWP-based irradiance calculation results have large errors, the method proposed in this research is closer to the real irradiance data compared to NWP.
4.4 Evaluation indicators for prediction results
Based on the irradiance calculation results mentioned above, the method proposed in Section 3 is used to predict the power output of distributed photovoltaic systems. The main purpose of the power prediction part is to verify the effectiveness of the proposed irradiance calculation method based on satellite cloud maps. Therefore, this experiment only compares the real load data with the prediction method proposed in this research.
In the realm of photovoltaic power prediction research, prevailing methodologies often revolve around weather-power time series features. Among the array of deep learning techniques, the LSTM neural network has demonstrated superior predictive capabilities within the context of time series forecasting. In recent times, the LSTM-based Bi-LSTM neural network and CNN-LSTM neural network models have emerged as benchmark frameworks, employed to gauge and compare prediction effectiveness across various models. Therefore, this study employs the Bi-LSTM and CNN-LSTM neural network models as benchmark references for performance evaluation and comparison purposes.
In this prediction model, 80% of the dataset is used as the training set and 20% is used as the test set. The time period of the dataset is from 29 January 2021, to 15 February 2021.
Since the main influencing factor of photovoltaic output is the irradiance data, the output data of a photovoltaic power station can be used for verification. In this research, the output data of Huayangtian distributed power station, which has the largest capacity, is used for calculation under sunny weather conditions, and the results of the distributed photovoltaic output are shown in Figure 6.
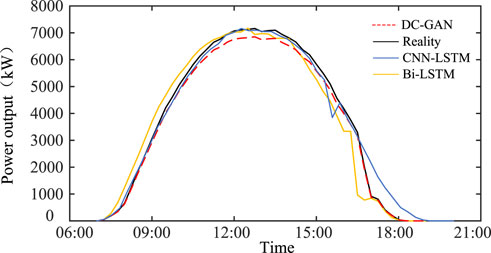
FIGURE 6. Output forecast results under sunny weather conditions.
From the figure, it can be seen that under sunny weather conditions, the distributed photovoltaic output prediction results proposed in this research are close to the real photovoltaic output results, with an MAE value of 0.25WM and an RMSE value of 0.43WM. Figure 7 shows the predicted and real power output curves of Huayangtian meteorological station under cloudy weather conditions.
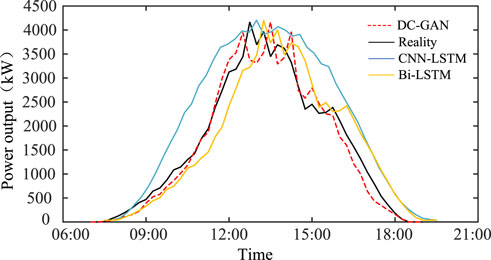
FIGURE 7. Output forecast results under cloudy weather conditions.
In the figure, it can be seen that under cloudy weather conditions, the photovoltaic output fluctuates significantly, with larger MAE and RMSE values than under sunny weather conditions. However, the trend of the proposed prediction results is basically consistent with the trend of the real photovoltaic output. Under extreme weather conditions, the method proposed in this research can provide reliable photovoltaic output prediction data.
To facilitate a comprehensive assessment of the efficacy of the proposed approach, an extensive analysis has been conducted. In addition to the accuracy of photovoltaic power prediction, the study also delves into the comparative evaluation of method robustness and computational efficiency.
The analysis of method stability encompasses the utilization of two key metrics: cross-validation and outlier detection. By employing these indicators, the stability of the model can be accurately gauged. In terms of computational efficiency, the comparison is based on uniform datasets and identical network layer configurations. To ensure consistency, the same software and hardware computing platforms are employed to measure the computational time required for diverse iterations.
In the context of the stability comparative analysis, this study employs the 5-fold cross-validation methodology for verification and examination. In this technique, the dataset is partitioned into five distinct subsets. During each round of validation, one of the five subsets is designated as the validation set, while the remaining four subsets form the training set. Subsequently, the model is trained using the training set and evaluated using the validation set. The performance evaluation is carried out using metrics such as mean squared error (MSE) and accuracy, with these evaluations conducted after each validation round. As a result, five sets of performance evaluation results are generated, facilitating the analysis of the stability and generalization capabilities of diverse prediction models.
Table 6 provides an overview of the MSE and accuracy scores derived from the prediction outcomes during various verification rounds in the context of five-fold cross-validation for different prediction models.
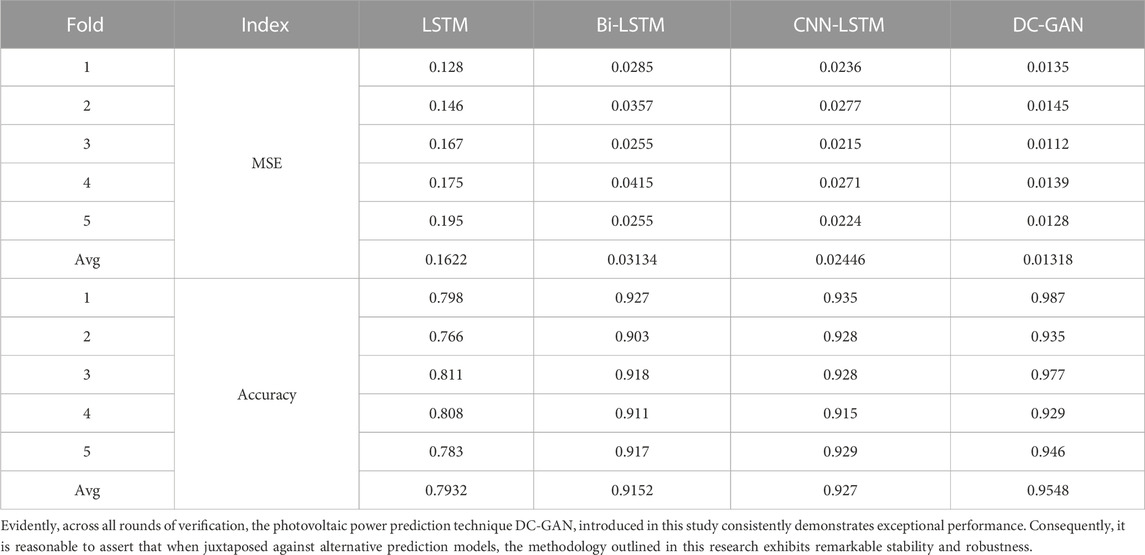
TABLE 6. MSE value and accuracy of different prediction models in cross-validation.
Furthermore, the computational resources demanded by a model constitute a pivotal criterion for assessing its performance. To comprehensively evaluate the computational efficiency of the model presented in this study, a simulation analysis experiment was conducted on a consistent simulation platform. In this experiment, the computation times of various methods were juxtaposed and examined. The outcomes are elucidated in Table 7 below.

TABLE 7. The time required for different model simulations.
The results reveal that among the various models, LSTM exhibits the shortest computation time, followed by DC-GAN, and then Bi-LSTM and CNN-LSTM. This disparity can be attributed to the distinctive nature of the LSTM network structure, which entails fewer layers and thereby contributes to the shortest calculation time. In contrast, Bi-LSTM incurs nearly twice the calculation time as compared to LSTM, primarily due to the incorporation of an additional orientation layer within the Bi-LSTM network.
When compared to Bi-LSTM, the calculation time for the CNN-LSTM model is prolonged. This elongation is a consequence of the more intricate network structure inherent in the CNN-LSTM model, encompassing both generation and adversarial networks within the DC-GAN architecture. Notwithstanding the complexity, DC-GAN’s calculation time is comparatively shorter than that of Bi-LSTM and CNN-LSTM networks. This highlights an enhancement in calculation efficiency achieved by the proposed DC-GAN approach as opposed to the other benchmarked models.
5 Conclusion
In order to address the issue that distributed photovoltaic power stations do not have reliable meteorological information for accurate output prediction, this research proposes a distributed photovoltaic output prediction method based on satellite cloud map video frames.
In the irradiance prediction stage of distributed photovoltaic power stations, video frames are established based on the shading characteristics of cloud maps at different time periods. Then, a prediction model DC-GAN is established to predict the shading effect of future short-term cloud map shading characteristics, using the dynamic changes of satellite cloud map shading characteristics at past time periods as the input to the model to obtain the shading effect of the distributed photovoltaic power station at its location in the near future. Then, the CNN-LSTM prediction model is used in combination with the spatial correlation of centralized photovoltaic power stations to obtain irradiance data for the distributed photovoltaic power station at its location in the near future.
In the distributed photovoltaic output prediction stage, the CNN network is first used to extract irradiance features from future short-term satellite cloud maps, and then a multi-layer photovoltaic output prediction model based on LSTM is established. The irradiance information from different locations, as well as temperature, humidity, wind speed, precipitation, and other information, are used as input sequences of the prediction model to obtain output prediction data for the distributed photovoltaic power station in the near future.
In the experiment section, the calculated irradiance data are compared with the irradiance data based on NWP information and real irradiance data to verify the accuracy and reliability of the proposed method for distributed photovoltaic irradiance calculation. A CNN-LSTM neural network-based distributed photovoltaic output prediction model is proposed based on the characteristics of the distributed photovoltaic irradiance calculation results. The results show that the model can provide effective distributed photovoltaic output prediction values and provide data support for the operation and management of distributed photovoltaic power stations.
The change of cloud cover in cloudy or rainy weather conditions is more varied and rapid than in clear sky conditions. In addition, when there is rainfall, the changes of temperature and humidity are relatively obvious, and the time resolution of temperature and humidity data in NWP data is relatively low, so there will be relatively large errors in prediction. In the comparative analysis of other methods, there are also cases of cloudy or rainy days with large errors. The advantage of the method proposed in this paper is that compared with other models, its calculation accuracy is relatively high, and the utilization of computing resources and computing efficiency have been improved to a certain extent compared with other algorithms. In the follow-up research, we can try to increase the sampling density of satellite cloud images, and use the interpolation method to increase the data sampling rate while maximizing the density of public data platforms, so as to capture the changes of cloud images more accurately.
Data availability statement
The original contributions presented in the study are included in the article/supplementary material, further inquiries can be directed to the corresponding author.
Author contributions
HS and FX performed the data analysis; WX performed the formal analysis; ZC and ZF performed the validation; WJ wrote the manuscript. All authors contributed to the article and approved the submitted version.
Funding
This work was supported by the Science and Technology Project of State Grid Jiangsu Electric Power Co., Ltd. (J2022007). The funder was not involved in the study design, collection, analysis, interpretation of data, the writing of this article or the decision to submit it for publication.
Conflict of interest
Authors HS, WX, ZC, ZF, and WJ were employed by State Grid Jiangsu Electric Power Co., Ltd. Suqian Power Supply Branch. FX was employed by State Grid Jiangsu Electric Power Company Limited Electric Power Research Institute.
Publisher’s note
All claims expressed in this article are solely those of the authors and do not necessarily represent those of their affiliated organizations, or those of the publisher, the editors and the reviewers. Any product that may be evaluated in this article, or claim that may be made by its manufacturer, is not guaranteed or endorsed by the publisher.
References
Akhter, M. N., Mekhilef, S., Mokhlis, H., and Mohamed Shah, N. (2019). Review on forecasting of photovoltaic power generation based on machine learning and metaheuristic techniques. IET Renew. Power Gener. 13 (7), 1009–1023. doi:10.1049/iet-rpg.2018.5649
Bian, H., and Sun, J. (2021). Photovoltaic power generation prediction model based on optimized TMY Method-GRNN. Electr. Power Eng. Technol. 40 (05), 94–99.
Botong, L., Mingrui, L., and Mengqing, L. (2022). PV power generation forecast model based on path analysis and phase space reconstruction. Electr. Meas. Instrum. 59 (11), 79–87. doi:10.19753/j.issn1001-1390.2022.11.011
Chen, Y., Wen, M., Zhang, K., et al. (2022). Short-term photovoltaic output forecasting based on similar day matching and TCN-Attention. Electr. Meas. Instrum. 59 (10), 108–116. doi:10.19753/j.issn1001-1390.2022.10.016
Cheng, L., Zang, H., Wei, Z., Ding, T., Xu, R., and Sun, G. (2021). Short-term solar power prediction learning directly from satellite images with regions of interest. IEEE Trans. Sustain. Energy 13 (1), 629–639. doi:10.1109/tste.2021.3123476
de Freitas Viscondi, G., and Alves-Souza, S. N. (2019). A Systematic Literature Review on big data for solar photovoltaic electricity generation forecasting. Sustain. Energy Technol. Assessments 31, 54–63. doi:10.1016/j.seta.2018.11.008
Devi, Y. S., and Phani Kumar, S. (2022). DR-DCGAN: A deep convolutional generative adversarial network (DC-GAN) for diabetic retinopathy image synthesis. Webology (ISSN 19, 2.
Gao, M., Li, J., Hong, F., and Long, D. (2019). Day-ahead power forecasting in a large-scale photovoltaic plant based on weather classification using LSTM. Energy 187, 115838. doi:10.1016/j.energy.2019.07.168
Gu, B., Shen, H., Lei, X., Hu, H., and Liu, X. (2021). Forecasting and uncertainty analysis of day-ahead photovoltaic power using a novel forecasting method. Appl. Energy 299 (2021), 117291. doi:10.1016/j.apenergy.2021.117291
Hou, J., Wang, H., and Liu, P. (2018). Applying the blockchain technology to promote the development of distributed photovoltaic in China. Int. J. Energy Res. 42 (6), 2050–2069. doi:10.1002/er.3984
Jiang, S., Wan, C., Chen, C., Cao, E., and Song, Y. (2018). Distributed photovoltaic generation in the electricity market: status, mode and strategy. CSEE J. Power Energy Syst. 4 (3), 263–272. doi:10.17775/cseejpes.2018.00600
Kong, X., Liu, X., Ma, L., and Lee, K. Y. (2019). Hierarchical distributed model predictive control of standalone wind/solar/battery power system. IEEE Trans. Syst. Man, Cybern. Syst. 49 (8), 1570–1581. doi:10.1109/tsmc.2019.2897646
Li, K., Wang, F., Mi, Z., Fotuhi-Firuzabad, M., Duić, N., and Wang, T. (2019). Capacity and output power estimation approach of individual behind-the-meter distributed photovoltaic system for demand response baseline estimation. Appl. energy 253, 113595. doi:10.1016/j.apenergy.2019.113595
Lin, G. Q., Li, L. L., Tseng, M. L., Liu, H. M., Yuan, D. D., and Tan, R. R. (2020). An improved moth-flame optimization algorithm for support vector machine prediction of photovoltaic power generation. J. Clean. Prod. 253, 119966. doi:10.1016/j.jclepro.2020.119966
Peng, S., Zheng, G., Huang, S., et al. (2020). Multipule-feature short-term photovoltaic generation forecasting based on XGBoost altorithm. Electr. Meas. Instrum. 57 (24), 76–83. doi:10.19753/j.issn1001-1390.2020.24.010
Qiao, Y., Sun, R., and Ding, R. (2021). Distributed photovoltaic station cluster short-term power forecasting Part II: gridding prediction. Power Syst. Technol. 45 (06).
Si, Z., Yang, M., Yu, Y., and Ding, T. (2021). Photovoltaic power forecast based on satellite images considering effects of solar position. Appl. Energy 302, 117514. doi:10.1016/j.apenergy.2021.117514
Son, Y., Yoon, Y., Cho, J., and Choi, S. (2022). Cloud cover forecast based on correlation analysis on satellite images for short-term photovoltaic power forecasting. Sustainability 14 (8), 4427. doi:10.3390/su14084427
Tian, S., Sun, L., and Zhou, Xu (2022). Construction site resource allocation strategy of distributed photovoltaic in incremental distribution network based on game theory. Acta Energiae Solaris Sin. 43 (08), 41–49.
Wang, F., Xuan, Z., Zhen, Z., Li, K., Wang, T., and Shi, M. (2020). A day-ahead PV power forecasting method based on LSTM-RNN model and time correlation modification under partial daily pattern prediction framework. Energy Convers. Manag. 212, 112766. doi:10.1016/j.enconman.2020.112766
Yu, D., Lee, S., Lee, S., Choi, W., and Liu, L. (2020). Forecasting photovoltaic power generation using satellite images. Energies 13 (24), 6603. doi:10.3390/en13246603
Zhang, J., Zhang, Q., Ma, Yuan, et al. (2020). Fuzzy clutering-Elman neural network model for short-term photovoltaic power generation prediction. Electr. Meas. Instrum. 57 (12), 46–51. doi:10.19753/j.issn1001-1390.2020.12.008
Zhang, Tongyan, Liao, Qingfen, and Tang, Fei (2019). Wide-area distributed photovoltaic power forecast method based on meteorological resource interpolation and transfer learning[J/OL]. Proc. CSEE 1-12.
Zheng, L., Liu, Z., Shen, J., and Wu, C. (2018). Very short-term maximum Lyapunov exponent forecasting tool for distributed photovoltaic output. Appl. Energy 229, 1128–1139. doi:10.1016/j.apenergy.2018.08.075
Keywords: distributed photovoltaic, satellite cloud image, shading feature, video frame prediction, DC-GAN, power output pre-diction
Citation: Shaohua H, Xin F, Xiuru W, Chenyu Z, Fuju Z and Jiaming W (2023) Distributed photovoltaic power output prediction based on satellite cloud map video frames. Front. Energy Res. 11:1247304. doi: 10.3389/fenrg.2023.1247304
Received: 25 June 2023; Accepted: 01 September 2023;
Published: 19 October 2023.
Edited by:
Fouzi Harrou, King Abdullah University of Science and Technology, Saudi ArabiaReviewed by:
Jingbo Wang, University of Liverpool, United KingdomBouyeddou Benamar, University of Saida, Algeria
Copyright © 2023 Shaohua, Xin, Xiuru, Chenyu, Fuju and Jiaming. This is an open-access article distributed under the terms of the Creative Commons Attribution License (CC BY). The use, distribution or reproduction in other forums is permitted, provided the original author(s) and the copyright owner(s) are credited and that the original publication in this journal is cited, in accordance with accepted academic practice. No use, distribution or reproduction is permitted which does not comply with these terms.
*Correspondence: Fang Xin, eHk0MzU0MDBAMTYzLmNvbQ==