 Xiaoyang Guo
 Jingyi Yang
 Yang Shen
 Xiuwu Zhang
94% of researchers rate our articles as excellent or good
Learn more about the work of our research integrity team to safeguard the quality of each article we publish.
Find out more
ORIGINAL RESEARCH article
Front. Energy Res. , 13 October 2023
Sec. Sustainable Energy Systems
Volume 11 - 2023 | https://doi.org/10.3389/fenrg.2023.1245820
Introduction: Strengthening the early warning of greenhouse gas emissions from agriculture is an important way to achieve Goal 13 of the Sustainable Development Goals. Agricultural carbon emissions are an important part of greenhouse gases, and accelerating the development of green and low-carbon agriculture is of great significance for China to achieve high-quality economic development and the goal of “carbon neutrality in peak carbon dioxide emissions”.
Methods: By measuring the total agricultural carbon emissions in China and seven administrative regions from 2000 to 2021, the paper analyzes the influencing factors of agricultural carbon emissions in China by using STIRPAT environmental pressure model, and on this basis, predicts the peak trend of agricultural carbon emissions in China under different development scenarios by using the extreme learning machine model optimized by genetic algorithm.
Results: The results showed that the extreme learning machine model improved by the genetic algorithm can overcome the shortcoming that the extreme learning machine model is easy to fall into the local optimal solution, thus obtaining higher prediction accuracy. At the same time, from 2000 to 2021, the total agricultural carbon emissions in China showed a continuous fluctuation trend, and due to the constraints of the agricultural economic level, agricultural industrial structure, and agricultural human capital, the agricultural carbon emissions showed spatial differentiation. It is worth noting that, in the context of green development, the agricultural carbon emissions of the seven regions in China all have the potential to achieve the “peak carbon dioxide emissions” goal in 2030, with only a slight difference at the peak.
Discussion: The research results of this paper provide evidence for the government to formulate flexible, accurate, reasonable and appropriate agricultural carbon reduction policies, which is helpful to strengthen the exchanges and cooperation of regional agricultural and rural carbon reduction and fixation, and actively and steadily promote China's agriculture to achieve the goal of “peak carbon dioxide emissions carbon neutrality”.
The climate problem is closely related to all aspects of human production and life, and the rapid increase in CO2 concentration in the atmosphere is the most crucial factor that causes climate change. Since China’s reform and opening-up, great achievements have been made in agricultural economic construction. However, behind the rapid economic growth, resources are increasingly exhausted and the ecological environment is deteriorating. Facing the dual constraints of resource shortage and environmental carrying capacity, the problem of modern ecological environment governance in agricultural and rural areas has never been systematically solved. Agriculture, as a natural ecological carbon sink system, has distinct industrial characteristics under the impact of climate change (Zhao et al., 2018; Guang et al., 2023). However, at present, the carbon sink capacity is insufficient to offset the greenhouse gases generated in its production process, posing a serious threat to global food security, human health, and sustainable economic and social development (Federici et al., 2015). According to the Food and Agriculture Organization (FAO) of the United Nations, global carbon emissions from agricultural and food systems increased by 16% between 1990 and 2020, reaching 17 billion tons of carbon dioxide-equivalent (CO2-eq) in 2020, accounting for 30% of global anthropogenic carbon emissions. As a major agricultural country, China’s agricultural carbon emissions account for approximately 24% of China’s greenhouse gas emissions, and this proportion is even increasing (Shi et al., 2023). Indeed, agricultural development has reached an important period when it is necessary to change the “environment for growth” development model. Promoting carbon sequestration and emission reduction in agriculture, significantly improving the degree of green production, and resource utilization efficiency have become important aspects for China to achieve carbon peak and carbon neutrality goals (Song et al., 2022; Wang et al., 2023b). As the world’s largest emitter of greenhouse gases, China is an active participant and contributor to the global response to climate change. In order to achieve the Sustainable Development Goals (SDGs) and practice the lofty mission of building a Community of Shared Future for Mankind, in September 2020, China solemnly announced at the 75th United Nations General Assembly that it would strive to achieve peak carbon dioxide emissions by 2030 and achieve carbon neutrality by 2060. Therefore, focusing on the relevant research of agricultural carbon emissions is not only conducive to achieving the goal of “double carbon” and the development of agricultural low-carbon life, further easing the bottleneck of resource elements and ensuring agricultural ecological security, but also conducive to thinking about moving toward food quality and security on the premise of ensuring food quantity security, further satisfying people’s demand for high-quality agricultural products and having important practical significance for preventing and resolving food safety risks and exploring the agricultural low-carbon path to realize “lucid waters and lush mountains are invaluable assets.”
From the published literature, the research contents and perspectives of agricultural carbon emissions are extensive, mainly focusing on carbon emission measurement (Sun et al., 2022a; Xu et al., 2023), driving factors (Su et al., 2023), temporal and spatial evolution (Chen et al., 2019; Liao and Liu, 2020), decoupling effect (Han et al., 2018; Zhang et al., 2022), and emission reduction path (Wang et al., 2020a; Cardoza Cedillo et al., 2023), and there is a lack of in-depth study on the trend prediction of agricultural carbon emissions. Specifically, the first is about the calculation of agricultural carbon emissions. Most scholars use the emission coefficient method (Guo et al., 2022a), agricultural ecosystem model (Zhao et al., 2019; Sun et al., 2023), methane emission model of paddy field (Wang et al., 2018), and regional nitrogen cycle model (Mao et al., 2018) to measure and analyze agricultural carbon emissions in different regions. Among them, it has become the mainstream practice to modify agricultural carbon emission sources and related emission coefficients on the basis of the emission coefficient method (Liu et al., 2013; Wójcik-Gront and Gront, 2014; Ghosh, 2018; Gao et al., 2023). The second is the research on the influencing factors of agricultural carbon emissions. Many scholars build an LDMI model based on Kaya identity proposed by Japanese professor Yoichi Kaya or use an econometric model to study the influence of driving factors on agricultural carbon emissions. For example, Shan et al. (2021) and Li et al. (2022) used the spatial Dobbin model and LDMI model, respectively, and thought that the agricultural industrial structure, intensive level, urbanization rate, and environmental regulation were important factors affecting agricultural carbon emissions. From the perspective of spatial correlation, Xia et al. (2019) used an ESTDA framework and GWR model to analyze the mechanism of the agricultural carbon emission rate and the evolution characteristics of the spatial pattern by factors such as the agricultural economic development level, farmers’ income structure, planting structure, and cultivated land scale. The third is about the trend prediction of agricultural carbon emissions. Scholars mainly rely on traditional forecasting methods to predict the peak value of agricultural carbon emissions, such as the environmental Kuznets curve (Pandey and Mishra, 2021; Ojaghlou et al., 2023), IPAT identity (Du et al., 2012; Yang et al., 2023), support vector machine model (Gao et al., 2022; Zhao et al., 2023), low-emission analysis platform (Sun et al., 2022b; Chen et al., 2023), gray forecasting model (Wang et al., 2023a; Saxena et al., 2023), and various combination models. On the basis of the extreme learning machine model (ELM), Wang et al. (2020b) used the whale algorithm to optimize it and used the WOA-ELM model to predict China’s carbon emissions, and the prediction results were more accurate. Jia and Chen (2023) used the improved support vector regression model optimized by the differential evolution gray wolf optimizer to predict agricultural carbon emissions in Hebei Province and compared the prediction results with the single support vector regression model, which showed that the former had higher prediction accuracy and faster convergence speed.
To sum up, the existing literature has carried out a lot of useful research on measuring agricultural carbon emissions in China, identifying the influencing factors of high carbon emissions and predicting the peak value of agricultural carbon emissions, which provides ideas and methods for this paper, but there is still some room for expansion.
The contribution of this paper is as follows. First, the evaluation index system constructed by the existing literature when measuring agricultural carbon emissions only considers the carbon dioxide released by agricultural films, pesticides, and agricultural machinery and equipment used in agricultural production and operation, ignoring the use of pesticides and fertilizers and the improper disposal of agricultural livestock manure, which causes certain pollution to soil, air, and agricultural products. So, the calculation results may be underestimated. This paper focuses on the agricultural ecological function, including agricultural materials, soil, paddy fields, and livestock breeding into the agricultural carbon emission accounting system, and measures the dynamic evolution process and key influencing factors of agricultural carbon emission levels in different regions of China. Second, when the existing literature studies predict the trend of agricultural carbon emissions, there are often phenomena such as complex calculation, poor stability, and lack of learning and testing processes, which leads to the problems of fuzzy internal relations and insufficient generalization ability of a complex nonlinear agricultural carbon emissions system, which reduces the accuracy of the predicted values (Bokde et al., 2021). In this paper, a GA-ELM model is constructed to predict agricultural carbon emissions in different development scenarios by using the excellent global optimization ability of the genetic algorithm and the high generalization of the ELM model so as to provide a quantitative reference for China to promote agricultural peak carbon dioxide emissions and carbon neutrality and realize high-quality green development.
Agricultural carbon emissions are an important part of global greenhouse gases (Vermont and Cara, 2010). Compared with other sectors, the carbon emission sources in the agricultural sector are more complicated. Considering the consistency of the agricultural industrial structure, statistical items, and data comparability in various regions of China, this paper uses the emission coefficient method to measure agricultural carbon emissions according to the 2006 National Greenhouse Gas Inventory Guidelines issued by the United Nations Intergovernmental Panel on Climate Change (IPCC). Referring to the practices of Hou et al. (2023), Shen et al. (2023), and Tian et al. (2023), this paper divides agricultural carbon emission sources into four dimensions, namely, agricultural materials, soil, paddy fields, and livestock breeding. The specific calculation formula is as follows:
In Eq. 1,
This paper focuses on the carbon emission in the process of agricultural land use, that is, the carbon emission caused by the production activities of human beings using agricultural land. According to the theory of agricultural production factors, the input factors of agricultural materials are defined, and five pollution sources, namely, chemical fertilizer, pesticide, agricultural film, diesel oil, and irrigation, are selected as the main sources of agricultural carbon emission, which are characterized by the amount of chemical fertilizer, pesticide, agricultural plastic film, agricultural diesel oil, and effective irrigation area, respectively. In addition, according to the existing literature (Li et al., 2023; Hu et al., 2023; Ye et al., 2023), the carbon emission coefficient of each carbon source can be determined, as shown in Table 1.

TABLE 1. Carbon emission coefficient of each production factor.
Due to plugging and leveling during planting crops such as rice and wheat, substances such as nitrogen and phosphorus are driven by rainfall and topography, which damage the soil surface to a certain extent and release a lot of greenhouse gases (Gangopadhyay et al., 2023). Among them, N2O is the most prominent. This gas has the characteristics of long air retention time and high single-molecule warming potential and is listed as the third largest greenhouse gas after carbon dioxide and methane (Qi et al., 1999). Referring to the practices of Xu et al. (2016), Zhao et al. (2023), and Mirzaei et al. (2022), this paper selected rice, wheat, soybean, and other crops as the main sources of N2O emission from soil and listed their N2O emission coefficients, as shown in Table 2.

TABLE 2. N2O emission coefficient from the soil of crop varieties (kg/hm2).
The greenhouse gas CH4 produced by rice fields is one of the important sources of agricultural carbon emissions (Hadi et al., 2010). Considering the regional differences in rice planting area, water-saving irrigation technology, and hydrothermal conditions in China, the CH4 released by rice fields in different regions is different. In view of this, this paper refers to the practices of Han et al. (2010), Zhou et al. (2022), Gangopadhyay et al. (2022), and Zhang et al. (2022), calculating the CH4 emission coefficient during the rice growth cycle in various regions. The specific results are shown in Table 3.
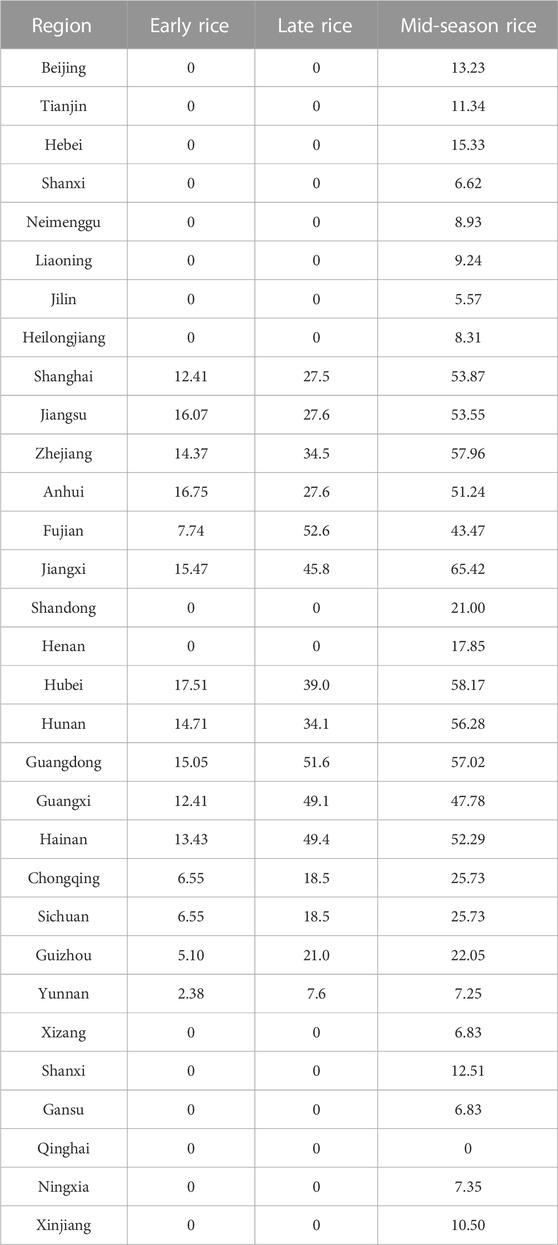
TABLE 3. CH4 emission coefficient of paddy fields in different growth periods (g/m2).
Carbon emission from livestock farming mainly includes CH4 emission caused by the intestinal fermentation of herbivorous livestock and CH4 emission and N2O emission caused by manure storage and management. Referring to the practices of Nunes (2023), Zhang et al. (2023a), and Akamati et al. (2023), this paper selects cattle, horses, donkeys, mules, camels, pigs, goats, and sheep as the important sources of carbon emissions from livestock farming. The carbon emission coefficients of various livestock are shown in Table 4.
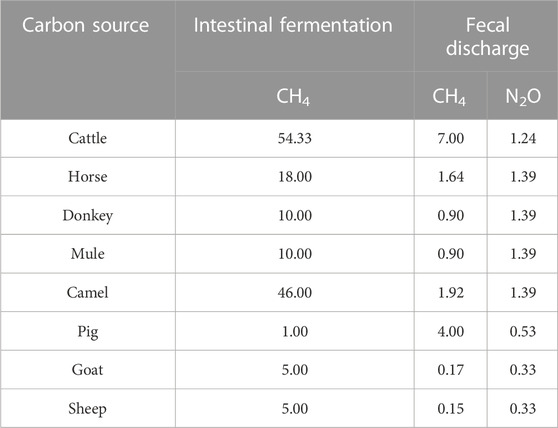
TABLE 4. Carbon emission coefficient corresponding to the main livestock breeds (kg/head year).
The STIRPAT model, an important tool for environmental analysis, is derived from the IPAT environmental pressure equation proposed by Ehrlich et al. and is widely used to analyze the non-proportional impact of human driving factors on the environment (Ehrlich and Holdren, 1971). In this paper, referring to the practices of Guo et al. (2022b), Zhang et al. (2023b), Peng et al. (2023), and Liu et al. (2023), a nonlinear STIRPAT model with multiple independent variables is constructed, and its basic formula is as follows:
In Eq. 2,
The STIRPAT model not only overcomes the limitation of the assumption that the traditional IPAT environmental pressure equation “all factors have the same influence degree” but also expands and improves the model through increase or decrease or factor decomposition so as to enhance its own analysis and interpretation ability to better qualitatively or quantitatively analyze the impact of human indicators on carbon emissions (Chen et al., 2014). Based on the existing research results, agricultural industrial structure, agricultural carbon emission intensity, per capita agricultural GDP, and rural population all have significant effects on agricultural carbon emissions (Wang et al., 2012; Fang et al., 2019; Zhu et al., 2019). Therefore, in this paper, the aforementioned four macro factors are regarded as important factors affecting agricultural carbon emissions; the environmental pressure is represented by agricultural carbon emissions, and the STIRPAT model is extended, which is expressed as
Logarithmic transformation of Eq. 4 yields the following expression:
In Eq. 5,
Extreme learning machine is a machine learning method proposed by Huang et al. (2006) based on a single-hidden layer feedforward neural network (SLFN), which has good learning ability and nonlinear approximation ability. This algorithm fills the defect that the SLFN needs to constantly adjust parameters according to the loss function, can randomly generate the input layer weight matrix and threshold of hidden layer nodes, abandons the iterative adjustment strategy of the gradient descent algorithm, and no longer falls into the local optimal solution because of the step size setting problem, thus improving the training speed and prediction accuracy (Huang et al., 2012; Wu et al., 2023).
Given any N different training samples
In Eq. 6,
In fact, when the input weight
Because the weight matrix of the input layer and the threshold of the hidden layer in the ELM algorithm are randomly set, it is impossible to ensure that the final calculation results reach the ideal accuracy. Therefore, in order to improve the stability and accuracy of the output results of the ELM algorithm and avoid over-fitting, this paper uses the genetic algorithm to optimize the weight matrix and threshold of the ELM model and accelerate the convergence speed of the ELM model. Specifically, the genetic algorithm, as a heuristic intelligent search algorithm for the optimal solution, simulates genetic operations such as chromosome cross-pairing and mutation according to the natural law of “survival of the fittest,” thus iterating the feasible solution of the optimization problem and constantly approaching the optimal solution. Therefore, the genetic algorithm has stronger global optimization performance and higher general fitness function. The GA-ELM model abstracts the “input weight
Step 1. The topology structure of the ELM neural network is determined, the input weights and hidden layer thresholds are encoded, and the initial solution population
In Eq. 8,
Step 2. After decoding, the input weights and hidden layer thresholds of the neural network are obtained and brought into the ELM network, and the objective function is set.
In Eq. 9,
Step 3. The fitness function, population size, and evolutionary algebra are determined. Generally speaking, the reciprocal of the mean square deviation between the actual and expected values of the ELM algorithm is used to characterize the fitness function, that is,
Step 4. The optimal fitness function
Step 5. The optimal fitness function
In order to evaluate the prediction accuracy of the GA-ELM model,
Following the principle of data availability and consistency of statistical caliber, this paper selects the panel data of 31 provinces in the Chinese mainland from 2000 to 2021 as statistical samples. The original data of all variables mainly come from the China Statistical Yearbook, China Rural Statistical Yearbook, China Rural Management Statistical Yearbook, China Population and Employment Statistical Yearbook, China Rural Poverty Detection Report, China Environmental Statistical Yearbook, China Energy Statistical Yearbook, and statistical bureaus of various provinces and cities. All the economic variables involved in monetary measurement in this paper are smoothed based on 2000.
In this paper, agricultural industrial structure, agricultural carbon emission intensity, per capita agricultural GDP, and rural population are taken as the input data of the model. Considering that the magnitude difference between the influencing factors may affect the prediction effect, this paper standardizes the data before fitting the model, and the calculation formula is as follows:
In Eq. 15,
In order to test the fitting accuracy of the GA-ELM model, this paper selects historical data from 2000 to 2015 as the training set, historical data from 2016 to 2021 as the test set, and the fitting results of the test set as the model fitting result standard to verify the fitting accuracy of the model. At the same time, this paper also compares the fitting results of the GA-ELM model with ELM, BP, and GWO-SVM models. The specific calculation results are shown in Table 5. It is not difficult to see from Table 5 that the fitting effect of the GA-ELM model is the best. In different provinces (cities and autonomous regions) and different historical data, the GA-ELM model can achieve higher fitting accuracy.

TABLE 5. Result comparison of the model error index.
According to the aforementioned agricultural carbon emission calculation method, the total agricultural carbon emission of China from 2000 to 2021 is calculated, and the agricultural carbon emission intensity is obtained by combining the agricultural GDP of China. Figure 1 and Table 6 show the calculation results.
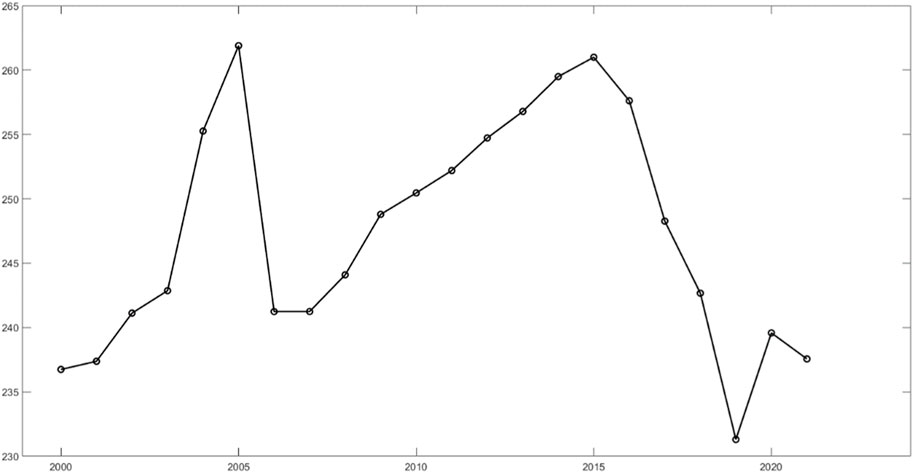
FIGURE 1. Time series changes in agricultural carbon emissions in China.
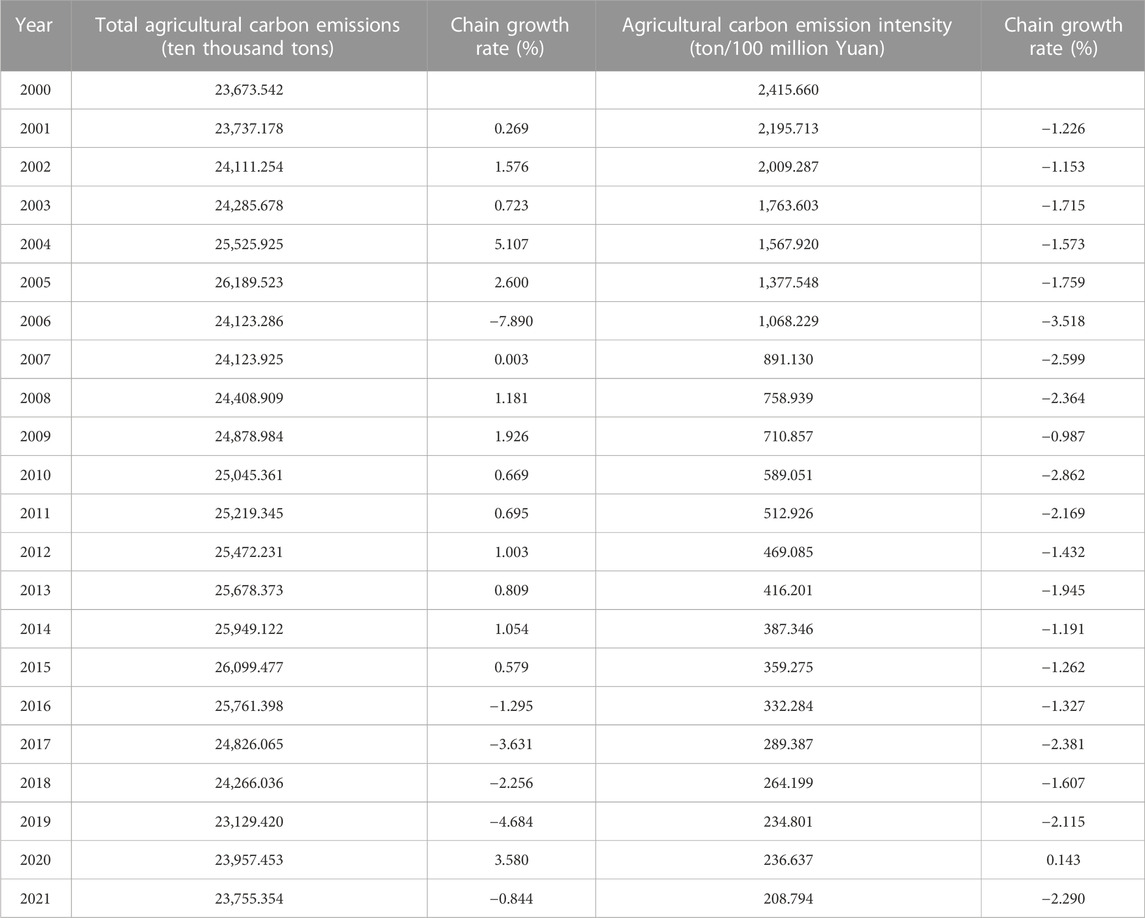
TABLE 6. Changes in the total agricultural carbon emissions and intensity in China from 2000 to 2021.
It is not difficult to see from Figure 1 that the total agricultural carbon emission in China in 2021 was 23,755.354 ten thousand tons, an increase of only 0.35% compared with 2000. During the research period, China’s total agricultural carbon emissions showed a continuous fluctuation trend, and due to external factors, such as natural disasters and policies to support agriculture and benefit farmers, the time series changes in China’s total agricultural carbon emissions can be roughly divided into three stages.
The first stage was from 2000 to 2006, and the total amount of agricultural carbon emissions showed a significant inverted “V”-shaped fluctuation trend. Since 2000, a series of policies to support and benefit agriculture have been introduced, such as the cancellation of agricultural taxes and the establishment of special subsidies for grain cultivation, which have accelerated the process of agricultural marketization and modernization. This has led to a significant increase in agricultural material input, rice planting scale, and livestock breeding quantity, leading to a rapid increase in agricultural carbon emissions and reaching its peak in 2005. However, in 2005, natural disasters occurred frequently, mainly floods and droughts, which severely impacted China’s crop and livestock production, causing a sharp decrease in the total agricultural carbon emissions.
The second stage is from 2007 to 2015, and the total agricultural carbon emissions show a steady upward trend. In 2015, the total agricultural carbon emissions in China increased by 8.19% compared with 2007, with an average annual growth rate close to 1%. At this stage, the central government has continuously increased investment in agriculture, rural areas, and farmers, comprehensively implemented various support policies for grain, oilseeds, pigs, and dairy cows, and established a long-term mechanism of “promoting agriculture through industry and bringing rural areas through cities,” which has become the main reason for the increasing agricultural carbon emissions in China. Tian and Chen (2021) also pointed out that the utilization of agricultural energy, the continuous increase of agricultural material input, and the immature alternative technology of chemical fertilizers are the main reasons for the increase in carbon emissions at this stage.
The third stage is from 2016 to 2021, and the total agricultural carbon emissions show a continuous downward trend with slight fluctuations. In 2016, the State Council issued the National Agricultural Modernization Plan (2016–2020), requiring all agricultural departments to always focus on the goal of “one control, two reductions, and three basics” and fight hard for agricultural non-point source pollution control. At the same time, the former Ministry of Agriculture carried out a series of zero-growth actions on the use of chemical fertilizers and pesticides, gradually strengthened the environmental regulation of agriculture, and improved the pollution prevention and control ability in agricultural production, thus reducing carbon emissions and non-point source pollution. China’s economy has officially entered a “new normal” which focuses on optimizing the economic structure and is driven by factors, investment, and innovation. Therefore, the total agricultural carbon emissions in China reached the lowest value in 2019, which is consistent with the research by Huang and Yang (2022), mainly due to the strong promotion of a national strategy, the continuous improvement in the utilization efficiency of energy and agricultural materials, and the sharp reduction in the number of large livestock. At the same time, the proposal of “deepening the structural reform of agricultural supply side” indicates that the development direction of China’s agriculture is to focus on improving the quality of agricultural supply on the basis of ensuring national food security and promote the transformation of agriculture and rural areas from excessive dependence on resource consumption to pursuing green ecological sustainable development (Ding et al., 2021). In addition, in 2020, in the face of the major impact of the COVID-19 epidemic, China’s strict epidemic prevention and control measures have restricted many agricultural social activities, and agricultural products have become slow-moving in regions and stages, which, in turn, has a short-term inhibitory effect on China’s agricultural carbon emissions.
With the acceleration of urbanization, the carbon emissions between neighboring provinces are spatially dependent. In view of this, referring to the research results of Physical Geography of China and Chen and Jiang (2018), this paper divides the geographical area of China into seven regions, North China, East China, South China, Central China, Southwest China, Northwest China, and Northeast China, calculates the total agricultural carbon emissions in each region (see Figure 2), and analyzes the spatial pattern characteristics of agricultural carbon emissions in China in combination with national development planning and local policies related to agriculture. Figure 3 and Table 7 show the latitude and longitude range of each region and the description of the provinces included.
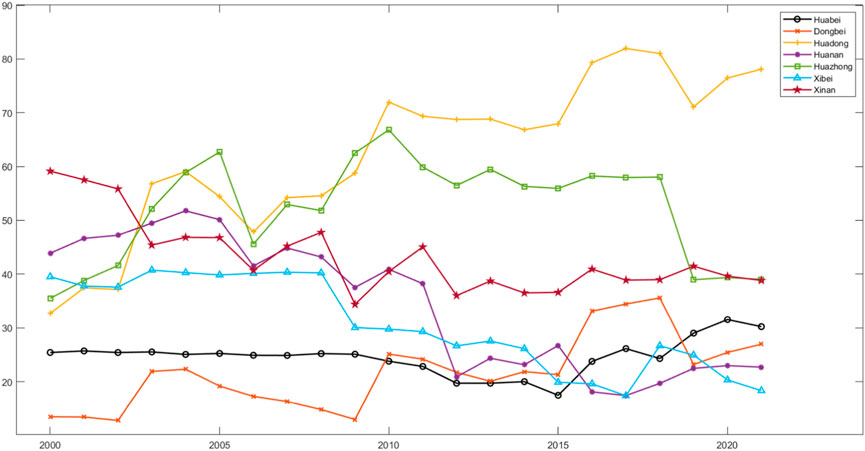
FIGURE 2. Changing trend of agricultural carbon emissions in the seven administrative regions of China.
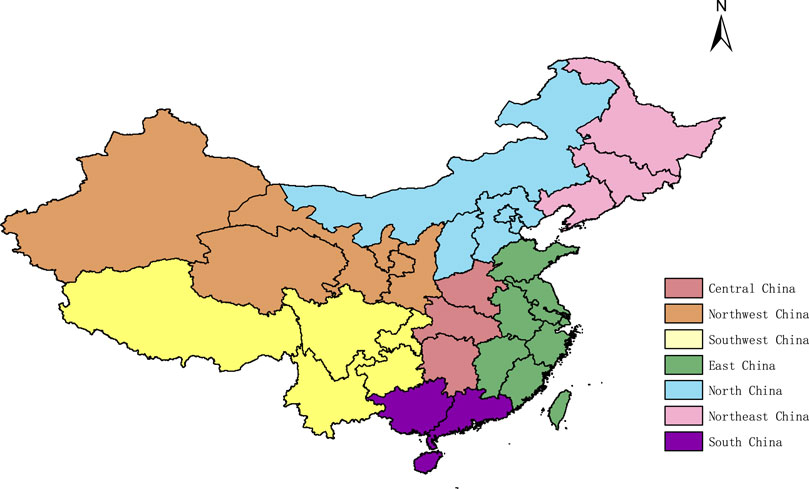
FIGURE 3. Location map of each area.
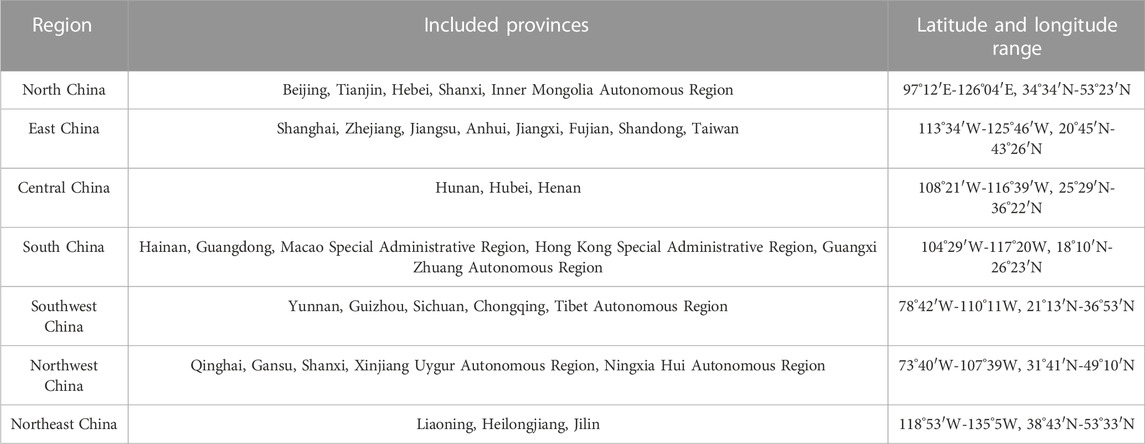
TABLE 7. Regional latitude and longitude range and provinces included in each region.
As shown in Figure 2, in 2021, the total agricultural carbon emissions in East China, Central China, and Southwest China were in the forefront, all higher than the national average agricultural carbon emissions, accounting for 61.35% of the total national carbon emissions. Among them, the total agricultural carbon emissions in East China reached 78.0844 million tons, which was 4.26 times that in Northwest China. The reason is that East China has an important agricultural production base in China, and the cultivated land area accounts for 21.77% of the total cultivated land area in China. With the improvement of agricultural modernization, pollution sources such as solid pollutants, chemical fertilizer pollution, and livestock and poultry are increasing, which causes continuous pollution to soil, air, and agricultural products, resulting in a high level of agricultural carbon emissions in East China. From the time series trend of agricultural carbon emissions in various regions, it can be seen that the total agricultural carbon emissions in Southwest China, South China, and Central China have all decreased to varying degrees, among which South China has the largest decrease, reaching 48.26%. Generally speaking, the total agricultural carbon emissions among the seven administrative regions in China fluctuate continuously, with spatial differences, and the level of agricultural carbon emissions in most regions is related to the scale of agricultural production and operation, the amount of cultivated land, the precise control of fertilizers, water, and drugs, etc., indicating that the agricultural production mode with high consumption and high emissions in China has not changed fundamentally, and solving the problems of small-scale, extensive, and decentralized agricultural production will still be the focus of China’s agricultural “emission reduction and carbon fixation” in the future.
In order to ensure that the predicted agricultural carbon emissions of the seven administrative geographical divisions in China can meet the actual situation of China’s agricultural economic and social development, this paper, based on the historical development law and regional development planning, sets different change rates for four influencing factors, namely, agricultural industrial structure, agricultural carbon emission intensity, per capita agricultural GDP, and rural population, and uses the average annual change rate of agricultural carbon emissions to predict. In addition, referring to the practices of Pan et al. (2021) and Wang et al. (2023a), this paper sets the benchmark scenario and green scenario of agricultural carbon emission prediction, respectively, which are used to compare the development trend of agricultural carbon emission between regions, so as to explore the possible paths and development potential of agricultural low-carbon development in various regions.
The change rate of influencing factors under this scenario is set according to the “14th Five-Year Plan” of China and the agricultural sustainable development plan (2015–2030) so as to ensure that all influencing factors reach the minimum indicators in the policy document.
This scenario emphasizes that the agricultural economic development of all provinces (municipalities and autonomous regions) in China is no longer a “GDP-only” theory but should change the quantitative growth mode that agriculture depends on factor input by introducing modern agricultural machinery and equipment, accelerating agricultural strategic scientific and technological innovation, and strengthening environmental regulation, so as to greatly improve the degree of economic greening and resource utilization efficiency and make resources, production, consumption, and other factors adapt to each other. Therefore, the change rate setting of influencing factors in this scenario will be slightly lower than the benchmark value. The set values of the change rate of influencing factors in different scenarios are shown in Table 8.
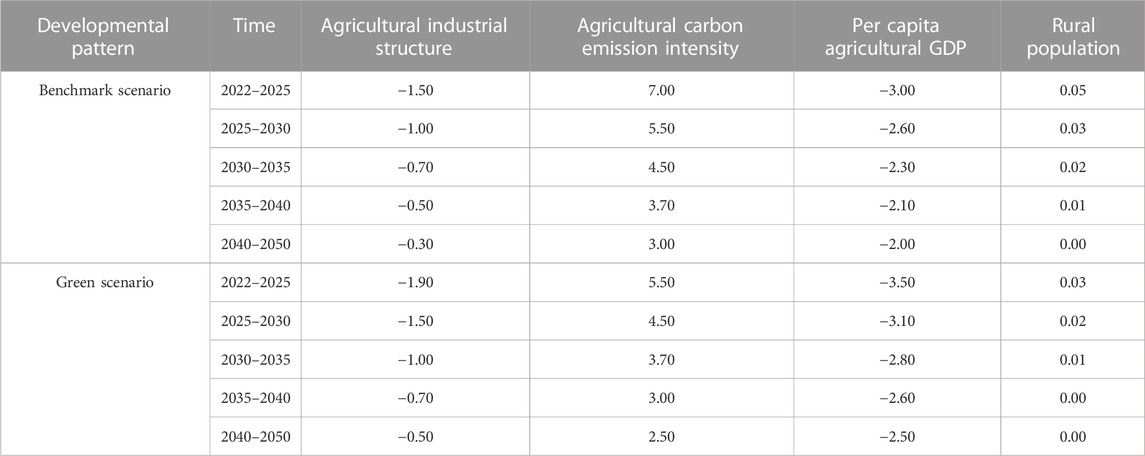
TABLE 8. Setting value of the change rate of influencing factors.
In this paper, through the aforementioned GA-ELM model, the agricultural carbon emission trend of China and the seven administrative geographical regions from 2022 to 2050 is predicted according to the set values of the change rate of carbon emission influencing factors in different scenarios given in the table, as shown in Figure 4.
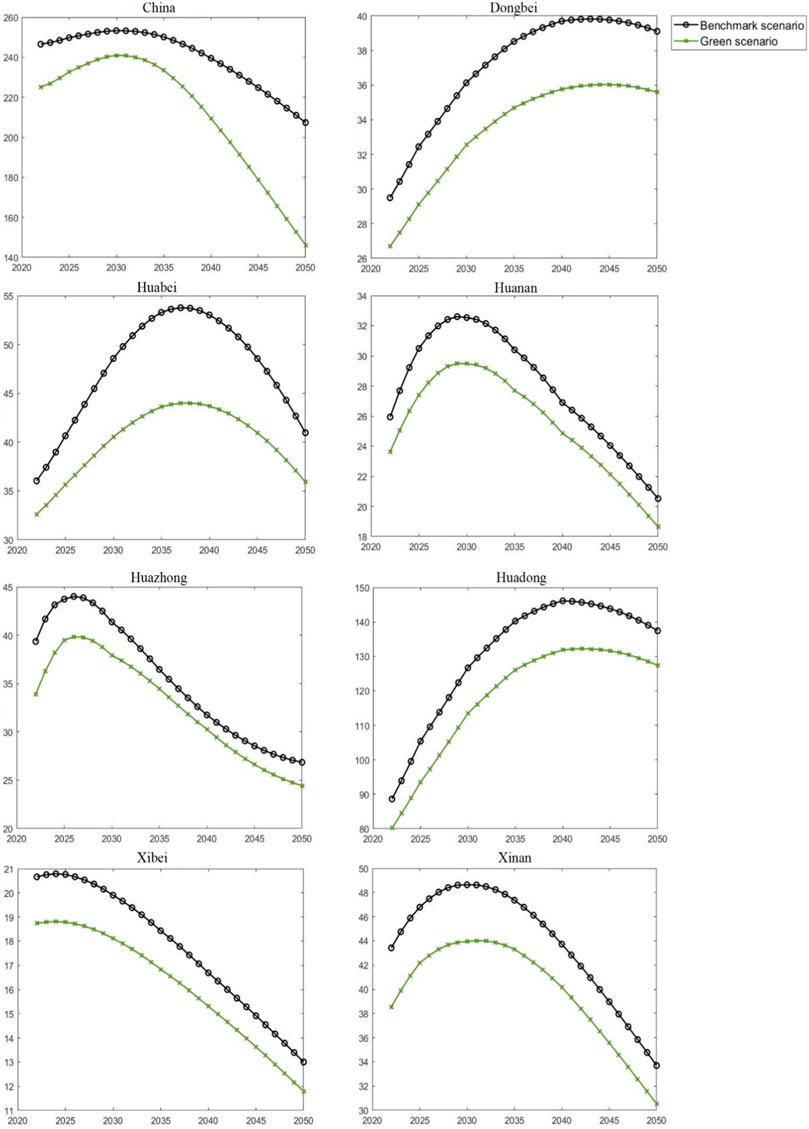
FIGURE 4. Peak trend of agricultural carbon emissions in China and various regions under different scenarios.
According to the comparative analysis between the baseline scenario and the green scenario, it can be seen that China is expected to achieve the goal of “peak carbon dioxide emissions” in 2030, with the only difference being that the total level of agricultural carbon emissions in China is higher than that in the green scenario. It can be seen that establishing a clean, low-carbon, efficient, and safe modern agricultural production and consumption system, accelerating the formation of green production methods and lifestyles, and promoting the beautiful vision of “peak carbon dioxide emissions and carbon neutrality” will become the main tone for the high-quality development of agricultural economy and society in China in the future. From the perspective of sub-regions, the change trend of agricultural carbon emissions in the seven administrative geographical regions is similar to that in China, but the only difference is that the time taken to realize agricultural peak carbon dioxide emissions in different regions is slightly different and the level of peak carbon dioxide emissions is different. For example, the agricultural peak carbon dioxide emission time in South China, Central China, Northwest China, and Southwest China is earlier than 2030, and even Northwest China has the potential to achieve the peak carbon dioxide emission goal in 2024. However, the peak time of agricultural carbon emissions in Northeast China is not optimistic, and the peak target will be achieved in 2045. The possible reason behind this lies in the fact that Northeast China, as an important agricultural base in China, has concentrated its agricultural industry from the outside to the inside. In addition, fertile soil and abundant irrigation water sources contribute to the popularization and promotion of new agricultural machinery equipment and technology, which leads to a high level of agricultural carbon emission and affects the realization of the goal of “peak carbon dioxide emissions, carbon neutrality.” It can be seen that under the condition of considering agricultural economic development and agricultural emission reduction, we should increase the research and development and application of new agricultural production technologies as a breakthrough to curb agricultural carbon emission and cooperate with various agricultural carbon emission reduction policies and measures to achieve sustainable development of agriculture with high quality and low carbon.
By constructing the evaluation index system of the agricultural carbon emission level in provinces, the agricultural carbon emission level of 31 provinces in China from 2000 to 2021 was evaluated by the emission coefficient method, and the peak trend of agricultural carbon emission in seven administrative geographical regions in different development situations in China was predicted and analyzed by using the GA-ELM combined model. This paper obtained several results. First, the change trend of the agricultural carbon emission level in China can be roughly divided into three stages, which experienced the development state of “V" fluctuation → steady rise → continuous decline. At the same time, due to the constraints of obstacles, such as the level of agricultural economic development and the amount of cultivated land, there are spatial differences in agricultural carbon emissions between regions. Second, in the context of green development, the agricultural carbon emissions of seven regions in China all have the potential to achieve the “peak carbon dioxide emissions” goal in 2030, with only a slight difference at the peak. Third, the extreme learning machine model improved by the genetic algorithm can overcome the shortcoming that the ELM model is easy to fall into local optimal solution, thus obtaining higher prediction accuracy. This paper is a useful exploration of carbon sequestration in China’s agriculture in the background of peak carbon dioxide emissions and carbon neutrality. The conclusions are helpful for government departments to formulate flexible, accurate, reasonable, and appropriate agricultural carbon sequestration policies, strengthen exchanges and cooperation in regional agriculture and rural areas, and realize pollution reduction and carbon reduction and greening so as to actively and steadily promote China’s agriculture to achieve the goal of “carbon neutrality in peak carbon dioxide emissions.”
In order to better realize the goal of “double carbon” in agriculture and rural areas and give play to the role of agricultural carbon reduction in promoting carbon neutrality in all areas of China, combined with the conclusion of the article, the following policy suggestions are put forward.
First, the design of special policies for agricultural carbon emission reduction is optimized, the accuracy of environmental governance is improved, and the total amount and growth rate of regional agricultural carbon emissions are effectively slowed down. The government should further promote the transformation of agricultural carbon emission reduction policies from relying on administrative means to comprehensively considering legal, fiscal, taxation, technology, and necessary administrative measures, improve the long-term incentive mechanism for agricultural low-carbon development, and avoid inefficient emission reduction that hinders the normal production and operation activities of enterprises or farmers and inhibits their production enthusiasm on the grounds of strengthening agricultural pollution control. At the same time, we promote the substitution of renewable energy, deduct the carbon emissions from agricultural production and life, such as crop straws, livestock manure, and other substances that can produce renewable energy such as bio-natural gas, bio-liquid fuel, and combustion power generation, deduct the carbon emissions from agricultural materials such as pesticides and fertilizers, and shift the focus of emission reduction from reducing the total amount of agricultural carbon emissions to optimizing functional emission reduction, so as to help China better achieve the goal of “peak carbon dioxide emissions, carbon neutrality.”
Second, exchanges and cooperation in emission reduction and carbon sequestration in agriculture and rural areas in various regions are strengthened, and advanced agricultural technologies and the sharing of experience in green and low-carbon agricultural development are promoted. For areas with less total agricultural carbon emissions and less pressure to reduce emissions, we should fill in the shortcomings of green and low-carbon science and technology in agriculture and rural areas as soon as possible, speed up the transformation and demonstration application of achievements, form a standardized green and low-carbon development model in agriculture and rural areas, and give full play to the technology spillover effect, so as to drive the surrounding areas with heavy agricultural carbon emission reduction tasks to achieve agricultural technological progress and industrial structure transformation and upgrading, promote the consensus of green development in planting, animal husbandry, aquatic products, agricultural machinery, and other fields, and form a joint force to achieve agricultural high-yield and low-carbon synergy.
Third, agriculture should be guided to participate in carbon sink trading, and the transformation of “agricultural carbon ticket” into “farmers’ money” is realized. Taking the “carbon label of agricultural products” as an example, its labeling form enables greenhouse gases emitted by agricultural products in the whole life cycle of production, transportation, and disposal to be displayed in data, which directly reflects the carbon emission per unit of agricultural products, which can not only force the research and development and utilization of energy-saving and emission reduction technologies and deepen the development of intensive and efficient green agricultural products but also realize the simultaneous reduction of pollution and carbon, the transformation of traditional old kinetic energy, and the cultivation of green and low-carbon new kinetic energy.
Although this paper provides some enlightenment for the government’s decision making and research in the field of carbon emission reduction and green economic growth, it still has some limitations. First, due to the availability of data, this paper uses provincial data to explore the fluctuation trend of the agricultural carbon emission level in China from 2000 to 2021. Future research can explore the spatial spillover effect and decoupling effect of agricultural carbon emissions in China by adjusting research methods and perspectives. Second, from the research area, as an important grain production base in China, the major grain producing areas played an important role in ensuring national food security. Therefore, the main grain-producing areas can be included in the research framework in the future so as to draw extensive and profound conclusions.
The raw data supporting the conclusion of this article will be made available by the authors, without undue reservation.
Conceptualization: XZ; methodology: XG, YS, and JY; software: XG, YS, and JY; formal analysis: XG, YS, and JY; investigation: XZ and JY; resources: XG and YS; writing—original draft: XG; writing—review and editing: XG; supervision: XG; and project administration: XZ. All authors contributed to the article and approved the submitted version.
This work was financially supported by the Natural Science Foundation of Fujian Province (Grant Number 2022J01320) and the Fundamental Research Funds for the Central Universities in Huaqiao University.
The authors declare that the research was conducted in the absence of any commercial or financial relationships that could be construed as a potential conflict of interest.
All claims expressed in this article are solely those of the authors and do not necessarily represent those of their affiliated organizations, or those of the publisher, the editors, and the reviewers. Any product that may be evaluated in this article, or claim that may be made by its manufacturer, is not guaranteed or endorsed by the publisher.
Akamati, K., Laliotis, G. P., and Bizelis, I. (2023). Greenhouse gas emissions of the poultry sector in Greece and mitigation potential strategies. Gases 3, 47–56. doi:10.3390/gases3010003
Bokde, N. D., Tranberg, B., and Andresen, G. B. (2021). Short-term CO2 emissions forecasting based on decomposition approaches and its impact on electricity market scheduling. Appl. Energy 281, 116061. doi:10.1016/j.apenergy.2020.116061
Cardoza Cedillo, L., Montoya, M., Jaldón, M., and Paredes, M. G. (2023). GHG emission accounting and reduction strategies in the academic sector: a case study in Mexico. Sustainability 15, 9745. doi:10.3390/su15129745
Chen, C. C., Liu, C. L., Wang, H., Guan, J., Chen, L., Wang, H. H., et al. (2014). Analysis on influencing factors of carbon footprint of energy consumption in Beijing —— based on STIRPAT model and least squares model. Journals China Environ. Sci. 34 (06), 1622–1632.
Chen, M., Zhang, C., Chen, C., Li, J., and Cui, W. (2023). Main pathways of carbon reduction in cities under the target of carbon peaking: a case study of nanjing, China. Sustainability 15, 8917. doi:10.3390/su15118917
Chen, R., Jiang, Z. D., Tomassetti, S., Popplewell, L. L., Alluin, J., Chomchan, P., et al. (2018). Multi-center phase II trial of bortezomib and rituximab maintenance combination therapy in patients with mantle cell lymphoma after consolidative autologous stem cell transplantation. J. China Popul. Resour. Environ. 28 (4), 87–97. doi:10.1186/s13045-018-0631-3
Chen, Y., Li, M., Su, K., and Li, X. (2019). Spatial-temporal characteristics of the driving factors of agricultural carbon emissions: empirical evidence from fujian, China. Energies 12, 3102. doi:10.3390/en12163102
Ding, X., Cai, Z., and Fu, Z. (2021). Does the new-type urbanization construction improve the efficiency of agricultural green water utilization in the Yangtze River Economic Belt? Environ. Sci. Pollut. Res. Int. 28 (45), 64103–64112. doi:10.1007/s11356-021-14280-z
Du, Q., Chen, Q., and Lu, N. (2012). Prediction of future carbon emissions in China based on improved IPAT model. J. Environ. Sci. 32 (09), 2294–2302. doi:10.13671/j.hjkxxb.2012.09.020
Ehrlich, P. R., and Holdren, J. P. (1971). Impact of population growth. Science 171 (3977), 1212–1217. doi:10.1126/science.171.3977.1212
Fang, K., Tang, Y. Q., Zhang, Q. F., Song, J. N., Wen, Q., Sun, H. P., et al. (2019). Will China peak its energy? Related carbon emissions by 2030? Lessons from 30 Chinese province. Appl. Energy 255, 113852. doi:10.1016/j.apenergy.2019.113852
Federici, S. N., Tubiello, F., Salvatore, M., Jacobs, H., and Schmidhuber, J. (2015). New estimates of CO2 forest emissions and removals: 1990–2015. For. Ecol. Manag. 352, 89–98. doi:10.1016/j.foreco.2015.04.022
Gangopadhyay, S., Banerjee, R., Batabyal, S., Das, N., Mondal, A., Pal, S. C., et al. (2022). Carbon sequestration and greenhouse gas emissions for different rice cultivation practices. Sustain. Prod. Consum. 34, 90–104. doi:10.1016/j.spc.2022.09.001
Gangopadhyay, S., Chowdhuri, I., Das, N., Pal, S. C., and Mandal, S. (2023). The effects of no-tillage and conventional tillage on greenhouse gas emissions from paddy fields with various rice varieties. Soil Tillage Res. 232, 105772. doi:10.1016/j.still.2023.105772
Gao, C. X., Lu, Q. P., Ou, N. Q., Hu, Q. P., Lin, X., and Bao, L. X. (2022). Study on influencing factors and prediction of agricultural carbon emissions in henan province under the target of "double carbon. J. China Ecol. Agric. Chin. Engl. 30 (11), 1842–1851.
Gao, P., Zhu, C., Zhang, Y., and Chen, B. (2023). An approach for analyzing urban carbon emissions using machine learning models. Indoor Built Environ. 32, 1657–1667. doi:10.1177/1420326X231162253
Ghosh, S. (2018). Carbon dioxide emissions, energy consumption in agriculture: a causality analysis for India. J. Econ. Theory Pract. 17 (2), 183–207. doi:10.1177/0976747918792640
Guang, Y., Zhang, J. J., and Zhang, J. Z. (2023). Can central and local forces promote green innovation of heavily polluting enterprises? evidence from China. Front. Energy Res. 11, 1194543. doi:10.3389/fenrg.2023.1194543
Guo, F., Zhang, L., Wang, Z., and Ji, S. (2022b). Research on determining the critical influencing factors of carbon emission integrating GRA with an improved STIRPAT model: taking the yangtze river delta as an example. Int. J. Environ. Res. Public Health. 19, 8791. doi:10.3390/ijerph19148791
Guo, X., Shi, R., and Ren, D. (2022a). Reduce carbon emissions efficiently: the influencing factors and decoupling relationships of carbon emission from high-energy consumption and high-emission industries in China. Energy Environ., 0958305X2211405. doi:10.1177/0958305X221140567
Hadi, A., Inubushi, K., and Yagi, K. (2010). Effect of water management on greenhouse gas emissions and microbial properties of paddy soils in Japan and Indonesia. Paddy Water Environ. 8 (4), 319–324. doi:10.1007/s10333-010-0210-x
Han, H. B., Long, J. S., Li, S. D., and Qian, G. R. (2010). Comparison of green-house gas emission reductions and landfill gas utilization between a landfill system and an incineration system. Waste Manag. Res. 28 (4), 315–321. doi:10.1177/0734242X09349761
Han, H., Zhong, Z., Guo, Y., Xi, F., and Liu, S. (2018). Coupling and decoupling effects of agricultural carbon emissions in China and their driving factors. Environ. Sci. Pollut. Res. Int. 25 (25), 25280–25293. doi:10.1007/s11356-018-2589-7
Hou, J., Bai, W., and Sha, D. (2023). Does the digital economy successfully facilitate carbon emission reduction in China? Green technology innovation perspective. Sci. Technol. Soc., 097172182311612. doi:10.1177/09717218231161235
Hu, Y., Zhang, K., Hu, Y., Wu, L., Cong, M. X., Chen, X. Y., et al. (2023). Nanoscale treatment of intervertebral disc degeneration: mesenchymal stem cell exosome transplantation. Chin. J. Eco-Agriculture 31 (2), 163–173. doi:10.2174/1574888X17666220422093103
Huang, G. B., Zhu, Q. Y., and Siew, C. K. (2006). Extreme learning machine: theory and applications. Neurocomputing 70, 489–501. doi:10.1016/j.neucom.2005.12.126
Huang, X. H., and Yang, F. (2022). Calculation and temporal-spatial dynamic evolution of agricultural carbon emissions in China under the background of peak carbon dioxide emissions. J. Jiangsu Agric. Sci. 50 (14), 232–239. doi:10.15889/j.issn.1002-1302.2022.14.033
Huang, G. B., Zhou, H. M, Ding, X. J., and Zhang, R. (2012). Extreme learning machine for regression and multiclass classification. IEEE Transactions on Systems, Man, and Cybernetics, Part B (Cybernetics) 42 (2), 513–529. doi:10.1109/TSMCB.2011.2168604
Jia, M., and Chen, Y. W. (2023). Study on calculation and prediction of agricultural carbon emissions in Hebei province based on new support vector regression model. J. Agric. Technol. 43 (01), 141–146. doi:10.19754/j.nyyjs.20230115033
Kong, F., Song, J., and Yang, Z. (2022). A daily carbon emission prediction model combining two-stage feature selection and optimized extreme learning machine. Environ. Sci. Pollut. Res. 29, 87983–87997. doi:10.1007/s11356-022-21277-9
Li, L., Han, J., and Zhu, Y. (2023). Does environmental regulation in the form of resource agglomeration decrease agricultural carbon emissions? Quasi-natural experimental on high-standard farmland construction policy. Journal of Cleaner Production 420, 138342. doi:10.1016/j.jclepro.2023.138342
Li, J., Li, S. W., Liu, Q., and Ding, J. (2022). Agricultural carbon emission efficiency evaluation and influencing factors in Zhejiang province, China. Front. Environ. Sci. 10. doi:10.3389/fenvs.2022.1005251
Liao, W. D., and Liu, M. (2020). Temporal and spatial evolution of agricultural carbon emissions in western China and test of EKC hypothesis —— empirical analysis based on dynamic panel data model of 12 provinces in western development. World Agric. 41 (06), 62–70. doi:10.13856/j.cn11-1097/s.2020.06.008
Liu, H. J., Bao, Z., and Yang, Q. (2013). Regional gap and dynamic evolution of agricultural carbon emissions in China: An empirical study based on Dagum Gini coefficient decomposition and nonparametric estimation method. Journal of agrotechnical (03), 72–81. doi:10.13246/j.cnki.jae.2013.03.002
Liu, X., Wang, X., and Meng, X. (2023). Carbon emission scenario prediction and peak path selection in China. Energies 16, 2276. doi:10.3390/en16052276
Mao, G. H., Ma, W. L., and Kang, J. W. (2018). Estimation of N2O emission from agricultural land in Beijing —— based on IAP-N model of regional nitrogen cycle. J. Jiangsu Agric. Sci. 46 (05), 280–284. doi:10.15889/j.issn.1002-1302.2018.05.073
Mirzaei, M., Gorji Anari, M., Taghizadeh-Toosi, A., Zaman, M., Saronjic, N., Mohammed, S., et al. (2022). Soil nitrous oxide emissions following crop residues management in corn-wheat rotation under conventional and No-tillage systems. Air, Soil Water Res. 15, 117862212211287. doi:10.1177/11786221221128789
Nunes, L. J. R. (2023). The rising threat of atmospheric CO2: a review on the causes, impacts, and mitigation strategies. Environments 10, 66. doi:10.3390/environments10040066
Ojaghlou, M., Ugurlu, E., Kadłubek, M., and Thalassinos, E. (2023). Economic Activities and Management Issues for the Environment: an environmental kuznets curve (ekc) and STIRPAT analysis in Turkey. Resources 12, 57. doi:10.3390/resources12050057
Pan, D., Li, N., Li, F., Feng, K. S., Peng, L. L., and Wang, Z. (2021). Development of peak strategy in eastern China based on energy carbon emission prediction. J. Environ. Sci. 41 (03), 1142–1152. doi:10.13671/j.hjkxxb.2020.0325
Pandey, S., and Mishra, M. (2021). Investigating environmental kuznets curve: a panel data analysis for India. Rev. Dev. Change 26 (2), 137–152. doi:10.1177/09722661211043595
Peng, J., Fu, S., Gao, D., and Tian, J. (2023). Greening China’s Growth: assessing the synergistic impact of financial development and technological innovation on environmental pollution reduction—a spatial STIRPAT analysis. Int. J. Environ. Res. Public Health. 20, 5120. doi:10.3390/ijerph20065120
Saxena, A., Zeineldin, R. A., and Mohamed, A. W. (2023). Development of grey machine learning models for forecasting of energy consumption, carbon emission and energy generation for the sustainable development of society. Mathematics 11, 1505. doi:10.3390/math11061505
Shan, T., Xia, Y., Hu, C., Zhang, S., Zhang, J., Xiao, Y., et al. (2022). Analysis of regional agricultural carbon emission efficiency and influencing factors: case study of hubei province in China. PLoS ONE 17 (4), e0266172. doi:10.1371/journal.pone.0266172
Shen, Y., Guo, X. Y., and Zhang, X. W. (2023). Digital financial inclusion, land transfer, and agricultural green total factor productivity. Sustainability 15, 6436. doi:10.3390/su15086436
Shi, L., Shi, X., Yang, F., and Zhang, L. (2023). Spatio-temporal difference in agricultural eco-efficiency and its influencing factors based on the SBM-tobit models in the yangtze river delta, China. Int. J. Environ. Res. Public Health 20, 4786. doi:10.3390/ijerph20064786
Song, Y., Zhang, B., Wang, J., and Kwek, K. (2022). The impact of climate change on China’s agricultural green total factor productivity. Technological Forecasting and Social Change 185, 122054. doi:10.1016/j.techfore.2022.122054
Su, L., Wang, Y., and Yu, F. (2023). Analysis of regional differences and spatial spillover effects of agricultural carbon emissions in China. Heliyon 9 (6), e16752. doi:10.1016/j.heliyon.2023.e16752
Sun, B., Sun, R., Gao, K., Zhang, Y., Wang, S., and Bai, P. (2022a). Analyzing the mechanism among rural financing constraint mitigation, agricultural development, and carbon emissions in China: a sustainable development paradigm. Energy Environ. 0 (0), 0958305X2211434. doi:10.1177/0958305X221143413
Sun, W. J., Zhao, Y., Zeng, L., Yin, Y. T., and Cao, C. L. (2022b). Carbon emission peak paths under different scenarios based on the LEAP model—a case study of suzhou, China. Front. Environ. Sci. 10, 905471. doi:10.3389/fenvs.2022.905471
Sun, X., Yang, X., Hou, J., Wang, B., and Fang, Q. (2023). Modeling the effects of rice-vegetable cropping system conversion and fertilization on GHG emissions using the DNDC model. Agronomy 13, 379. doi:10.3390/agronomy13020379
Tian, C. S., and Chen, Y. (2021). China's provincial agricultural carbon emissions measurement and low carbonization level evaluation: based on the application of derivative indicators and TOPSIS. J. Nat. Resour. 36 (02), 395–410. doi:10.31497/zrzyxb.20210210
Tian, Y., Wang, R., Yin, M., and Zhang, H. (2023). Study on the measurement and influencing factors of rural energy carbon emission efficiency in China: evidence using the provincial panel data. Agriculture 13, 441. doi:10.3390/agriculture13020441
Vermont, B., and Cara, S. D. (2010). How costly is mitigation of non-CO2 greenhouse gas emissions from agriculture: a meta-analysis. Ecol. Econ. 69 (7), 1373–1386. doi:10.1016/j.ecolecon.2010.02.020
Wang, G., Liao, M., and Jiang, J. (2020a). Research on agricultural carbon emissions and regional carbon emissions reduction strategies in China. Sustainability 12, 2627. doi:10.3390/su12072627
Wang, B., Zheng, J., Liu, J. L., and Du, Y. D. (2018). Difference of methane emission from paddy fields in different regions of Guangdong Province and its model estimation. Meteorology Environ. Sci. 41 (03), 39–46. doi:10.16765/j.cnki.1673-7148.2018.03.005
Wang, H., and Zhang, Z. (2022). Forecasting CO2 emissions using A novel grey Bernoulli model: a case of shaanxi province in China. Int. J. Environ. Res. Public Health. 19, 4953. doi:10.3390/ijerph19094953
Wang, J., Liao, Z., and Sun, H. (2023a). Analysis of carbon emission efficiency in the yellow river basin in China: spatiotemporal differences and influencing factors. Sustainability 15, 8042. doi:10.3390/su15108042
Wang, K. K., Niu, D. X., Zhen, H., Sun, L. J., and Xu, X. M. (2020b). Study on carbon emission prediction of China based on WOA-ELM model. J. Ecol. Econ. 36 (08), 20–27.
Wang, X., Qu, L., Wang, Y., and Xie, H. (2023b). Dynamic scenario predictions of peak carbon emissions in China’s construction industry. Sustainability 15, 5922. doi:10.3390/su15075922
Wang, Z. H., Yin, F. C., Zhang, Y. X., and Zhang, X. (2012). An empirical research on the influencing factors of regional CO2 emissions: evidence from beijing city, China. Appl. Energy 100, 277–284. doi:10.1016/j.apenergy.2012.05.038
Wójcik-Gront, E., and Gront, D. (2014). Assessing uncertainty in the polish agricultural greenhouse gas emission inventory using Monte Carlo simulation. Outlook Agric. 43 (1), 61–65. doi:10.5367/oa.2014.0155
Wu, Y., Cheng, S., Li, Y., Lv, R., and Min, F. (2023). STWD-SFNN: Sequential three-way decisions with a single hidden layer feedforward neural network. Information Sciences 632, 299–323. doi:10.1016/j.ins.2023.03.030
Xia, S. Y., Zhao, Y., Xu, X., Wen, Q., Song, Y. Y., and Cui, P. P. (2019). Temporal and spatial dynamics and driving factors of agricultural carbon emission rate in China from 1997 to 2016. J. Ecol. 39 (21), 7854–7865.
Xu, N., Zhang, W., Li, H., and Chen, W. (2023). Fiscal support and carbon productivity of agriculture—empirical evidence from China. Energy Environ. 0 (0), 0958305X2311516. doi:10.1177/0958305X231151683
Xu, Y. X., Guo, L. P., Xie, L. Y., Yun, A. P., Li, Y. C., Zhang, X., et al. (2016). Characteristics of N2O background emission and emission coefficient of main dryland farmland in China. China J. Agric. Sci. 49 (09), 1729–1743.
Yang, S., Zhao, H., Chen, Y., Fu, Z., Sun, C., and Chang, T. (2023). The impact of digital enterprise agglomeration on carbon intensity: a study based on the extended spatial STIRPAT model. Sustainability 15, 9308. doi:10.3390/su15129308
Ye, F., Yang, Z., Yu, M., Watson, S., and Lovell, A. (2023). Can market-oriented reform of agricultural subsidies promote the growth of agricultural green total factor productivity? Empirical evidence from maize in China. Agriculture 13, 251. doi:10.3390/agriculture13020251
Zhang, X., Guo, X., and Zhang, X. (2022). Assessing and prospecting decoupling effect of carbon emissions from economic growth: empirical studies from Chinese provinces. Energy Environ. 34, 2044–2071. doi:10.1177/0958305X221100534
Zhang, X., Zhang, J., and Yang, C. (2023b). Spatio-temporal evolution of agricultural carbon emissions in China, 2000–2020. Sustainability 15, 3347. doi:10.3390/su15043347
Zhang, X., Wang, C., Liu, X., and Wu, J. (2022). Tax pressure, farmland management, and agricultural carbon abatement: Empirical evidence from tax-and-fees reform in rural China. Frontiers in Environmental Science 10, 1037248. doi:10.3389/fenvs.2022.1037248
Zhang, Y., Wang, R., Yang, X., and Zhang, H. (2023a). Can China achieve its carbon emission peak target? Empirical evidence from city-scale driving factors and emission reduction strategies. Land 12, 1129. doi:10.3390/land12061129
Zhao, M. M., Shao, R., Yang, J. L., Zhao, F., and Xu, M. (2019). Simulation of greenhouse gas emission flux in paddy field based on DNDC model. J. Ecol. 38 (40), 1057–1066. doi:10.13292/j.1000-4890.201904.030
Zhao, L., Rao, X., and Lin, Q. (2023). Study of the impact of digitization on the carbon emission intensity of agricultural production in China. Science of The Total Environment 903, 166544. doi:10.1016/j.scitotenv.2023.166544
Zhao, Y. C., Xu, S. X., Wang, M. Y., and Shi, X. Z. (2018). Potential and rate of farmland soil carbon sequestration in China: knowledge, challenges and research suggestions. J. China Acad. Sci. 33 (02), 191–197. doi:10.16418/j.issn.1000-3045.2018.02.009
Zhao, Y., Liu, R., Liu, Z., Liu, L., Wang, J., and Liu, W. (2023). A review of macroscopic carbon emission prediction model based on machine learning. Sustainability 15, 6876. doi:10.3390/su15086876
Zhou, Q., Liu, G., Hu, Z., Zheng, Y., Lin, Z., and Li, P. (2023). Impact of different structures of biochar on decreasing methane emissions from sewage sludge composting. Waste Manag. Res. 41 (3), 723–732. doi:10.1177/0734242X221122586
Keywords: peak carbon dioxide emissions, agricultural carbon emissions, STIRPAT model, genetic algorithm, extreme learning machine, scenario prediction
Citation: Guo X, Yang J, Shen Y and Zhang X (2023) Prediction of agricultural carbon emissions in China based on a GA-ELM model. Front. Energy Res. 11:1245820. doi: 10.3389/fenrg.2023.1245820
Received: 23 June 2023; Accepted: 28 September 2023;
Published: 13 October 2023.
Edited by:
Salvador García-Ayllón Veintimilla, Polytechnic University of Cartagena, SpainCopyright © 2023 Guo, Yang, Shen and Zhang. This is an open-access article distributed under the terms of the Creative Commons Attribution License (CC BY). The use, distribution or reproduction in other forums is permitted, provided the original author(s) and the copyright owner(s) are credited and that the original publication in this journal is cited, in accordance with accepted academic practice. No use, distribution or reproduction is permitted which does not comply with these terms.
*Correspondence: Jingyi Yang, MjIwMTMwMjEwMTRAc3R1LmhxdS5lZHUuY24=; Xiuwu Zhang, enh3eHo3MTdAaHF1LmVkdS5jbg==
Disclaimer: All claims expressed in this article are solely those of the authors and do not necessarily represent those of their affiliated organizations, or those of the publisher, the editors and the reviewers. Any product that may be evaluated in this article or claim that may be made by its manufacturer is not guaranteed or endorsed by the publisher.
Research integrity at Frontiers
Learn more about the work of our research integrity team to safeguard the quality of each article we publish.