 Jiangnan Li
 Tao Wang2
95% of researchers rate our articles as excellent or good
Learn more about the work of our research integrity team to safeguard the quality of each article we publish.
Find out more
BRIEF RESEARCH REPORT article
Front. Energy Res. , 31 July 2023
Sec. Sustainable Energy Systems
Volume 11 - 2023 | https://doi.org/10.3389/fenrg.2023.1244394
This article is part of the Research Topic Smart Energy System for Carbon Reduction and Energy Saving: Planning, Operation and Equipments View all 42 articles
When planning the distribution network, the income of each market entity is calculated by a fixed price. How to take the price of power into account while developing the planning strategy for each organization in the actual power market is an urgent issue that needs to be addressed imminently. To address this problem, considering the continuous change in the market price due to the change in the supply–demand relationship in the actual power market, this article proposes a distribution network planning method which considers the distribution system operator (DSO) and multi-agent game. First, the planning decision model of distribution network companies and power users with different interest subjects is constructed with grid planning and DG operation as decision variables. Second, DSO is introduced to the game framework. Based on the distribution locational marginal pricing (DLMP), a price accounting model is being developed. Then, the transfer relationships and game behavior among the distribution company, power users, and DSO are analyzed. Finally, an iterative search algorithm is used to solve a multi-agent game planning model of a distribution network that takes into account price signals in the power market. Examples based on IEEE 33-bus systems validate the suggested method’s validity and efficacy.
As China’s energy market reform continues to advance, the distribution side market has gradually been opened to social capital (Liu et al., 2018; Yang et al., 2022a; Wang et al., 2023). The highly open electricity market environment makes the types and quantity of investment and operation subjects in the supply and demand side increase continuously (Chen et al., 2019a; Yang et al., 2021). With the intention of maximizing their own interests, they independently take part in the planning and management of the distribution network. As a result, the traditional planning method based on holistic rationality is difficult to apply to distribution network planning in the current electricity market environment because it cannot accurately describe the ubiquitous competitive relationship in the electricity market. In this regard, based on individual rationality, the development of distribution network planning methods that fully consider market competition and game mechanisms has important theoretical and practical significance (Lu et al., 2014; Yu et al., 2022).
At present, many literature reports have proposed distribution network planning methods, considering the market-oriented game (Li et al., 2013; Liao et al., 2013; Zeng et al., 2017; Yang et al., 2019). In Li et al. (2013), for the first time in distribution network planning, the game between investment cost, line loss, and voltage quality is examined to determine the ideal location and size of distributed generations. Zeng et al. (2017) analyzed the interaction between the distribution company and the DG investor, and proposed a two-level Stackelberg game model, in which the distribution company acts as the game leader to expand the network and the DG investor acts as the game follower to locate and size the DG. Liao et al. (2013) studied the game relationship between the substation investor and the distribution network company so that the substation investor can select the appropriate standby feeder according to the network structure planned by the distribution network company, thereby improving the reliability of the distribution network. By introducing virtual players, for the purpose of the collaborative design of a distribution network under uncertainty and a multi-agent game, Yang et al. (2019) integrated robust optimization with game theory. However, all of the aforementioned references apply fixed prices to determine the income in order to carry out the distribution network design. The real power grid’s power pricing will fluctuate when the relationship between power supply and demand changes, which directly affects the power load of users and the planning and decision-making of the distribution network. It is clear that the standard distribution network planning technique, which takes market-oriented games into account, overlooks the influence of time-of-use/tiered energy prices on planning decision-making. As a result, it is challenging to create an accurate and appropriate planning scheme.
Currently, there are some research studies that apply locational marginal pricing (LMP) to distribution network planning. Chen et al. (2019b) introduced the carbon trading mechanism, analyzed the bilateral bidding relationship between power generation companies and power users, and constructed a market clearing model based on LMP. Taking into account the market trading system and relevant incentive policies for the development of wind power generation, Lou et al. (2019) described the construction of a bi-level model for the expansion planning of power generating investment in oligopolistic electricity markets that includes wind power generation, with power generation companies and power trading centers as the decision-making bodies. Taking into account DG’s contribution to the distribution system’s efforts to save energy and reduce emissions, Wang et al. (2018) proposed a nodal pricing method of the distribution network, taking into account the task allocation of gas emission reduction of the distribution network and the game behavior of the main market by using the concept of the cooperative game. Hu et al. (2019) constructed a distribution network day ahead the optimal dispatching model based on distribution locational marginal pricing (DLMP), in which a distributed iterative solution is achieved by the interaction of “price–power” information between the distribution system operator (DSO) and load aggregator (LA) (Li et al., 2018). The planning methods involved in the aforementioned literature are all based on LMP analysis of game relationships between different players and construct the corresponding model, but the following problems are observed.
The previous references either do not consider the game relationship between DSO and other market players, or only considers the interaction and information exchanges with a part of the market participants and DSO, while the information on other market participants remains unchanged. In the actual electricity market planning, various game relationships will have an impact on the electricity price and then affect the planning decision. For example, with the integration of DG into the distribution network (Liao et al., 2018), the selection of its access location and line transmission capacity may also affect the decision-making of other market players and DSO (Li et al., 2023), and then affect the nodal marginal price of the distribution network (Gao et al., 2020). If we cannot fully consider the game relationship between DSO and other subjects in the market, it will be difficult to obtain an accurate planning scheme (Chen et al., 2021).
In view of this, a distribution network planning method considering distribution system operators and the multi-agent game is proposed in this paper. First, the planning decision model of distribution network companies and power users with different interest subjects is constructed with grid planning and DG operation as decision variables. Second, DSO is introduced as a special market entity, and the electricity price accounting model is established based on DLMP theory. Then, based on the planning and operation mechanism of the distribution market, the transitive relationship and game behavior among distribution network companies, power users, and distribution system operators are analyzed, and a multi-agent game planning model considering the market price is established, which is finally solved using an iterative search algorithm. Compared with the traditional distribution network planning method that considers the market game, the method not only considers the position and the capacity of the DG but also considers the influence of the capacity expansion of a newly built line on the node marginal price so that the calculation accuracy of the node marginal price of the distribution network is high. On this basis, by examining the transmission relationship and game behavior among distribution network companies, power customers, and distribution system operators, the planning scheme’s accuracy is increased. The accuracy and efficiency of the suggested solution are confirmed by an example based on the IEEE 33-bus distribution system.
In the market environment considered in this paper, the main bodies of investment planning are distribution network companies, power users, and distribution system operators. This particular topic of DSO is principally in charge of maintaining the distribution network’s safety and accounting for energy pricing. Direct participants in distribution planning include electricity users and distribution network businesses. For distribution network companies, they reduce electricity prices through grid construction, thereby increasing electricity sales and revenue so as to maximize their own interests (Xu B. et al., 2023). For power users, it is hoped that the new distributed generation will be built to reduce the comprehensive expenditure on power consumption through the way of “self-generation and self-use, surplus access to the grid” (Nan et al., 2018). Different market entities belong to different interest groups (Nan et al., 2023), have various goals while engaging in planning, and come to conclusion on their own. Therefore, it is important to build the relevant planned income models for the three market themes mentioned previously.
Power users take part in the design and development of the distribution network by building new DG and consume electrical energy in the mode of “self-generation and self-use, surplus access to the grid” (Li, 2017; Liu et al., 2020; Zhou et al., 2022). When the generated energy of the constructed DG is less than the load of the user node, the electric energy consumed by the user is transmitted by the main network through the distribution network, wherein the grid firm receives the grid crossing charge, and the node marginal price of the distribution network node serves as the means for settling electrical energy (Shen and Raksincharoensak, 2021). When the power generation of the constructed DG is more than the load of the user node, in addition to supplying its own load, the distribution network company will buy the extra power (Veeramsetty, 2021).
The planning objective of power consumers is to lower the cost of their own electricity use (Zhang et al., 2023), and the distributed generation construction plan is the decision variable. The primary components of the goal function are DG power purchase costs, DG investment costs, DG maintenance and operation costs, and power sales revenue, and the specific calculation formula is shown in Eq.1.
where
Therefore,
where
The main elements of the power user planning model’s constraints are the restrictions on the number of DG nodes that may be selected and DG penetration constraints (Zhang and Luo, 2018; Li et al., 2021a).
(a) The limit on the number of DG nodes that can be chosen is as follows:
where
(b) The restriction on DG permeability is
In order to optimize one’s own revenue, the distribution network corporation primarily designs its distribution network in the power system planning process (Xu P. et al., 2023). The decision variable is the expansion plan of new lines (Yang et al., 2022b). The goal function accounts for the power sales income, the investment cost of additional extension lines, the price of purchasing electricity from the main network, and the cost of acquiring electricity from DG.
where
Therefore,
where
Constraints on line selection, branch power flow, and security are the essential requirements in the distribution network company planning model.
(a) The line selection constraint is
(b) The branch power flow constraint is
where
(c) Safety constraints are
where
DSO stimulates electricity consumption by altering the distribution network’s nodal marginal prices (Zhu et al., 2023), which alters the demand for purchasing and selling electricity, and manages the distribution network’s operational health. The minimum total cost of purchasing electricity can be taken as the optimization objective of DSO (Dewey and DongLi, 2020), and the following is its objective function:
where
where
The Lagrangian equation is used to calculate the nodal marginal price of the distribution network (Yuan et al., 2016). Combined with the objective function and constraints of the DSO operation model (Ma et al., 2021), the following is how the Lagrangian function model of the distribution network’s nodal marginal price is built:
where
The inequality constraints are transformed into equality constraints as follows:
where
In order to optimize the independent variable within the feasible region, the barrier function is introduced into the original Lagrangian function as follows:
where
The nodal marginal price of the distribution network is as follows:
where
Distribution network planning considering DSO in this paper involves power users, distribution network companies, and special subject DSO, and Figure 1 illustrates the transmission relationship diagram of each subject.
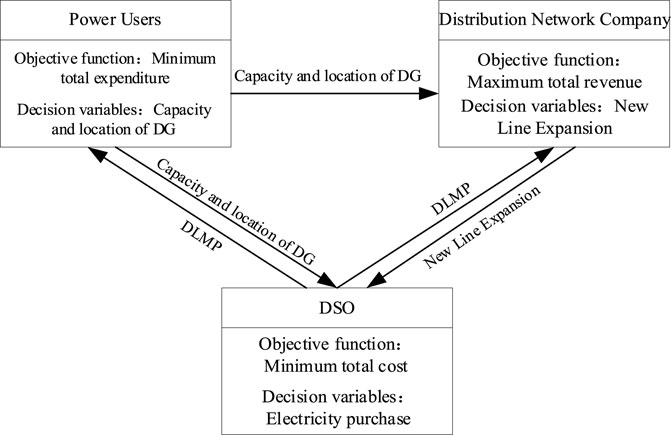
FIGURE 1. Transmission relationship diagram of each subject.
In accordance with the DSO’s computed distribution network node marginal price, a power user chooses the site and establishes the DG’s capacity, determines the amount of electricity purchased from a distribution network company, and transmits the location, capacity, and electricity purchase information on DG to the distribution network company and the DSO. According to the location, capacity, and power purchase information on DG and the node marginal price calculated by DSO, the distribution network company builds and expands the current grid structure and transmits it to DSO. According to the distribution network company’s new line expansion plan, DSO determines the new node marginal price and passes it to the power users; power users decide the new DG location and capacity according to the new price information so as to calculate the total cost expenditure and enter a new round of game.
On the basis of independent decision-making, power consumers and distribution network companies must collaborate to finish the planning and construction of the power system (Fang et al., 2022; Li et al., 2022), and the planning strategies of power users and distribution network businesses must be mastered by the market operation of DSO. The three actions in the game have a sequence, and the dynamic game behavior diagram is shown in Figure 2.
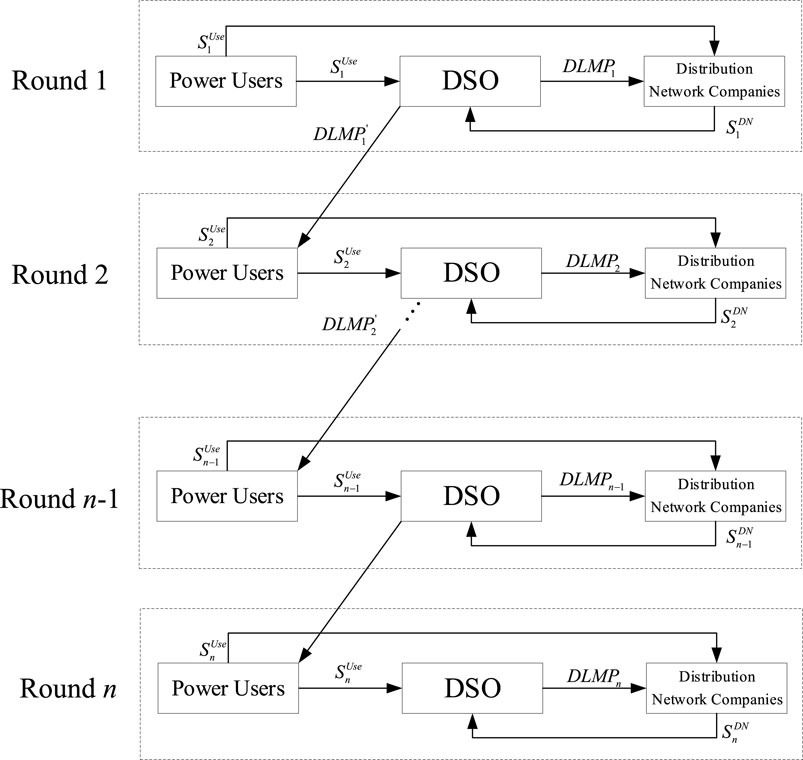
FIGURE 2. Dynamic game behavior diagram.
According to the node marginal price of the distribution network estimated by the previous round of DSO in the game round depicted in Figure 2, by changing the location and capacity scheme and power purchase plan of DG, the power user reduces its own energy costs. The power user then transmits the location and capacity scheme and power purchase plan of DG to the distribution network company and the special subject DSO; DSO calculates the new nodal marginal price of the distribution network according to the DG location and capacity scheme and the power purchase plan of power users, and transmits it to the distribution network company. The distribution network company updates the new line expansion plan before sending it to the special main body DSO in order to maximize the overall advantage of the distribution network, according to the energy pricing information supplied by DSO. DSO estimates the marginal price of the new node and transmits it to the power customers in accordance with the growth plan of the new line of the distribution network company. Power users then adjust the location and capacity scheme, and the power purchase plan of DG once more, and play the next round of the game based on the new electricity price information.
In the game process, when neither the power user nor the distribution network company can obtain more benefits by changing the strategy (Zhang et al., 2022) and when the game reaches equilibrium, it takes the following form:
where
The Nash equilibrium for the proposed model is solved using an iterative search technique (Yang et al., 2011).
The following are the stages to obtain the solution.
Step 1. Enter raw parameters and data. Enter the data required for the game model and the parameters necessary to calculate the payoffs of the players.
Step 2. Generate a set of game player strategies. A self-strategy set
Step 3. Initialize the planning strategy scheme (Fu et al., 2023). Power users and distribution network companies choose a group of planning strategy schemes at random from their respective strategy sets to serve as the initial value of the planning schemes, and DSO determines the first price using the power users’ and distribution network companies’ planning schemes.
Step 4. Set the iteration’s starting value k = 2.
Step 5. Participants perform scenario optimization (Liu et al., 2016). In the k-th iteration process, the distribution network company and DSO were informed of the location and capacity scheme of DG by the power user in accordance with the power user’s minimal power consumption cost; the distribution network company maximizes its own interests to determine the expansion scheme of new lines and transmits it to power users and DSO. DSO calculates the new electricity price information according to the location and capacity scheme of power users and the expansion scheme of new lines of the distribution network company, and transmits it to power users and the distribution network company. The primal-dual interior point technique is used to calculate the pricing information for DSO (Wei et al., 1998).
Step 6. Determine if the equilibrium state has been attained. If two successive game rounds’ planning plans are identical, the game finds equilibrium, and step 7 is carried out; if not, set k = k+1 and return to step 5.
Step 7. Output the equilibrium solution
In this study, the simulation analysis is applied to the IEEE 33-bus distribution network system (Li et al., 2021b), and Figure 3 shows its topology. The dotted line represents the new expansion line to be selected, and the red node represents the node to be chosen for the power user to install DG.
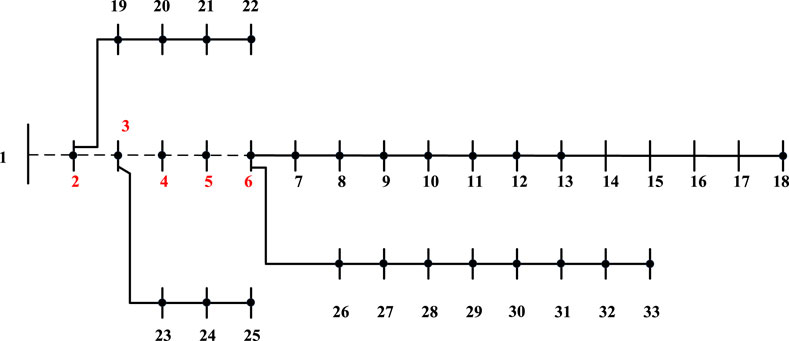
FIGURE 3. IEEE 33-bus system.
Table 1 displays the relevant DG unit specifications. The power consumers can choose from the following DG nodes: {2, 3, 4, 5, and 6}. The DG unit’s output upper and lower limits are set at 0.9 and 0.7 of the rated capacity, respectively.

TABLE 1. Related parameters of the DG unit.
The related parameters of the DG unit are shown in Table 1, and all of the DG nodes to be selected installed by power users are {2, 3, 4, 5, and 6}. The DG unit’s output upper and lower limitations are set at 0.9 and 0.7 of the unit’s rated capacity, respectively.
The new expansion line set of the distribution network company is {1–2, 2–3, 3–4, 4–5, and 5–6}, and Table 2 displays the pertinent DG unit parameters. The distribution network company pays 0.4 ¥/kW•H per unit for the electricity it buys from the superior power grid.

TABLE 2. Related parameters of the DG unit.
Calculating the primary planning schemes in this paper allows for the effectiveness of the suggested strategy to be confirmed, various benefits and total benefits in the following three methods, and contrasting the outcomes of Method 3 with those of Methods 1 and 2.
Method 1: A distribution network planning method that does not consider DSO but considers the game relationship of each agent, that is to say, the cost of electricity is set at 0.75 ¥/kW•H, and power customers purchase it from the distribution network company at a single price.
Method 2: The distribution network planning method considering DSO but not considering the game relationship of each main body, that is, the distribution network planning strategy is based on the organization that operates the distribution network and the power users’ best overall planning decision.
Method 3: A technique for constructing distribution networks that takes each agent’s game relationship and DSO into account. In the method proposed in this research, power users buy energy from the distribution network firm using the nodal marginal price of the distribution network. The nodal marginal price of the distribution network is initially fixed at 0.75 ¥/kW•H throughout the iteration process.
The planning schemes of power users and distribution network companies obtained by using the three methods are shown in Table 3, and the price information on DG nodes to be selected obtained using Methods 2 and 3 is shown in Table 4.
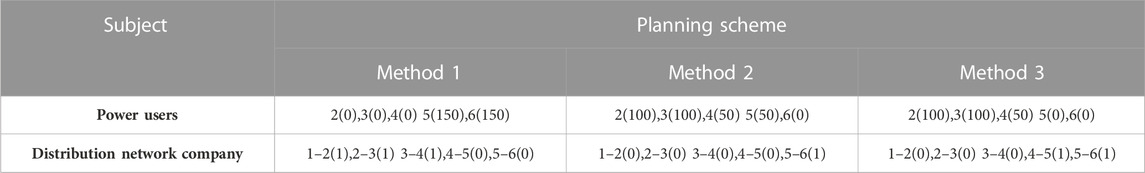
TABLE 3. Planning schemes.
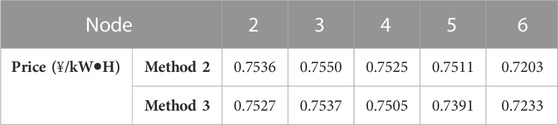
TABLE 4. Price information on the DG node to be selected.
Tables 3, 4 demonstrate the planning results obtained by the three methods are not the same, and the nodal marginal prices of DG nodes to be selected obtained by methods 2 and 3 are also different. The reason is that, despite the fact that Method 1 takes into account each subject’s game relationship while planning in a market setting, its planning scheme is generated through a continuous game under the assumption of fixed pricing and ignores the impact of dynamic changes in the whole market price on the planning scheme. Although Method 2 considers the change in the market price, it is predicated on maximizing the interests of distribution network firms and power consumers as a whole at the expense of certain other subjects’ interests, ignoring the game relationship of planning strategies among the subjects. Method 3 not only considers the market price signal but also considers the game relationship between the subjects so that each market subject can consider the market price to the maximum extent in the process of a continuous game and constantly adjust its own scheme through the guiding role of the market price in order to achieve the best planned decision scheme, given the pricing. Therefore, the planning schemes obtained by the three methods are not the same, and the nodal marginal prices of the nodes to be selected by the DG are also different.
(a) Necessity analysis of considering DSO in the process of distribution network planning
This paper demonstrates the value of taking DSO into account in this method by comparing the planning schemes of game players under methods 1 and 3, as well as the costs and benefits.
The information in Table 5 compares the revenue from sales of electricity, investment costs, operation and maintenance costs, revenue from electricity purchases, and the total cost of goods, and services obtained by power consumers when they use methods 1 and 3 to make planning decisions.
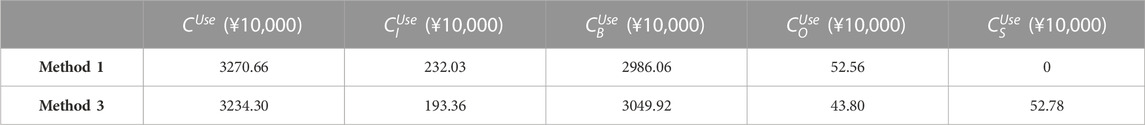
TABLE 5. Comparison of the cost-benefit and total expense of power users under methods 1 and 3.
Table 5 shows that when compared to Method 1, the total cost of power users using Method 3 for decision-making and planning is reduced by ¥363,600. This includes an increase in the income from selling electricity of ¥527,800, an increase in the cost of purchasing electricity of ¥638,600, a decrease in the investment cost of ¥386,700, and a reduction of ¥87,600 in the cost of operation and maintenance. The reason is that the power users choose to build 150 kW DG units at nodes 5 and 6 , and do not build DG units at nodes 2, 3, and 4 when making planning decisions by using Method 1. When power users make planning decisions by using Method 3, they choose to build 100 kW DGs at nodes 2, 3, and 4, while not building new DGs at nodes 5 and 6. Further analysis shows that because Method 3 considers the price accounting mechanism of DSO, that is, considering the impact of the market price on the planning scheme, when power users employ Method 3 to make planning decisions, it results in the electricity prices of nodes 2, 3, and 4 being higher than the fixed price under Method 1, and those of nodes 5 and 6 being lower than the fixed price under Method 1. On one hand, new DG units are constructed at nodes 2, 3, and 4 in order to partially offset the electric energy purchased by power users and lessen their reliance on distribution network companies; on the other hand, at nodes 5 and 6, no more DG units are built, and only power is purchased from the distribution network operator to reduce expenses. The overall amount of DG constructed by Method 3 is smaller than that by Method 1 based on the DG construction of all nodes, resulting in an increase in the amount of power purchased from the distribution network operator. Therefore, the investment cost is lower than that by Method 1, while the cost of purchasing electricity is higher. In addition, since the power generation of the DG units built at nodes 2, 3, and 4 is greater than their node loads in Method 3, they can sell the surplus power generation to the distribution network company to increase its electricity sale revenue, while the power generation of the DG units built at nodes 5 and 6 is less than their node loads in Method 1, so the electricity sale revenue in this method is zero. Considering all the costs and expenditures, the total cost expenditure of power users is relatively small when they make decisions under the price accounting mechanism, considering DSO in Method 3.
The overall amount of DG constructed by Method 3 is smaller than that by Method 1 based on the DG construction of all nodes, resulting in an increase in the amount of power purchased from the distribution network operator. The planning and construction of DG is obtained by calculating the income and expenditure through a fixed electricity price, and the planning scheme is relatively conservative and inaccurate. When using Method 3 to make planning decisions, due to the full consideration of the guiding role of the market price, power users can accurately judge the construction of DG units according to the price of each node so as to select the appropriate power source mode, thereby reducing their own cost expenditure.
The information in Table 6 compares the distribution grid company’s total revenue, investment costs, electricity costs from the main grid, cost of purchasing DG from users, and revenue from electricity sales when using methods 1 and 3 for planning and decision-making.
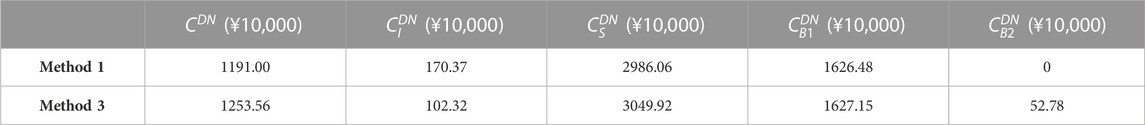
TABLE 6. Comparison of the cost-benefit and total revenue of the distribution network company under methods 1 and 3.
Table 6 demonstrates that in comparison to Method 1, the total income of the distribution network company when using Method 3 to make planning decisions has increased by ¥625,600, of which the investment cost has decreased by ¥680,500, the electricity sales income has increased by ¥638,600, the cost of purchasing electricity for the main network has increased by ¥6,700, while the cost of obtaining DG from power users has decreased by ¥527,800. The explanation is that Method 3 designs the distribution network while considering how prices will fluctuate across the board. The distribution network company does not construct new lines between nodes 1 and 2, nodes 2 and 3, and nodes 3 and 4, as a result, while utilizing Method 3 to make planning decisions. Thus, the energy rates at nodes 2, 3, and 4 are more expensive than the set rate under Method 1. As a result, power users build more DGs for their own use. New lines are built and expanded between nodes 4 and 5 and between nodes 5 and 6 so that the prices of nodes 5 and 6 are reduced, which leads to more power users buying electricity from the distribution network company to increase their electricity sales, thereby increasing their electricity sales revenue. According to the overall line construction situation, the distribution network company builds fewer lines and shorter lines when using Method 3 to make planning decisions, which leads to the reduction of its investment cost. In addition, because the power generation capacity of DG units built by power users at nodes 2, 3, and 4 is greater than their node loads under Method 3, while the power generation capacity of DG units built at nodes 5 and 6 is less than their node loads under Method 1, under Method 3, distribution network businesses pay more for their power purchases, while the power purchase cost under Method 1 is zero. Considering all the costs and expenditures, the total revenue of distribution network companies is increased when they make decisions under the price accounting mechanism, considering DSO in Method 3.
Further analysis shows that when the distribution network company uses Method 3 to make planning decisions, due to the consideration of the guiding role of market prices, on one hand, it enables the distribution network company to make a reasonable response to the market in time, and on this premise, it can choose a more accurate line expansion scheme to reduce its investment cost; on the other hand, distribution network companies can also make accurate judgments on the new DG units of power users according to the price information of each node so as to increase their electricity sales, thereby increasing the revenue of electricity sales.
(b) Necessity analysis of considering the game in the distribution network planning process
By contrasting the planning schemes for each game subject under methods 2 and 3, as well as the costs and benefits, this research demonstrates the importance of taking the game into account.
When power users utilize methods 2 and 3 to make planning choices, the data in Table 7 show the comparison of the cost of acquiring energy, the cost of investment, the cost of operation and maintenance, and the overall cost borne by power users.

TABLE 7. Comparison of the cost-benefit and total revenue of the distribution network company under methods 1 and 3.
Table 7 demonstrates that in comparison to Method 3, the total cost of power users using Method 2 for decision-making and planning has increased by ¥252,900, of which the investment cost has increased by ¥386,700, the electricity sales income has increased by ¥8,000, and the electricity purchase cost has decreased by ¥220,600. The power consumers’ decision to construct 100kW, 100kW, 50kW, and 50 kW DGs at nodes 2, 3, 4, and 5, respectively, while adopting Method 2 for planning and decision-making is the cause, compared with 50 kW DG units at node 5 when using Method 3 for planning and decision-making. Further analysis reveals that in comparison to Method 2, Method 3 considers the game relationship between the main bodies, allowing the distribution network company to add another line. As a result, nodes 2, 3, and 4 have prices that are marginally lower than those of Method 2, while node 5 has a price that is significantly lower than that of Method 2. Therefore, when using Method 3 to make planning decisions, power users do not choose to build a new DG unit at node 5 but choose to buy electricity from the distribution network company, resulting in an increase in the amount of electricity purchased and an increase in the cost of purchasing electricity. However, as far as the DG construction of all nodes is concerned, the planning scheme of power users using Method 3 to make decisions is less than that of Method 2 to build 50 kW DG units, which lowers the cost of maintenance and operation, as well as investment. Therefore, considering all the costs and benefits, the total cost of power users in using Method 3 to make decisions is relatively small.
The data provided in Table 8 show the comparison of the distribution grid company’s total revenue, investment costs, electricity costs from the main grid, cost of purchasing DG from users, and revenue from electricity sales when using methods 2 and 3 for planning and decision-making, respectively.
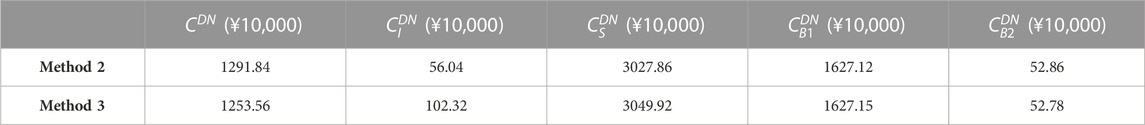
TABLE 8. Comparison of the cost-benefit and total revenue of the distribution network company under methods 2 and 3.
Table 8 demonstrates that in comparison to Method 3, the distribution network company’s overall revenue increased when using Method 2 for planning and decision-making, which has increased by ¥382,800, of which the investment cost has decreased by ¥462,800, the electricity sales income has decreased by ¥220,600, the price of purchasing power from the primary grid has decreased by ¥3,000, but the cost of buying DG from power consumers has increased by ¥8,000. The reason is that Method 2 is a distribution network planning method without considering the game relationship between the main bodies, and it seeks to maximize the shared interests of power customers and distribution network companies. The increase in the total revenue of distribution network companies is obtained at the expense of the interests of power users. When the distribution network company uses Method 3 to make planning decisions, it considers the game relationship between market players, and its planning scheme is obtained from the perspective of individual interests. Therefore, a new line is constructed between nodes 4 and 5, which evidently lowers the cost of node 5 and raises revenue from electricity sales by increasing the sales of electricity. At the same time, the cost of building additional expansion lines has increased, and as a result, when all expenses and advantages are taken into account, the distribution network company’s overall benefit is lower when using Method 3.
The data in Table 9 show the comparison of the overall expenditure of the distribution company and the power user when they make planning decisions using methods 2 and 3. The overall expenditure
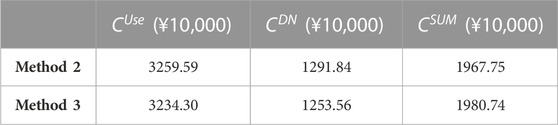
TABLE 9. Comparison of the total expenditures of power users and distribution companies under methods 2 and 3.
Table 9 demonstrates that, in comparison to Method 3, the overall expenditure of each entity when using Method 2 to make planning decisions is reduced by ¥129,900, but the cost expenditure of power users is increased by ¥252,900. Because Method 2 is a distribution network design method, it maximizes the interests of both power customers and distribution network corporations as a whole, so their overall cost expenditure is optimal. The result of pursuing the optimal overall expenditure is bound to sacrifice the interests of some market players, so the increase in the distribution network company’s revenue in Method 2 is at the expense of the interests of power users. However, in the electricity market environment, each market’s main body takes its own benefit maximization as the goal in the planning process, and the electricity users with individual rational characteristics find it impossible to increase their own cost expenditure in order to optimize the overall expenditure. This planning method does not conform to the actual operation mechanism of the electricity market; it can not only obtain an accurate and effective planning scheme but also disrupt the market order and affect the stable operation of the electricity market. When each agent uses Method 3 to make decisions, its decision-making method is based on a continuous game, and no participant can improve outcomes by altering their own approach. This method takes into account the interests of all parties; not only can it obtain a more accurate planning scheme but can also ensure the fairness of the whole electricity market competition so as to stimulate market vitality and improve the efficiency of resource allocation.
This study proposes a strategy for planning distribution networks that takes into consideration the multi-agent games and distribution system operators. Using the power distribution market’s planning and operating mechanisms, a multi-agent game planning model that takes market pricing into account is developed. In the end, the iterative search methodology is used to solve the model. The paper’s precise conclusions are as follows.
(1) Compared with the traditional methods, the proposed distribution network planning method considering distribution system operators and the multi-agent game not only considers the guiding role of market price but also considers the game relationship of market players. In the process of a continuous game, market players can still consider the impact of market prices, and this enhances planning and decision-making’s efficacy and precision.
(2) This research develops a distribution network planning model based on the theory of the nodal marginal pricing of the distribution network, taking into account the distribution system operators and multi-agent game in view of changes in the market price during the distribution network planning process so that each agent can make a rapid and reasonable response to the market, thus improving the vitality of the market and the efficiency of power resource allocation.
The original contributions presented in the study are included in the article/Supplementary Material; further inquiries can be directed to the corresponding author.
JL, ST, JJ, and SC contributed to the conception and design of the study. ST organized the database. JJ performed the statistical analysis. JL wrote the first draft of the manuscript. TW and SC wrote sections of the manuscript. All authors contributed to the article and approved the submitted version.
This paper was supported by the Science and Technology Project of Shenzhen Power Supply Corporation, grant number SZKJXM20220036/09000020220301030901283.
Authors JL, TW, ST, JJ, and SC were employed by the China Southern Power Grid.
The authors declare that this study received funding from Shenzhen Power Supply Corporation. The funder had the following involvement in the study: data collection and analysis.
All claims expressed in this article are solely those of the authors and do not necessarily represent those of their affiliated organizations, or those of the publisher, the editors, and the reviewers. Any product that may be evaluated in this article, or claim that may be made by its manufacturer, is not guaranteed or endorsed by the publisher.
Chen, J., and Du, X.Y. H. (2019a). Multi-objective optimization research on dynamic procurement strategy for electricity retailers considering uncertainty factors. Power Syst. Prot. Control. doi:10.19783/j.cnki.pspc.181450
Chen, J. J., Qi, B. X., Rong, Z. K., Peng, K., Zhao, Y. L., and Zhang, X. H. (2021). Multi-energy coordinated microgrid scheduling with integrated demand response for flexibility improvement. Energy 217, 119387. doi:10.1016/j.energy.2020.119387
Chen, L., Zhou, Y., and Fang, C. (2019b). Bidding game between power generation companies and consumers considering carbon trade. Proc. CSU-ESPA. doi:10.19635/j.cnki.csu-epsa.000161
Dewey, Liu, Dong, , and Li, W. (2020). Stochastic optimization of integrated energy system considering distribution locational marginal price. Electr. Power Constr., doi:10.12204/j.issn.1000-7229.2020.12.014
Fang, P., Fu, W., Wang, K., Xiong, D., and Zhang, K. (2022). A compositive architecture coupling outlier correction, EWT, nonlinear Volterra multi-model fusion with multi-objective optimization for short-term wind speed forecasting. Appl. Energy 307, 118191. doi:10.1016/J.APENERGY.2021.118191
Fu, W., Jiang, X., Li, B., Tan, C., Chen, B., and Chen, X. (2023). Rolling bearing fault diagnosis based on 2D time-frequency images and data augmentation technique. Meas. Sci. Technol. 34, 045005. doi:10.1088/1361-6501/ACABDB
Gao, N., Zhang, H., Wang, Z., Xu, J., Cheng, J., Gao, R., et al. (2020). Planning for site selection and capacity determination of distributed energy storage in regional power grid. High. Volt. Appar., doi:10.13296/j.1001-1609.hva.2020.08.009
Hu, J., Li, Y., Wu, J., and Ai, X. (2019). A day-ahead optimization scheduling method for prosumer based on iterative distribution locational marginal price. Power Syst. Technol. 10. doi:10.13335/j.1000-3673.pst.2019.0619
Li, B., Wang, X., Jiang, C., and Zhao, Y. (2018). Market strategy modeling and risk profit analysis of demand-side resource aggregator. Automation Electr. Power Syst., doi:10.7500/AEPS20170511006
Li, R. (2017). Comprehensive benefit evaluation method of distributed generation/microgrid projects based on different business models. Power Syst. Technol. 6. doi:10.13335/j.1000-3673.pst.2017.0042
Li, R., Ma, H., Wang, F., Wang, Y., Liu, Y., and Li, Z. (2013). Game optimization theory and application in distribution system expansion planning, including distributed generation. Energies 6, 1101–1124. doi:10.3390/en6021101
Li, Z., Wu, L., and Xu, Y. (2021b). Risk-averse coordinated operation of a multi-energy microgrid considering voltage/var control and thermal flow: An adaptive stochastic approach. IEEE Trans. Smart Grid 12, 3914–3927. doi:10.1109/TSG.2021.3080312
Li, Z., Wu, L., Xu, Y., Wang, L., and Yang, N. (2023). Distributed tri-layer risk-averse stochastic game approach for energy trading among multi-energy microgrids. Appl. Energy 331, 120282. doi:10.1016/j.apenergy.2022.120282
Li, Z., Wu, L., Xu, Y., and Zheng, X. (2022). Stochastic-weighted robust optimization based bilayer operation of a Multi-energy building microgrid considering practical thermal loads and battery degradation. IEEE Trans. Sustain. Energy 13, 668–682. doi:10.1109/TSTE.2021.3126776
Li, Z., Yu, C., Abu-Siada, A., Li, H., Li, Z., Zhang, T., et al. (2021a). An online correction system for electronic voltage transformers. Int. J. Electr. Power & Energy Syst. 126, 106611. doi:10.1016/j.ijepes.2020.106611
Liao, C., Wang, J., and Hu, S. (2013). The power distribution network expansion planning based on stackelberg minimum weight K-star game. J. Circuits, Syst. Comput. 22, 1350041. doi:10.1142/S0218126613500412
Liao, S., Xu, J., Sun, Y., Bao, Y., and Tang, B. (2018). Control of energy-intensive load for power smoothing in wind power plants. IEEE Trans. Power Syst. 33, 6142–6154. doi:10.1109/TPWRS.2018.2834940
Liu, H., Zheng, N., Ge, S. Y., Xu, Z. Y., and Guo, L. (2020). Coordinated planning of source and network in active distribution system with demand response and optimized operation strategy. Autom. Electr. Power Syst., doi:10.7500/AEPS20190312010
Liu, X., Gao, B., and Li, Y. (2018). Review on application of game theory in power demand side. Power Syst. Technol. 42, 8. doi:10.13335/j.1000-3673.pst.2018.0039
Liu, Y., Qiu, X., and Qiu, G. (2016). Optimal operation of micro grid account of the response of electric vehicle user. High. Volt. Appar., doi:10.13296/j.1001-1609.hva.2016.04.026
Lou, S. H., Lv, M. X., Wang, Y. C., and Wu, Y. W. (2019). Generation investment expansion planning for wind power accommodation considering investment risk. Proc. CSEE 7. doi:10.13334/j.0258-8013.pcsee.172410
Lu, Q., Chen, L., and Mei, S. (2014). Typical applications and prospects of game theory in power system. Proc. CSEE. doi:10.13334/j.0258-8013.pcsee.2014.29.002
Ma, H., Zheng, K., Jiang, H., and Yin, H. (2021). A family of dual-boost bridgeless five-level rectifiers with common-core inductors. IEEE Trans. Power Electron. 36, 12565–12578. doi:10.1109/TPEL.2021.3078533
Nan, Y., Di, Y., Zheng, Z., Jiazhan, C., Daojun, C., and Xiaoming, W. (2018). Research on modelling and solution of stochastic SCUC under AC power flow constraints. IET Gener. Transm. Distrib. 12, 3618–3625. doi:10.1049/iet-gtd.2017.1845
Nan, Y., Li, X., Liu, Y., Xin, P., Jiang, J., Yan, J., et al. (2023). Research on distribution network planning method based on multi-lateral incomplete information evolutionary game in power market. Power Grid Technol., doi:10.13335/j.1000-3673.pst.2022.2502
Shen, X., and Raksincharoensak, P. (2021). Pedestrian-aware statistical risk assessment. IEEE Trans. Intelligent Transp. Syst. 23, 7910–7918. doi:10.1109/TITS.2021.3074522
Veeramsetty, V. (2021). Shapley value cooperative game theory-based locational marginal price computation for loss and emission reduction. Prot. Control Mod. Power Syst. 6, 33. doi:10.1186/s41601-021-00211-0
Wang, C., Chu, S., Ying, Y., Wang, A., Chen, R., Xu, H., et al. (2023). Underfrequency load shedding scheme for islanded microgrids considering objective and subjective weight of loads. IEEE Trans. Smart Grid 14, 899–913. doi:10.1109/TSG.2022.3203172
Wang, Z., Wang, J., and Zhao, H. (2018). Study on LMP pricing method in distribution networks based on energy conservation and emission reduction of DG using market game behavior. Power Syst. Prot. Control. doi:10.7667/PSPC171509
Wei, H., Sasaki, H., Kubokawa, J., and Yokoyama, R. (1998). An interior point nonlinear programming for optimal power flow problems with a novel data structure. IEEE Trans. Power Syst. 13, 870–877. doi:10.1109/59.708745
Xu, B., Zhang, G., Li, K., Li, B., Chi, H., Yao, Y., et al. (2023a). Publisher Correction: Reactive power optimization of a distribution network with high-penetration of wind and solar renewable energy and electric vehicles. Prot. Control Mod. Power Syst. 8, 21. doi:10.1186/S41601-023-00290-1
Xu, P., Fu, W., Lu, Q., Zhang, S., Wang, R., and Meng, J. (2023b). Stability analysis of hydro-turbine governing system with sloping ceiling tailrace tunnel and upstream surge tank considering nonlinear hydro-turbine characteristics. Renew. Energy 210, 556–574. doi:10.1016/j.renene.2023.04.028
Yang, N., Dong, B., Huang, Y., Li, H., Ye, D., Liu, S., et al. (2019). Incremental distribution network source-load collaborative planning method considering uncertainty and multi-agent game. Proc. CSEE 39. doi:10.13334/j.0258-8013.pcsee.181409
Yang, N., Dong, Z., Wu, L., Zhang, L., Shen, X., Chen, D., et al. (2022c). A comprehensive review of security-constrained unit commitment. J. Mod. Power Syst. Clean Energy 10, 562–576. doi:10.35833/MPCE.2021.000255
Yang, N., Qin, T., Wu, L., Huang, Y., Huang, Y., Xing, C., et al. (2022a). A multi-agent game based joint planning approach for electricity-gas integrated energy systems considering wind power uncertainty. Electr. Power Syst. Res. 204, 107673. doi:10.1016/j.epsr.2021.107673
Yang, N., Yang, C., Wu, L., Shen, X., Jia, J., Li, Z., et al. (2021). Intelligent data-driven decision-making method for dynamic multi-sequence: An E-Seq2Seq based SCUC expert system. IEEE Trans. Ind. Inf. 1, 3126–3137. doi:10.1109/tii.2021.3107406
Yang, N., Yang, C., Xing, C., Ye, D., Jia, J., Chen, D., et al. (2022b). Deep learning-based SCUC decision-making: An intelligent data-driven approach with self-learning capabilities. IET Gener. Transm. Distrib. 16, 629–640. doi:10.1049/GTD2.12315
Yang, Y., Chen, H., Zhang, Y., Li, F., Jing, Z., and Wang, Y. (2011). An electricity market model with distributed generation and interruptible load under incomplete information. Chin. Soc. Electr. Eng., doi:10.13334/j.0258-8013.pcsee.2011.28.001
Yu, G., Liu, C., Tang, B., Chen, R., Lu, L., Cui, C., et al. (2022). Short term wind power prediction for regional wind farms based on spatial-temporal characteristic distribution. Renew. Energy 199, 599–612. doi:10.1016/j.renene.2022.08.142
Yuan, Z., Hesamzadeh, M. R., and Biggar, D. R. (2016). Distribution locational marginal pricing by convexified ACOPF and hierarchical dispatch. IEEE Trans. Smart Grid 9, 3133–3142. doi:10.1109/tsg.2016.2627139
Zeng, B., Shi, J., Wen, J., and Zhang, J. (2017). A game-theoretic framework for active distribution network planning to benefit different participants under the electricity market. Turkish J. Electr. Eng. Comput. Sci. 25, 83–94. doi:10.3906/ELK-1504-94
Zhang, L., and Luo, Y. (2018). Combined heat and power scheduling: Utilizing building-level thermal inertia for short-term thermal energy storage in district heat system. IEEJ Trans. Electr. Electron. Eng. 13, 804–814. doi:10.1002/tee.22633
Zhang, Y., Wei, L., Fu, W., Chen, X., and Hu, S. (2023). Secondary frequency control strategy considering DoS attacks for MTDC system. Electr. Power Syst. Res. 214, 108888. doi:10.1016/J.EPSR.2022.108888
Zhang, Y., Xie, X., Fu, W., Chen, X., Hu, S., Zhang, L., et al. (2022). An optimal combining attack strategy against economic dispatch of integrated energy system. IEEE Trans. Circuits Syst. II Express Briefs 70, 246–250. doi:10.1109/tcsii.2022.3196931
Zhou, Y., Zhai, Q., and Wu, L. (2022). Optimal operation of regional microgrids with renewable and energy storage: Solution robustness and nonanticipativity against uncertainties. IEEE Trans. Smart Grid 13, 4218–4230. doi:10.1109/TSG.2022.3185231
Keywords: distribution network planning, DSO, DLMP, multi-agent game, iterative search algorithm
Citation: Li J, Wang T, Tang S, Jiang J and Chen S (2023) Planning distribution network using the multi-agent game and distribution system operators. Front. Energy Res. 11:1244394. doi: 10.3389/fenrg.2023.1244394
Received: 22 June 2023; Accepted: 17 July 2023;
Published: 31 July 2023.
Edited by:
Zhengmao Li, Aalto University, FinlandReviewed by:
Yuanchao Hu, Shandong University of Technology, ChinaCopyright © 2023 Li, Wang, Tang, Jiang and Chen. This is an open-access article distributed under the terms of the Creative Commons Attribution License (CC BY). The use, distribution or reproduction in other forums is permitted, provided the original author(s) and the copyright owner(s) are credited and that the original publication in this journal is cited, in accordance with accepted academic practice. No use, distribution or reproduction is permitted which does not comply with these terms.
*Correspondence: Jiangnan Li, eDE4ODcxMTM2MTQ1QDE2My5jb20=
Disclaimer: All claims expressed in this article are solely those of the authors and do not necessarily represent those of their affiliated organizations, or those of the publisher, the editors and the reviewers. Any product that may be evaluated in this article or claim that may be made by its manufacturer is not guaranteed or endorsed by the publisher.
Research integrity at Frontiers
Learn more about the work of our research integrity team to safeguard the quality of each article we publish.