 Ze-Han Zhou1†
 Jia-Ming Zhu
- 1School of Management Science and Engineering, Anhui University of Finance and Economics, Bengbu, China
- 2School of Statistics and Applied Mathematics, Anhui University of Finance and Economics, Bengbu, China
- 3School of International Trade and Economics, Anhui University of Finance and Economics, Bengbu, China
Rapid urbanization and economic development have inevitably led to light pollution. However, currently the world has not yet formed a unified technical standard for light pollution, and light pollution cannot be effectively controlled when the environmental protection department is unable to operate. To effectively solve this problem, this paper establishes a combined weight ideal point method evaluation model based on TOPSIS evaluation method to obtain comprehensive index weights to evaluate the light pollution risk levels of four different land types in urban, suburban, rural and nature reserve areas in Beijing, China, and uses one-way ANOVA to test the differences among the four regions. Based on the Random Forest algorithm to determine the three variables with the top three feature importance weights, and based on the nonlinear optimization algorithm, using the SLSQP method, the optimal parameter combinations with the smallest cost are obtained after iteration, so as to put forward three feasible intervention strategies such as adjusting the design of the nightscape lighting, reducing the time of nonessential lighting, and rationally planning the layout of the city’s lighting, etc., to solve the light pollution problem, which effectively promote the urban nightscape lighting’s it effectively promotes the healthy and sustainable development of urban nightscape lighting.
1 Introduction
1.1 Background of light pollution
With the advancements in modern life, environmental pollution has emerged as a common issue in numerous countries. A pressing need for people to enhance their quality of life is the provision of a visible, safe, comfortable, and appealing light environment (Cao et al., 2023). However, the usage of certain inappropriate light sources has resulted in light pollution within the human habitat. The International Dark Sky Association defines light pollution as the adverse environmental effects caused by the excessive or improper utilization of artificial light, which has significant impacts on humans, wildlife, and the climate (Guan et al., 2022; Cupertino et al., 2023). Light pollution is generally categorized into three types: white bright pollution, artificial daylight, and colored light pollution. The Lighting Research Center at Rensselaer Polytechnic Institute in the United States further divides light pollution into sky glow, light intrusion, glare, excessive lighting, and mixed light. Figure 1 illustrates the interconnections of these various forms of light pollution.
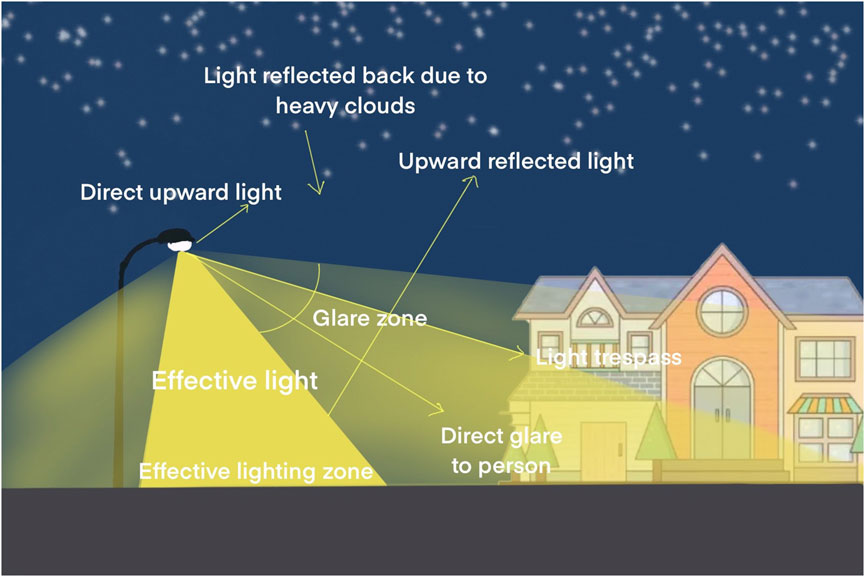
FIGURE 1. Light pollution diagram.
1.2 Hazards of light pollution
Currently, atmospheric light pollution has emerged as a significant global problem. It not only poses challenges to astronomical observation but also disrupts the natural cycles of living organisms. The most notable harm lies in its impact on life patterns, as it disturbs the biological clock of plants and animals and even threatens ecological balance. Furthermore, the consequences of light pollution on human health, energy wastage, and increased carbon emissions should not be underestimated (Aksaker et al., 2020). The primary hazards include adverse effects on physical and psychological wellbeing, disruption of urban traffic, ecological imbalance, energy squandering, and impairment of aesthetic appeal. It is evident that unsuitable lighting has a diverse range of negative effects on both human society and the ecological environment (Argys et al., 2021; Lian et al., 2021). These effects can be immediate or accumulate over the long term. Failing to address these issues seriously will result in severe, and potentially irreversible, consequences.
1.3 Research status
Light pollution, as a newly recognized form of pollution, indeed poses hazards. However, there are currently no specific legal guidelines defining the extent and types of light pollution that can cause harm to people or the ecological environment (Heilig, 2010; Kocifaj, 2011).
1.3.1 Status of international research
The American scholar Walker proposed a method as early as 1973 to estimate the increase in sky luminance
1.3.2 Status of domestic research
In terms of legislation, China has not yet introduced formal standards and norms for the prevention and control of light pollution, only to major universities and institutions of scholars to put forward the relevant recommendations mostly, in 2010, Chinese scholars Huang Shuhan in the rule of law of light pollution, put forward the light pollution directory system, the plan planning system, incentives and rewards system, etc. Specifically explaining the types of infringement and the way to take responsibility, but compared with the status quo of legislation in Japan, Europe and the United States and other countries, China in the mandatory, restrictive standards are still a large gap with the international.
In terms of prevention and control technology, some cities in China have introduced technical standards related to light pollution, for example, in 1999, Tianjin City promulgated China’s first technical specification for nights-cape lighting, which put forward limit values for light pollution such as glare, etc. In 2006, Beijing City promulgated the “Technical Specification for Nights-cape Lighting in Cities,” which clearly stipulates the control standards for the interfering light from the windows of the living rooms of the residences and the wards of the hospitals, and limits the vertical illuminance and direct view of luminous body light intensity of the windows in different periods of time (Tähkämö et al., 2019; Owens et al., 2020). In 2006, Beijing promulgated the “Urban Nights-cape Lighting Technical Code,” which clearly stipulates the control standards for disturbing light from windows in residential rooms and hospital wards, limiting the vertical illuminance of windows and the light intensity of luminous bodies in direct view by time.
In summary, existing light pollution technical regulations and technical guidelines around the world focus mainly on the limitation of brightness and illuminance from a lighting design perspective. However, there is no harmonized standard for light pollution technology. Light pollution exhibits similar forms and hazardous characteristics globally, so it is crucial to share valuable experiences and methods of prevention and control across regions (Macgregor et al., 2015). To enhance public awareness of light pollution and develop effective intervention strategies, this paper employs a systematic approach. Firstly, appropriate indicators are selected to establish a quantitative light pollution prediction model, enabling a thorough analysis of the risk level in a given area. Secondly, an extensive and diverse data set is collected, ensuring the inclusion of various locations to enhance the generalization of model. Lastly, utilizing the established risk assessment model and data-set, potential intervention strategies are proposed. Representative locations are chosen to demonstrate the effectiveness of these strategies, thereby confirming the model’s validity and practicality.
2 Light pollution risk evaluation model
2.1 Indicator selection
The issue of light pollution not only disrupts people’s everyday lives, but it also significantly hampers society’s sustainable development (Han et al., 2014). To set up a regional light pollution risk evaluation system, we derive indicators for assessing light pollution levels from research on lighting, glare, and light spillage (Cinzano and Falchi, 2014). Existing research suggests that three main factors can be analyzed through measurement and detection technology, nighttime landscape quality, and hazard risk assessment. The specific secondary and tertiary indicators are presented in Table 1.
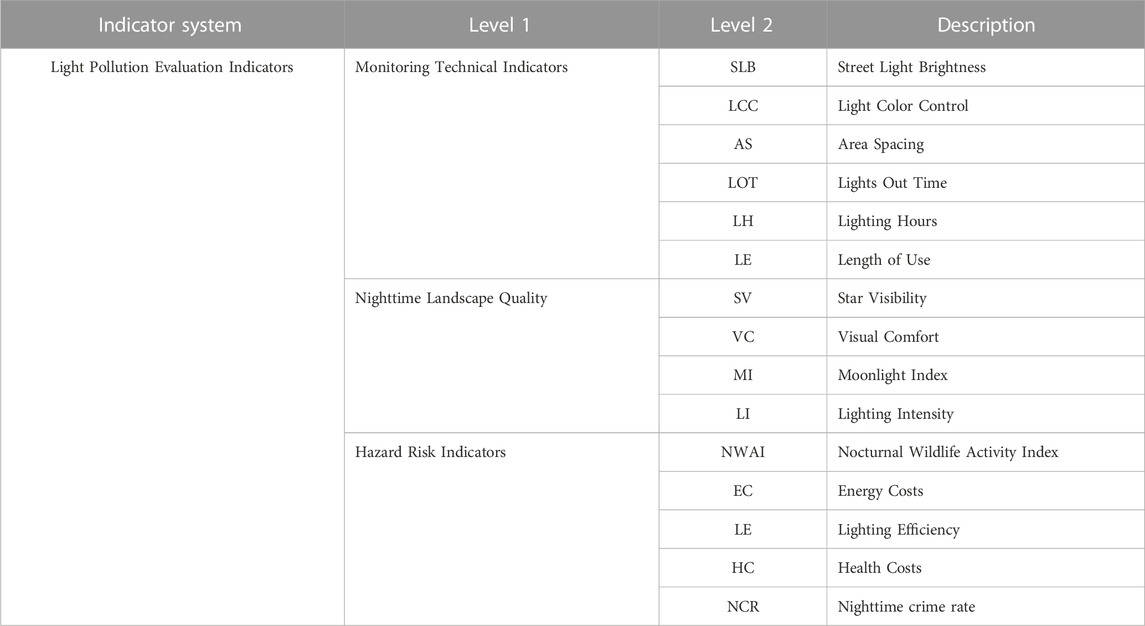
TABLE 1. Light pollution risk evaluation system.
2.2 Weight determination
Weight is a value used to measure the impact of each unit marker on the total and it is used to highlight the importance of individual factors in a system of factors. The methods of determining weights can be categorized into subjective assignment methods, objective assignment methods and combination of subjective and objective assignment methods. Subjective methods include Analytic Hierarchy Process (AHP), Delphi method, etc. The advantage of subjective assignment method is that experts can reasonably determine the order of each indicator weight according to the actual decision-making problem and experts’ own knowledge and experience, so that there will not be a situation in which the attribute weights are contrary to the actual importance of the attributes. However, the results are subjective, arbitrary, less objective, and largely dependent on the experience and level of the expert. Objective assignment method includes entropy value method and eigenvector method. Objective assignment method is mainly based on the relationship between the original data to determine the weight, so the weight of the objectivity is strong, and does not increase the burden of the decision maker, the method has a strong mathematical theory basis. However, this assignment method does not take into account the subjective intention of the decision maker, so the determined weights may not be consistent with people’s subjective wishes or the actual situation. Each method has its unique advantages and limitations. In order to mitigate the limitations of a single method and to utilize the strengths of each method, this paper employs a combined subjective and objective allocation method using AHP and entropy methods. This combination helps to eliminate subjective bias and objective one-sidedness and ensures more accurate data.
2.2.1 Entropy weighting method
Entropy method is an objective allocation method that utilizes data entropy information, i.e., the amount of information for weight calculation. The lower the information entropy, the greater the degree of variation of the indicator, the more information it provides, the greater the role it plays in the comprehensive evaluation, and the higher the weight. This method is applicable to the data of which it is possible to determine the degree of dispersion of a particular indicator. The higher the degree of dispersion, the greater the influence of the indicator on the overall evaluation. Therefore, the entropy value is used to determine the degree of dispersion of a particular indicator.
Step 1: Data pre-processing
Ensuring the integrity of the data during the acquisition process seems to be a challenge. However, having comprehensive data is critical, so we must properly handle any missing data to improve the accuracy and validity of our model. We next supplemented missing values with mean values, similar values, or identical values with like values, and fitted curves when the database was smooth and continuous data were missing.
Step 2: Entropy weighting determination
First, we arrange the original index data into a matrix A. The elements of this matrix, denoted as
Specifically, for the positive evaluation indicator, the function is:
The function of the inverse evaluation index is:
Next, the matrix is normalized by applying the polarization method to the values
Finally, based on the normalized processed information entropy is calculated by entropy weight method
2.2.2 AHP method to establish weights
The subjective weighting method uses Analytic Hierarchy Process (AHP). Compared with other methods, this method requires less quantitative data and analyzes the nature of the problem to be studied, the factors involved in the problem, and the intrinsic connections more clearly and thoroughly. It breaks down the elements associated with decision making into multiple levels such as objectives, criteria and options. Subsequently, qualitative and quantitative analyses are carried out at these levels. Modeling using AHP can be executed in four steps broadly as follows:
◊Establish quantitative criteria: When measuring the relative importance of indicators, the AHP method generally introduces a scale of relative importance in the ninth percentile according to the requirements of psychology, and constitutes a judgment matrix A. The elements of matrix A, Aij, represent the two-by-two comparison of the relative importance of indicators in the horizontal rows to indicators in the columns Bi (B is the next level of indicators of A). The results of the calculations are shown in Table 2.
◊ Construct the judgment matrix: by using the two-comparison method, the two-comparison scores of each relevant element can be obtained from a number of two-comparison judgment matrices based on a number of indicators in the middle level.
◊ Expert Scoring Matrix: after obtaining the expert scoring matrix, the matrix is processed and the eigenvalues
◊ Normalization test:

TABLE 2. Nine quantile scales table.
2.2.3 Combined subjective and objective assignment method for portfolio assignment
Using entropy method to obtain objective assignment of 15 index weights
The calculation results of various weights are shown in Figure 2.
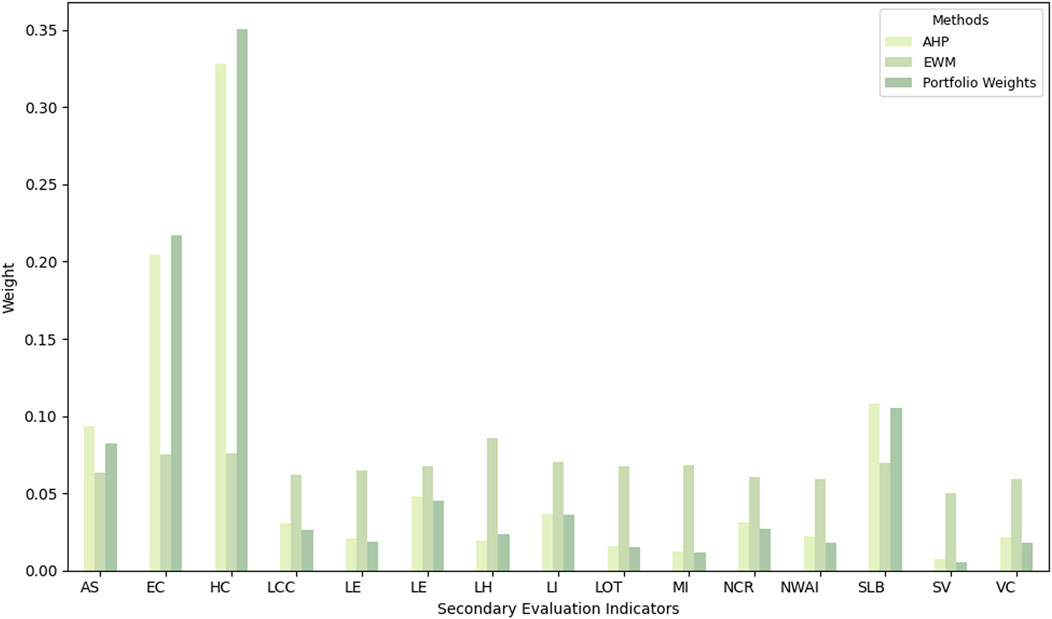
FIGURE 2. Secondary indicator weights.
2.3 Assessment of light pollution risk for four major land types based on TOPSIS
Previously, we modeled a system for evaluating regional light pollution risk levels. The second question involves a regional test of our initial model. We need to select four different types of locations for application within the model, interpreting the resulting indicators and analyzing them (Olsen et al., 2014; Lim et al., 2018; Ngarambe et al., 2018). The Global Night-time Light Database (GNLD) is a database primarily reflecting the nighttime light data of provinces, prefectures, and counties in China (Levin and Duke, 2012; N et al., 2018).
Utilizing the extraction function of the spatial analysis module in ArcGIS software, we chose the stable light data of China as our original research data. We used the 1:4 million vector map of provincial administrative divisions provided by China’s National Basic Geographic Information Center to crop and overlay the raster data with the light data (Jiang et al., 2018). This process resulted in our obtaining the light image of China for 2020, as shown in Figure 3.
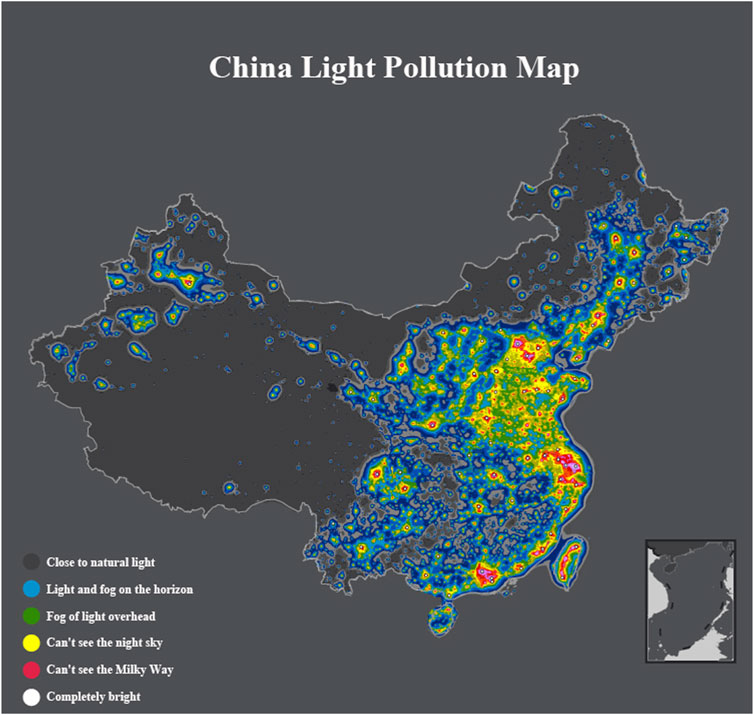
FIGURE 3. 2020 China lighting image.
The figure clearly identifies three major areas of intense light, with high brightness concentrated in clusters of cities. These include the Beijing-Tianjin-Tangshan city cluster as the core of 11 urban areas with high brightness, the Yangtze River Delta city cluster as the core of 13 such areas, and the Shandong Peninsula city cluster as the core of 7 areas (Ściężor et al., 2012).
Among these three main regions of intense light, the Beijing-Tianjin-Tangshan city cluster has the highest brightness. This cluster exhibits a moderate number and size of cities with high brightness, clear data segmentation, and significant differences in light levels. Compared to the Yangtze River Delta region, data collection is easier in this cluster. Hence, we selected Beijing as our designated study area (Luarte et al., 2016).
Given that different types of land can tolerate different thresholds of light pollution, we measured light pollution-related index data for downtown Beijing, the suburbs of Beijing, rural areas surrounding Beijing, and nature reserves within Beijing. We used the TOPSIS evaluation method for this purpose. The results were further tested and analyzed using one-way ANOVA (Xiang and Tan, 2017).
2.3.1 TOPSIS comprehensive evaluation method
The Technique for Order of Preference by Similarity to Ideal Solution (TOPSIS) is a multi-objective decision analysis method. It is particularly appropriate for comparing multiple solutions or objects, enabling the identification of the best solution or the most competitive object.
Step 1: After calculating the weights of each indicator using the entropy weighting method, and noting as
Determine the positive ideal solution
Calculate the Marxist distance from the evaluation object to the positive ideal solution
Distance to positive ideal point:
Distance to negative ideal point:
Where
Where
After calculating, the ratings of light pollution prevention in urban, suburban, rural and nature reserves in Beijing were obtained and the results are shown in Figure 4 below.
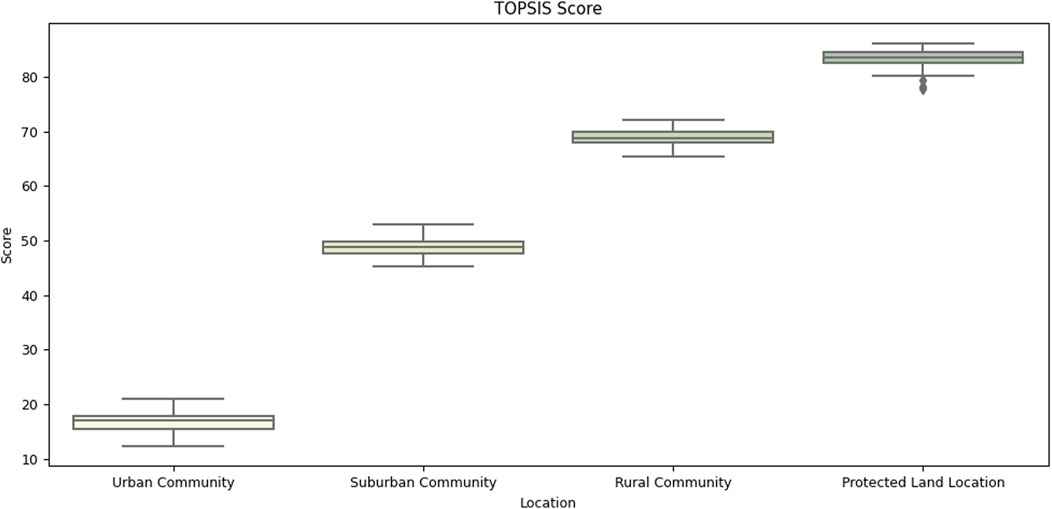
FIGURE 4. Four regional scoring line chart.
2.3.2 One-way ANOVA
Based on the above scoring results, we performed a one-way ANOVA on the biases caused by the indicators in different environments among them.
One-way ANOVA, also known as one-dimensional ANOVA, is used to analyze whether there are significant differences in the means of the dependent variables when individual control factors are taken at different levels.
The test results are shown in the following Table 3, Table 4 and Table 5. The level of significance is 0.05 (Note, PL: Protected land, RC: Rural communities, SC: Suburban communities, UC: Urban communities).

TABLE 3. Chi-square test.
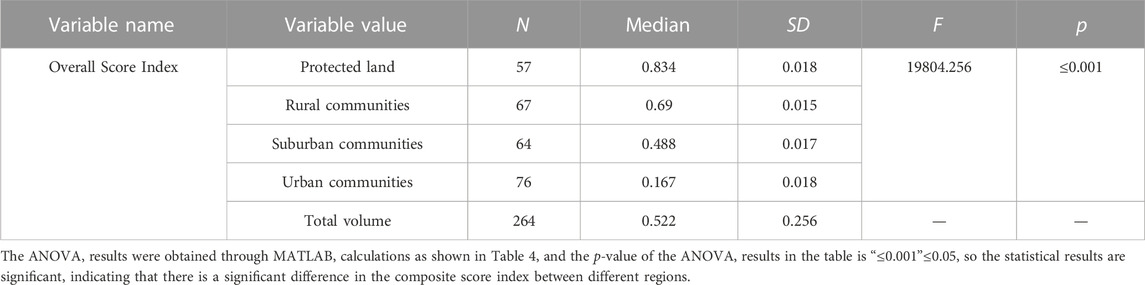
TABLE 4. Analysis of variance results table.

TABLE 5. Results of the quantitative analysis of effects.
The results of the quantitative analysis of effects showed that based on the composite score index, the Eta-squared (η2 value) was 0.996, indicating that 99.6% of the variance in the data stemmed from differences between groups. Cohen’s f value was 15.117, indicating that the degree of variance quantified by the effects of the data was a large degree of variance.
One-way ANOVA results in the p-value of “≤0.001” ≤0.05, the statistical results are significant further prove that different communities have significant differences in the composite score, E4 (urban community) composite score index 0.167 significantly smaller than E1 (nature reserve) composite index score 0.834, resulting in the final conclusion E1risk < E2risk < E3risk < E4risk, which means that the urban community has the highest level of light pollution risk.
2.4 Risk level analysis conclusion
Zoning rules have become a fundamental element in the establishment of environmental planning. The advantage of zoning is that once pollution is unavoidable, zoning can narrow the pollution situation so that it does not harm other environmental areas. Zoning control cannot completely end environmental pollution, but it can provide a certain reference for the development of laws and regulations to prevent environmental pollution. By referring to the requirements of the International Commission on Illumination, we divide the specific zoning into very secluded areas (E1) such as national parks and nature reserves; low luminance environment (E2): rural communities that do not belong to E1; medium luminance environment (E3): suburban communities that do not belong to E1 and E2; and high luminance environment (E4): urban communities with large activity centers.
Based on the Beijing Municipal Commission of Urban Management, the Global Night Light Database and other indicators data of Beijing, China, after preliminary substitution into the TOPSIS evaluation method model, we obtained the scores of Beijing urban, suburban, rural and Beijing nature reserves on light pollution prevention and control as shown in Figure 4, the scores of the four communities have significant differences, E4 (urban communities) scores between the interval 15–25 points is much smaller than the interval score of E1 (nature reserves) 90–100, from which we can get the preliminary conclusion community brightness environment and light pollution risk level into a positive relationship.
3 Optimizing urban lighting policies based on non-linear programming models
3.1 Selection of key indicators
3.1.1 Random Forest Algorithm
Since there are many factors affecting light pollution, in order to determine the specific content of the policy, we use the random forest feature selection method to obtain the importance of the feature indicators, and select the top three important features as the indicators for evaluating the effect of the policy. Corresponding solution measures are proposed according to the first three important indicators.
Step 1. Algorithm principle steps: random forest is an integrated learning algorithm that consists of several weak classifiers combined into one strong classifier. A number of subsets are obtained from the original dataset with put-back sampling, and random features are selected for each decision tree on the basis of bagging. These m samples are modeled as m decision trees (Mishina et al., 2015; Schonlau and Zou, 2020). Finally, the results are obtained by voting through these m decision tree models. The specific steps are as follows:
◇Input training set D.
◇Form k training subsets Dk using bootstrap sampling.
◇Randomly select m features from the original features.
◇Train the training subset Dk, and make the optimal cut of the m randomly selected features, resulting in k decision tree predictions.
◇Vote on the k prediction results to find the prediction result with the highest number of votes. The random forest step diagram is shown in Figure 5.

FIGURE 5. Flow chart of feature selection based on random forest algorithm.
Step 2. Feature Importance Evaluation: the random forest model uses feature importance assessment to determine which features are most relevant. Feature importance assessment measures the predictive power of features for the target variable. In this code, feature importance assessment values are obtained by calculating the average reduced impurity of each feature across all decision trees. The calculation of the average impurity may vary from implementation to implementation, but the most commonly used metric is Gini impurity or entropy. We denote the variable importance measures (VIM) by VIM and the Gini index by GI. Suppose there are J features
Where C denotes that there are C categories and
According to the parameters of max depth, min samples split, min samples leaf of the decision tree and the number of trees and maximum number of features of the decision tree in the random forest, the data were trained to obtain the results of the importance ranking of light pollution risk level indicators features, as shown in Figure 6. The top three ranking of the feature indicators are: street Light Brightness (SLB), Lighting Hours (LH), Energy Cost (EC).
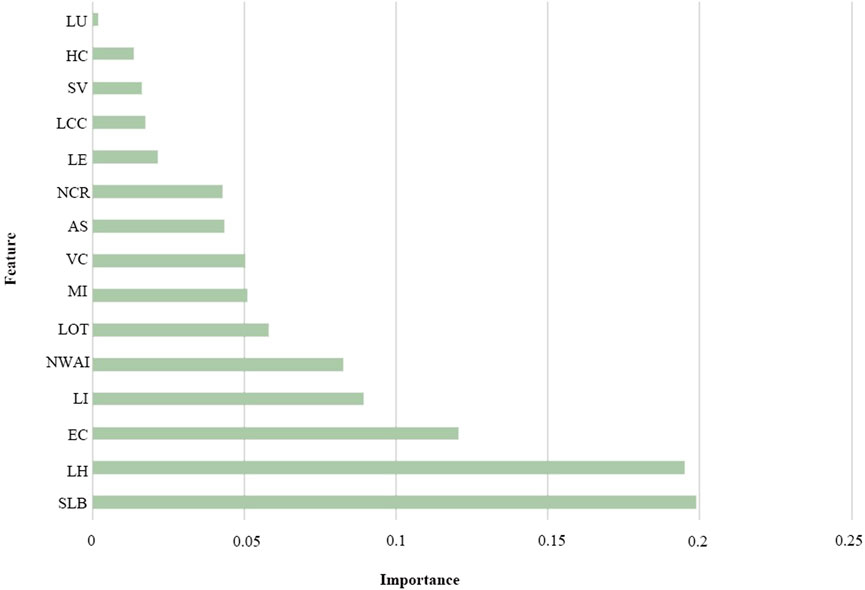
FIGURE 6. Policy indicator ranking.
3.2 Three intervention strategies
Based on the first three important indicators (SLB, LH, and EC) derived from the portfolio assignment method, we propose the following three policy characteristics, respectively:
►LH: n establishing ecological safety standards for lighting and reducing non-essential light hours.
Outdoor lighting is to provide a light environment for people’s nighttime activities. When people’s activities gradually decrease, the government can selectively turn off some of the lighting fixtures in different time periods, and keep only those essential safety lighting to reduce the non-essential light hours (Olsen et al., 2014; P et al., 2020; Kolláth et al., 2016). At different times according to the size of the flow of people to adjust the intensity of light, in the weekend or holiday lighting hours can be extended. This will not only reduce light pollution, but also save a lot of electricity for lighting, saving energy, and at the same time for the night star visibility, night wildlife activities, etc. Are improved (Pichardo-Corpus et al., 2020; P et al., 2020).
►SLB: adjustment of urban night lighting design, scientific and reasonable cloth light distribution.
The government’s night landscape construction must be considered from the energy and environmental aspects, and construction must be moderate, otherwise the effect is counterproductive. The main function of night lighting is lighting, followed by beautification, lighting a certain light intensity can be. Night lighting should be designed according to the needs and take into account ecological factors (Kolláth et al., 2016; Esposito and Radetsky, 2023).
Light pollution is largely caused by the unreasonable distribution of lights and lamps: on the one hand, it is related to the way and number of lights, and on the other hand, it is related to the beam angle and light direction of lamps (Jiang et al., 2017a; Guanglei et al., 2019). Therefore, the government should make reasonable use of the uneven distribution of brightness in space or time to decorate the city night scene when laying lights. At the same time, control the brightness of advertising lighting fixtures and precisely control the angle of light projection. Minimize the use of uplighting to illuminate the plants, and as far as possible to avoid plant lighting to the sky (Saraiji and Oommen, 2012; Ziou and Kerouh, 2018).
►EC: reasonable planning of urban lighting patterns to reduce energy costs.
By designing a reasonable and scientific lighting plan for the city, the government can plan the urban lighting pattern, improve the lighting efficiency by controlling the lighting installation area and reasonably adjusting the lighting light range, which can give greater play to the lighting function and reduce the energy use cost under the same light brightness (Jiang et al., 2017b).
3.3 Optimal policy choice based on nonlinear optimization algorithm
In order to thoroughly investigate the effects of the above three policies on light pollution levels in Beijing, a nonlinear optimization algorithm will be used in this paper. The nonlinear algorithm involves mathematical programming that contains nonlinear constraints or objective functions. It aims to solve the constrained optimization problem using the Sequential Least Squares Programming in the case of adhering to a set of equations or inequalities. Then, by means of iterations, the optimal combination of parameters for the objective function is found such that the total cost is minimized. In this case, at least one objective function or constraint is composed of nonlinear unknown quantities.
Subsequently, this paper will determine the minimum total cost and the optimal solution for the corresponding variables under the combined strategy according to the algorithm. This will be achieved by limiting the total cost associated with the use of streetlights.
3.3.1 Model assumptions
Street light bulbs uniformly have a power rating of 400 W. Even in unforeseen circumstances where the bulb may fail, the brightness of the bulb remains consistent regardless of usage.
The less the cost of the bulb length of use is linearly related.
Nighttime social crime rate and traffic accident rate is only related to lighting brightness, independent of other factors
In this model, we postulate that for every increase of 1,000 lumens, the nighttime social crime rate and traffic accident rate each decrease by 10%. These decreases are seen as the societal benefits of enhanced luminosity and are thus subtracted from the total cost.
3.3.2 Algorithm implementation
Based on the previous assumptions, we can derive the following expression for the total cost: Total cost is equal to the sum of price cost and social cost. Let ‘P’ denote the total cost, ‘P1’ represent the cost of the lamp, ‘UT’ denote the usage time of the lamp, ‘B’ represents the brightness of the lamp, and ‘LS’ symbolize the lifetime of the lamp. We set a range of values for each parameter as constraints. The initial guess for the objective function is [20, 5,000, 11], which is a reasonable initial value because it is within the range of our parameters. Then by iterating, the objective function finds the optimal combination of parameters.
The results obtained from the python run are shown as Figure 7.
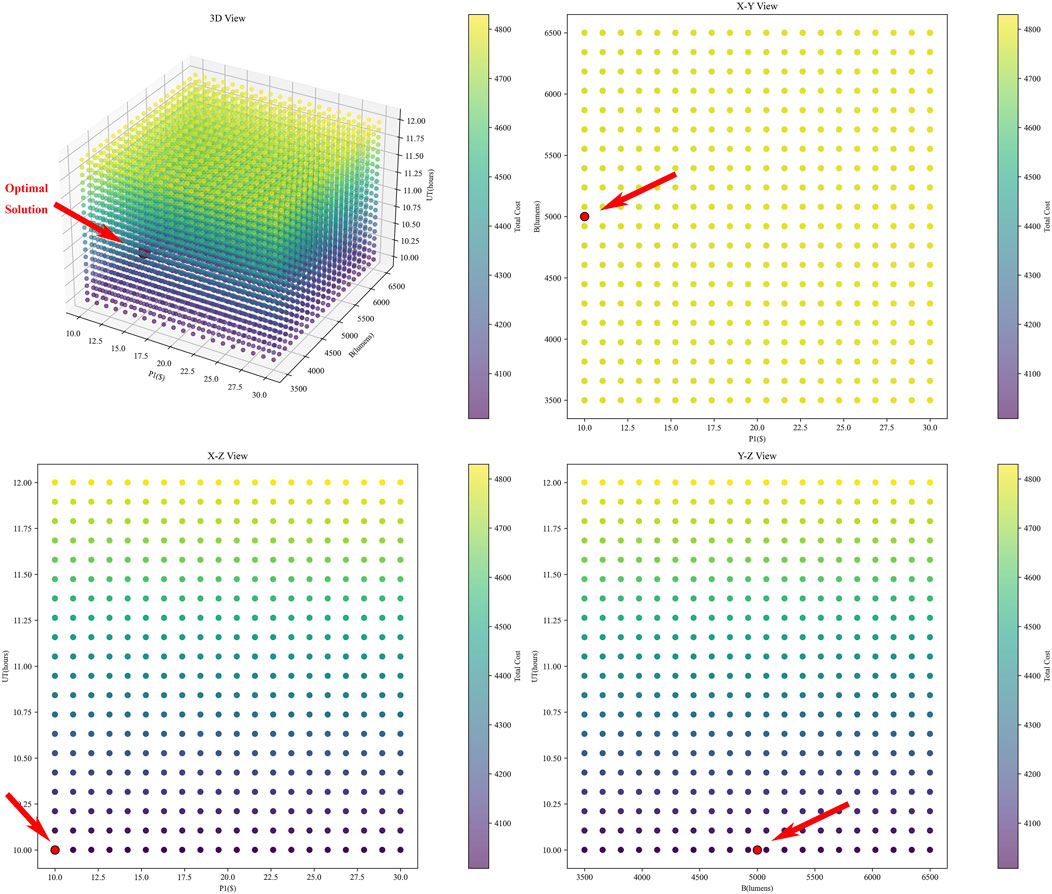
FIGURE 7. Non-linear programming viewable.
The image generated using Python is a 3D visualization of the solution as well as a three-view. The horizontal coordinate represents the cost of the lamp, the vertical coordinate represents the brightness of the lamp, and the vertical coordinate represents the time the lamp is used. The color scheme on the 3D graph reflects the total cost. In general, the darker the color, the smaller the total cost value, and the lighter the color, the larger the total cost value.
The visualization chart allows us to visualize the impact of the cost, brightness and usage time of the lamps on the total cost, and shows the impact of different combinations between them on the total cost. The darkest area of the graph corresponds to the lowest total cost due to the combination of cost, brightness and usage time.
The one marked by the red arrow is the optimal price. The lowest cost is achieved when using a bulb with a price of about $10, a brightness of about 5,000 lumens, and a usage time of 10 h. This result suggests that implementation of this policy could reduce nighttime crime and traffic accidents while keeping operating costs within reasonable limits. Therefore, this policy appears to pose less risk to the community while achieving optimal results.
4 Conclusion and prospect
4.1 Conclusion
Light pollution as an academic concept, the definition of light pollution not only needs to have a scientific basis and logical rigor, the most important is the need to establish measurable technical indicators, the light caused by the adverse consequences of modern technology through the monitoring means by quantitatively determining the severity of light pollution with a set level, so that the treatment of light pollution is operable. First of all, this paper in the existing light pollution research, based on the TOPSIS evaluation method based on the combination of weights ideal point method evaluation model in the selection of the three primary indicators and 15 secondary indicators initially established the light pollution risk level evaluation system, and strive to build a more complete light pollution prevention and control, detection and monitoring of the barrier.
Secondly, zoning rules have become a fundamental element in the establishment of environmental planning. Although current research shows that the zoning approach cannot be the ultimate means of controlling environmental pollution, it provides favorable conditions for local optimization of governance and zoning to develop appropriate and effective laws and regulations for preventing and controlling environmental pollution. In this paper, we apply the established risk level evaluation model based on the zoning rules to the four types of land in Beijing, China: protected land, Rural Areas, Suburban Areas and Urban Communities. The model is substituted into the land data to derive the light pollution prevention and control levels and comprehensive index scores of the four land types, and according to the principle that the lower the index score, the higher the pollution risk level, the pollution risks of the four locations are, from low to high, as follows: protected land location (0.834), rural communities (0.690), suburban communities (0.488), urban communities (0.167), and the evaluation results of the four lands were statistically tested using one-way ANOVA to enhance the reliability and confidence of the evaluation results.
Finally, based on the Random Forest algorithm, this paper takes the top three variables of feature importance weight ranking Street Light Brightness (SLB), Lighting Hour (LH), and Energy Cost (EC) as the decision variables, and adopts the nonlinear optimization algorithm to establish the objective function, aiming at the minimum of the total sum of the price cost and the social cost, to achieve the maximum reduction of the light pollution level. Based on this, three specific possible light pollution solutions are proposed for urban communities with the highest pollution risk levels. These include establishing lighting eco-safety standards, reducing non-essential lighting hours, adjusting urban nighttime lighting design, and implementing scientifically sound light distribution, strategies designed to promote the healthy and sustainable development of urban nighttime lighting.
4.2 Prospect
In recent years, with the increasingly serious problem of light pollution at night in cities, the problem of ecological light pollution has also surfaced, and the range of species disturbed by light pollution is also getting wider and wider, and the ecosystems from the air to the land to the water are all likely to be affected by light pollution, and the hazards of light pollution to the global ecosystem should not be ignored, but there is no uniform standard in the global light pollution prevention and control technology, and the existing light pollution technology existing light pollution regulations and technical guidelines mainly focus on the limitation of brightness and illuminance from the perspective of lighting design. Therefore, it is necessary to establish a light pollution risk evaluation system as well as measurable technical indicators from the perspective of protecting the ecosystem, so as to establish quantitative standards and guidelines for the universal monitoring and prevention of nighttime sky pollution. The evaluation system of light pollution should be further deepened, tested and improved through demonstration projects, and the research results should be used as part of the environmental monitoring system and norms, so as to make positive theoretical discussions for the establishment of global standards and regulations for light pollution prevention and control.
Data availability statement
The original contributions presented in the study are included in the article/Supplementary Material, further inquiries can be directed to the corresponding author.
Author contributions
Z-HZ: writing, software, review and editing, and visualization. H-LC: resources, data curation, and writing—original draft preparation. T-YF: conceptualization, methodology, software, and validation. J-MZ: conceptualization, methodology, software, and validation. All authors contributed to the article and approved the submitted version.
Conflict of interest
The authors declare that the research was conducted in the absence of any commercial or financial relationships that could be construed as a potential conflict of interest.
Publisher’s note
All claims expressed in this article are solely those of the authors and do not necessarily represent those of their affiliated organizations, or those of the publisher, the editors and the reviewers. Any product that may be evaluated in this article, or claim that may be made by its manufacturer, is not guaranteed or endorsed by the publisher.
References
Aksaker, N., Yerli, S. K., Kurt, Z., Bayazit, M., Aktay, A., and Erdoğan, M. A. (2020). A case study of light pollution in France. Astrophys. Space Sci. 365, 153. doi:10.1007/s10509-020-03869-4
Argys, L. M., Averett, S. L., and Yang, M. (2021). Light pollution, sleep deprivation, and infant health at birth. South Econ. J. 87, 849–888. doi:10.1002/soej.12477
Cao, M., Xu, T., and Yin, D. (2023). Understanding light pollution: recent advances on its health threats and regulations. J. Environ. Sci. 127, 589–602. doi:10.1016/j.jes.2022.06.020
Cinzano, P., and Falchi, F. (2014). Quantifying light pollution. J. Quantitative Spectrosc. Radiat. Transf. 139, 13–20. doi:10.1016/j.jqsrt.2013.11.020
Cupertino, M. D. C., Guimarães, B. T., Pimenta, J. F. G., Almeida, L. V. L. D., Santana, L. N., Ribeiro, T. A., et al. (2023). Light pollution: A systematic review about the impacts of artificial light on human health. Biol. Rhythm Res. 54, 263–275. doi:10.1080/09291016.2022.2151763
Esposito, T., and Radetsky, L. C. (2023). Specifying non-white light sources in outdoor applications to reduce light pollution. LEUKOS 19, 269–293. doi:10.1080/15502724.2022.2121285
Gaston, K. J., Bennie, J., Davies, T. W., and Hopkins, J. (2013). The ecological impacts of nighttime light pollution: a mechanistic appraisal: nighttime light pollution. Biol. Rev. 88, 912–927. doi:10.1111/brv.12036
Guan, Q., Wang, Z., Cao, J., Dong, Y., and Chen, Y. (2022). The role of light pollution in mammalian metabolic homeostasis and its potential interventions: A critical review. Environ. Pollut. 312, 120045. doi:10.1016/j.envpol.2022.120045
Guanglei, W., Ngarambe, J., and Kim, G. (2019). A comparative study on current outdoor lighting policies in China and korea: A step toward a sustainable nighttime environment. Sustainability 11, 3989. doi:10.3390/su11143989
Han, P., Huang, J., Li, R., Wang, L., Hu, Y., Wang, J., et al. (2014). Monitoring trends in light pollution in China based on nighttime satellite imagery. Remote Sens. 6, 5541–5558. doi:10.3390/rs6065541
Jiang, W., He, G., Long, T., Guo, H., Yin, R., Leng, W., et al. (2018). Potentiality of using luojia 1-01 nighttime light imagery to investigate artificial light pollution. Sensors 18, 2900. doi:10.3390/s18092900
Jiang, W., He, G., Long, T., Wang, C., Ni, Y., and Ma, R. (2017a). Assessing light pollution in China based on nighttime light imagery. Remote Sens. 9, 135. doi:10.3390/rs9020135
Jiang, W., He, G., Long, T., Wang, C., Ni, Y., and Ma, R. (2017b). Assessing light pollution in China based on nighttime light imagery. Remote Sens. 9, 135. doi:10.3390/rs9020135
Jing Zhu, J. Z., Jing Zhu, S. H., Song Huang, Y. S., Yaqing Shi, K. W., and Kaishun Wu, Y. W. (2022). An algorithm combining random forest classification and fuzzy comprehensive evaluation. J. Internet Technol. 23, 735–747. doi:10.53106/160792642022072304009
Kocifaj, M. A. (2011). Numerical experiment on light pollution from distant sources: light pollution from distant sources. Mon. Notices R. Astronomical Soc. 415, 3609–3615. doi:10.1111/j.1365-2966.2011.18977.x
Kocifaj, M., Solano-Lamphar, H. A., and Videen, G. (2019). Night-sky radiometry can revolutionize the characterization of light-pollution sources globally. Proc. Natl. Acad. Sci. U.S.A. 116, 7712–7717. doi:10.1073/pnas.1900153116
Kolláth, Z., Dömény, A., Kolláth, K., and Nagy, B. (2016). Qualifying lighting remodelling in a Hungarian city based on light pollution effects. J. Quantitative Spectrosc. Radiat. Transf. 181, 46–51. doi:10.1016/j.jqsrt.2016.02.025
Levin, N., and Duke, Y. (2012). High spatial resolution night-time light images for demographic and socio-economic studies. Remote Sens. Environ. 119, 1–10. doi:10.1016/j.rse.2011.12.005
Lian, X., Jiao, L., Zhong, J., Jia, Q., Liu, J., and Liu, Z. (2021). Artificial light pollution inhibits plant phenology advance induced by climate warming. Environ. Pollut. 291, 118110. doi:10.1016/j.envpol.2021.118110
Lim, H., Ngarambe, J., Kim, J., and Kim, G. (2018). The reality of light pollution: A field survey for the determination of lighting environmental management zones in South Korea. Sustainability 10, 374. doi:10.3390/su10020374
Luarte, T., Bonta, C. C., Silva-Rodriguez, E. A., Quijón, P. A., Miranda, C., Farias, A. A., et al. (2016). Light pollution reduces activity, food consumption and growth rates in a sandy beach invertebrate. Environ. Pollut. 218, 1147–1153. doi:10.1016/j.envpol.2016.08.068
Macgregor, C. J., Pocock, M. J. O., Fox, R., and Evans, D. M. (2015). Pollination by nocturnal L epidoptera, and the effects of light pollution: A review. Ecol. Entomol. 40, 187–198. doi:10.1111/een.12174
Mishina, Y., Murata, R., Yamauchi, Y., Yamashita, T., and Fujiyoshi, H. (2015). Boosted random forest. IEICE Trans. Inf. Syst. E98, 1630–1636. doi:10.1587/transinf.2014opp0004
Neri, L., Coscieme, L., Giannetti, B. F., and Pulselli, F. M. (2018). Imputing missing data in non-renewable empower time series from night-time lights observations. Ecol. Indic. 84, 106–118. doi:10.1016/j.ecolind.2017.08.040
Ngarambe, J., and Kim, G. (2018). Sustainable lighting policies: the contribution of advertisement and decorative lighting to local light pollution in seoul, south Korea. Sustainability 10, 1007. doi:10.3390/su10041007
Ngarambe, J., Lim, H. S., and Kim, G. (2018). Light pollution: is there an environmental kuznets curve? Sustain. Cities Soc. 42, 337–343. doi:10.1016/j.scs.2018.07.018
Olsen, R. N., Gallaway, T., and Mitchell, D. (2014). Modelling US light pollution. J. Environ. Plan. Manag. 57, 883–903. doi:10.1080/09640568.2013.774268
Owens, A. C. S., Cochard, P., Durrant, J., Farnworth, B., Perkin, E. K., and Seymoure, B. (2020). Light pollution is a driver of insect declines. Biol. Conserv. 241, 108259. doi:10.1016/j.biocon.2019.108259
Peña-García, A., and Sędziwy, A. (2020). Optimizing lighting of rural roads and protected areas with white light: A compromise among light pollution, energy savings, and visibility. LEUKOS 16, 147–156. doi:10.1080/15502724.2019.1574138
Pichardo-Corpus, J. A., Solano Lamphar, H. A., Lopez-Farias, R., and Delgadillo Ruiz, O. (2020). Spatio-temporal networks of light pollution. J. Quantitative Spectrosc. Radiat. Transf. 253, 107068. doi:10.1016/j.jqsrt.2020.107068
Saraiji, R., and Oommen, M. S. (2012). Light pollution index (LPI): an integrated approach to study light pollution with street lighting and façade lighting. LEUKOS 9, 127–145. doi:10.1582/leukos.2012.09.02.004
Schonlau, M., and Zou, R. Y. (2020). The random forest algorithm for statistical learning. Stata J. 20, 3–29. doi:10.1177/1536867x20909688
Ściężor, T., Kubala, M., and Kaszowski, W. (2012). Light pollution of the mountain areas in Poland/zanieczyszczenie świetlne W obszarach górskich W polsce. Archives Environ. Prot. 38. doi:10.2478/v10265-012-0042-4
Tähkämö, L., Partonen, T., and Pesonen, A.-K. (2019). Systematic review of light exposure impact on human circadian rhythm. Chronobiology Int. 36, 151–170. doi:10.1080/07420528.2018.1527773
Xiang, W., and Tan, M. (2017). Changes in light pollution and the causing factors in China’s protected areas, 1992–2012. Remote Sens. 9, 1026. doi:10.3390/rs9101026
Keywords: light pollution control, TOPSIS evaluation, single factor analysis of variance, non-linear programming models, optimization algorithms, SLSQP method
Citation: Zhou Z-H, Cao H-L, Feng T-Y and Zhu J-M (2023) Optimization algorithms for light pollution management based on TOPSIS-non-linear regularization model. Front. Energy Res. 11:1242010. doi: 10.3389/fenrg.2023.1242010
Received: 18 June 2023; Accepted: 13 September 2023;
Published: 06 October 2023.
Edited by:
Chao Su, China Jiliang University, ChinaReviewed by:
Songtao Li, North China Electric Power University, ChinaQing Xia, Changsha University of Science and Technology, China
Copyright © 2023 Zhou, Cao, Feng and Zhu. This is an open-access article distributed under the terms of the Creative Commons Attribution License (CC BY). The use, distribution or reproduction in other forums is permitted, provided the original author(s) and the copyright owner(s) are credited and that the original publication in this journal is cited, in accordance with accepted academic practice. No use, distribution or reproduction is permitted which does not comply with these terms.
*Correspondence: Jia-Ming Zhu, emh1am0xOTczQDE2My5jb20=
†These authors have contributed equally to this work and share first authorship