 Mbanda L. Njoke
 Zhongqun Wu1,2
 Hermas Abudu
94% of researchers rate our articles as excellent or good
Learn more about the work of our research integrity team to safeguard the quality of each article we publish.
Find out more
ORIGINAL RESEARCH article
Front. Energy Res., 31 July 2023
Sec. Solar Energy
Volume 11 - 2023 | https://doi.org/10.3389/fenrg.2023.1238112
This article is part of the Research TopicTowards 2030: A Solar Energy Perspective on Achieving Sustainable Development Goal 7View all 5 articles
With less than a decade remaining until 2030, global investment in clean energy access falls short of the anticipated levels required to achieve the sustainable development goals. Notably, nations with the greatest gaps in electricity access, particularly those in Sub-Saharan Africa, have been largely excluded from energy access funding. Interestingly, the energy sector policy documents of these countries have neglected to incorporate financing strategies or plans for photovoltaic (PV) power generation. This discrepancy in the literature underscores the need to assess the economic impact of finance and investment policies that align with long-term PV power generation targets. To address this gap, our study employs a dynamic Computable General Equilibrium model to evaluate the macroeconomic consequences of achieving Cameroon’s Nationally Determined Contributions for PV power generation through optimized PV investment and finance. The model examines three policy scenarios: the Business-as-Usual, SC1 scenario involving a stable 100% increase in PV investment, and SC2 scenario featuring a stepwise 5%–100% increase in PV investment. By simulating these scenarios, we aim to shed light on their effects. The results reveal that SC1 and SC2 exhibit a 50% higher final demand for PV investment compared to the BAU scenario. Optimizing PV finance and investment in both scenarios leads to a slowdown in Cameroon’s economic growth, with SC1 showing a more pronounced impact. Additionally, SC2 encourages rapid decarbonization in energy-intensive sectors such as crude oil production and electricity generation industries. However, the SC1 policy scenario results in a rapid reduction in total investment expenditure for PV power generation. By 2035, PV power generation is projected to be three times higher in both SC1 and SC2 compared to the BAU scenario. The SC2 policy scenario also predicts relatively high levels of consumption among rural affluent and urban impoverished households. In conclusion, our study highlights the pressing need for enhanced investment and finance strategies to propel PV power generation, particularly in underserved regions. By leveraging the findings of this research, policymakers can make informed decisions and implement policies that promote sustainable and inclusive energy access, driving progress towards the fulfillment of SDGs.
In recent history, energy use in developing countries has risen more than fourfold and is expected to continue increasing rapidly in the future (IEA, 2021). African countries have about one-fifth of the world`s total population and account for less than 4% of global carbon emissions, however, the continent disproportionately suffers the most from the negative effects of climate change including: insufficient rainfalls, droughts, famine, and extreme temperatures (IEA, 2022; Olabi and Abdelkareem, 2022). Today, the challenge lies in finding ways of achieving sustainable development goals (SDGs) devoid of building carbon-intensive economies.
The SDGs are a set of 17 global goals adopted by the United Nations in 2015 as a universal call to action to end poverty, protect the planet, and ensure prosperity for all. These goals encompass a wide range of interconnected social, economic, and environmental objectives, aiming to achieve sustainable development by 2030 (Sachs et al., 2019). Among the SDGs, Goal 7 specifically addresses energy, known as the Energy SDG. Its target is to ensure access to affordable, reliable, sustainable, and modern energy for all. The Energy SDG recognizes the fundamental role of energy in eradicating poverty, improving healthcare and education, supporting economic growth, and mitigating climate change. Moreover, the pressure on global energy resources is high, therefore most countries adopt the best measures that will enhance the utility of the available energy resources, increase the efficiency of the energy network and implement policies that encourage the development of renewable energy resources. In the context of Cameroon, the Energy SDG is highly relevant due to the country’s energy challenges and development needs. While Cameroon has made progress in expanding energy access, significant disparities persist, particularly in rural areas. Many communities still lack reliable and affordable electricity, relying on traditional biomass for cooking and heating, which has adverse health and environmental consequences. To address these issues, Cameroon has committed to implementing sustainable energy strategies aligned with the SDGs. The government has recognized the importance of diversifying its energy mix, promoting renewable energy sources, and improving energy efficiency. These efforts contribute not only to achieving the Energy SDG but also to advancing other interconnected goals, such as poverty reduction, education, and climate action.
Similarly, Cameroon’s plans of becoming an emergent nation at horizon 2035 are based on the effective mobilization of all its energy resources (Muh et al., 2018; MINEPAT, 2020). Importantly, energy supply will play a central role in the drive to end poverty, improve economic growth as well as tackle the effects of environmental degradation. Among all renewable energy sources, solar energy is currently the most widely used across countries and regions (Kabir et al., 2018; Kapica et al., 2021). Solar energy is an inexhaustible energy type derived from the Sun, which represents a clean energy option to satisfy pressing energy demands while simultaneously mitigating pollution and climate change effects (Dincer, 2000; Belessiotis and Papanicolaou, 2012). Therefore, it has wide and far-reaching significance most especially when used as solar photovoltaics (PV) for power generation. Several countries have utilized solar PV to expand off-grid electrification coverage, most especially for remote areas or strengthen the electricity supply of the grid network system in densely populated urban cities (Okoye and Oranekwu-Okoye, 2018; Maka et al., 2021; Wu et al., 2022). Despite the numerous advantages of the utilization of solar PV technology notably: availability, cost-effectiveness, environmental and social benefits. Existing administrative, technical and economic barriers contribute to reducing investor’s motivation to develop PV power generation in Cameroon (Nfah and Ngundam, 2012; Njoh et al., 2019; Njoh et al., 2019; Wu et al., 2021). So far, almost 9.4 million inhabitants in Cameroon are still leaving without access to electricity and 80% of these people leave in rural areas. However, available finance and investment are usually directed toward the construction and installation of large-scale hydropower and thermal power stations, neglecting the development of decentralized solar PV plants which could power remote areas not connected to the national grid network.
Furthermore, the flow of finance and investment directed to PV power generation has been extremely low (Wu et al., 2021). There is an abyssal gap between the actual amount mobilized and the amount expected for the country to finance its energy projects needed to sustain the development of PV power generation by 2035. As a result, Cameroon has only completed about 1.1% of its solar PV electrification task over the past 10 years (Wu et al., 2021). According to Bergek et al. (2013), Zeng et al. (2017), Polzin et al. (2019), Sachs et al. (2019), and Li et al. (2021) one of the most significant barriers to the expansion of renewable energy technologies is the absence of capital. However, previous studies on the development of PV power generation have mostly investigated the; technical, administrative and economic barriers whereas limited attention has been given to addressing the gap of finance and investment which slows down the penetration of solar PV technology in the country (Kenfack et al., 2011; Nfah and Ngundam, 2012; Njoh et al., 2019; Njoh et al., 2019). Moreover, when mentioned in literature the financing and investment challenges for developing solar PV systems has been mistakenly associated as an economic barrier; which is usually deduced from cost and profit analysis of PV power systems. So far, neglecting to consider the deficit of finance and investment for PV power generation as entirely a different problem on its own. Therefore, this paper seeks to provide an extensive analysis of policy instruments and its implication for leveraging PV finance and investment in Cameroon. In addition, the macro-economic effects of PV finance and investment optimization policies are quantified using a dynamic recursive Computable General Equilibrium (CGE) model. The model is specifically modified to simulate changes from the equilibrium solution with time, it also accounts for carbon emissions per industrial sector, as well as incorporates intrinsic prices for consumer goods and services in Cameroon.
Therefore, the rest of this paper is arranged as follows: Section 2 presents an overview of Cameroon`s energy sector development, with emphasis on solar energy potential as well as the existing mechanisms of PV financing and investment. Section 3, gives details on the structure of the dynamic CGE model for Cameroon, as well as its application. In Section 4, the different policy scenarios for optimizing PV investment and finance are defined, while Section 5 provides the model simulation results and interpretation for each scenario. Finally, Section 6 provides the concluding remarks and insights for future works.
Historically, Cameroon is known to have a rich potential for energy resources varying from: hydropower, solar, biomass, crude oil and natural gas, wind and geothermal energy which are still to be fully harnessed (Abanda, 2012; MINEE, 2015; Wirba et al., 2015; Tamba et al., 2017; Muh et al., 2018; Lea and Ndjinang, 2019; Muh and Tabet, 2019; Kidmo et al., 2021). Despite its energy resource potential the country`s power sector still faces persistent challenges related to: satisfying the national demand and supply of electric power for residential, commercial and industrial users (Kenfack et al., 2011; Amadu and Samuel, 2020). According to a report from MINEE (2014), chronic power failures lead to a 5% yearly deduction in the country`s GDP growth rate. As shown in Table 1, the average annual population growth rate in Cameroon was 2.72% over the period 2008–2019. The country registered a cumulative GDP growth of 45.37% and the total primary energy supply increased by 4.23% annually. Though the domestic electricity generation and installation capacity declined respectively by 1.24% and 9.01% in 2019, its cumulative growth rate reached approximately: 43.54% and 53.43%. Over the last decade, total carbon emissions in Cameroon increased at an average annual rate of 3.96% principally from: crude oil production, agriculture, electricity and heat generation industries.
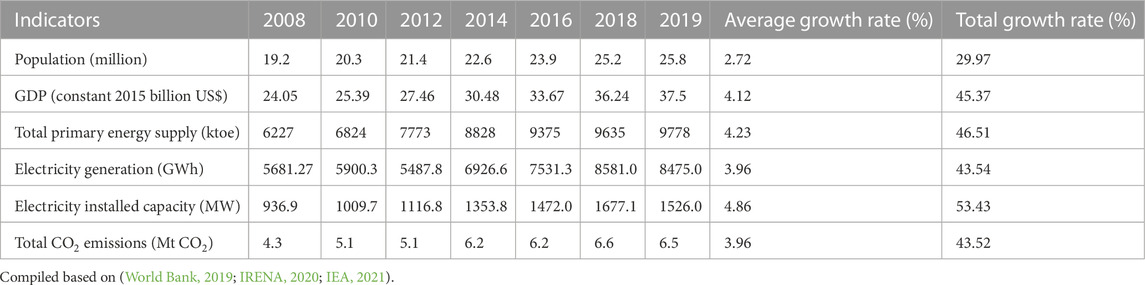
TABLE 1. Key indicators of Cameroon`s energy sector from 2008 to 2019.
Similarly, the government has implemented support mechanisms and policies, to encourage the uptake of clean power generation technologies and indirectly incite private sector participation in financing solar PV. So far, the main instrument commonly used to support investment and finance for PV power generation were; tax subsidies and direct loans. The government subsidizes up to 80% of feasibility studies and provides up to 70% of investment for rural energy projects. On the whole, the bulk of investment in solar PV power generation projects came from the government, whose financing mechanisms, notably through fiscal expenditure, finance from current revenue, or debt, tend to be insufficient. It is mostly directed at financing the maintenance and operation of small-scale PV power infrastructures, with little remaining to fund medium to large-scale electric power generation projects and solve power supply issues. By the end of 2019, the accumulated funds from the government or public investment sources amounted to $2.02 million, accounting for 0.65% of the total investment in PV power generation. As a result, the government drafted different energy sector development plans to indicate national policies for: the rehabilitation of the power sector, integration of renewable energy technology and mitigation of climate change effects (see Table 2). The most important strategy documents for the energy sector in Cameroon have been the: Vision 2035 and the Growth and Employment Strategy Document (DSCE 2010–2020) (MINEPAT, 2009). Before, the establishment of these strategy policy documents: the Master Plan for Rural Electrification (PDER) of 2001 and the Electricity Sector Development Plan for 2030 (PDSE 2030) enacted in 2006 were the only existing plans used by the government to implement its national policies for the energy sector.
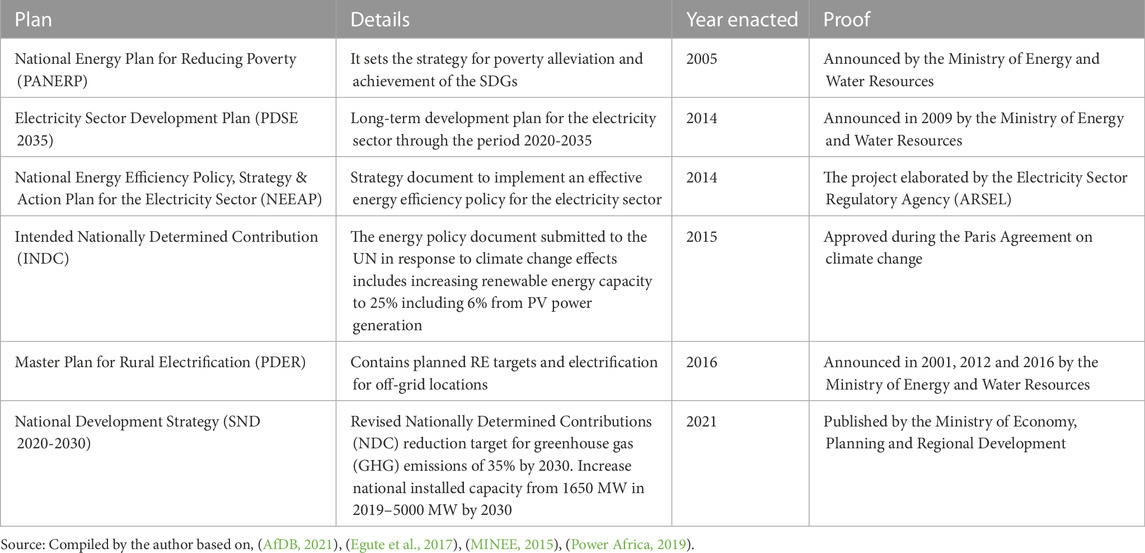
TABLE 2. Key policy documents for Cameroon`s energy sector.
In general, the energy sector policy documents outline clear objectives for both the short and long term, covering the period from 2020 to 2035. According to Table 3, Cameroon aims to attain universal access to electricity by 2035 by connecting an additional 50,000 homes and small businesses each year. Furthermore, the country targets a renewable energy capacity of 25% in the national power mix, with solar PV accounting for 6% of the total renewable power generated by 2035 (refer to Table 3).
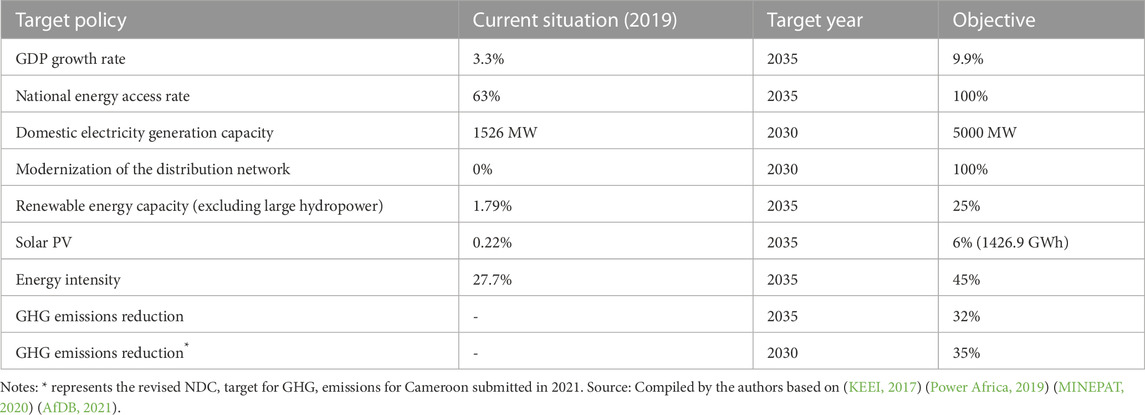
TABLE 3. Cameroon`s long-term energy policy targets.
However, the main policy documents for Cameroon`s energy sector have all omitted to associate financing strategies or plans for PV power generation. Although the long-term plan for sustainable energy development in Cameroon contains a key strategy to encourage PV electricity production, it is not made clear which department is in charge of promoting the use of renewable energy sources in general and PV electricity in particular. In addition to having less incentives, Cameroon’s government support is frequently minimal and nonspecific. The availability of direct government subsidies for fossil fuels tends to deter investors from investing in the development of solar PV. Together, these variables make it challenging for project developers to effectively predict the risks and benefits of projects early on, which significantly reduces their ability to secure foreign funding (Kidmo et al., 2021; Wu et al., 2021). There is an existent gap in the literature, on how to attract finance and investment to match the 6% PV power generation target. Therefore, the rapid deployment of solar PV will necessitate a review of the relevant national plans and policies guiding the energy sector in Cameroon. Also, a strategy for the mobilization of significant investments and finance from: public, private and international channels required to reach this target needs to be established.
Cameroon`s strategic geographical position at the center of the Gulf of Guinea makes the country enjoy acceptable solar radiation intensities all through the year. On average, the country receives about 3,000 h of mean annual hours of sunshine per year and has an average solar radiation intensity estimated at 240 W/m2 (Solarplaza, 2016; SOLARGIS, 2021). According to Wu et al. (2021), if about 0.02% of this solar energy potential could be converted into electric energy then it can help lower the power supply deficit in the country. Similar to other countries in this region, it has enormous solar energy resources from which electricity could be generated. The average solar radiation potential in the country ranges from 4.2 kWh/kWp in the southern region to about 5.0 kWh/kWp in the northern regions (Abanda, 2012; Muh et al., 2018). Therefore, conditions seem to be ideal throughout the country for the exploitation of solar energy resources through various conversion technologies including solar PV. Moreover, PV power generation systems represent an opportunity for Cameroon to close the existing electricity supply deficit most especially for remote areas not connected to the grid network.
Nowadays, solar PV is the most extensively used renewable energy technology for installing distributed power generation systems in Cameroon (Power Africa, 2019). It is used simultaneously in residential, industrial and commercial sectors to power: households, cellular telecommunication infrastructure, businesses, street lighting, solar pumps, phones and other household appliances. Compared to other power generation systems such as: diesel generators or gas powered plants which are expensive to run and emit greenhouse gases that cause adverse effects on the environment. Solar PV mini-grid and off-grid systems provide a cost-effective, clean and reliable means of generating electricity both in urban and remote areas. However, only about 14.4 MW of PV power has been installed on the national territory over the last decade. As shown in Table 4, electric power from solar PV installations increased from 0.275 GWh in 2008 to 19.67 GWh in 2022 which corresponds to only 0.22% of total electricity generated annually. Therefore, current PV power generation is over 96 times lower than the expected 6% national target for 2035. Moreover, about 79.4% of solar PV installations are mini-grid or hybrid systems and the remaining 20.6% are mainly: small solar home systems, and solar pumps.
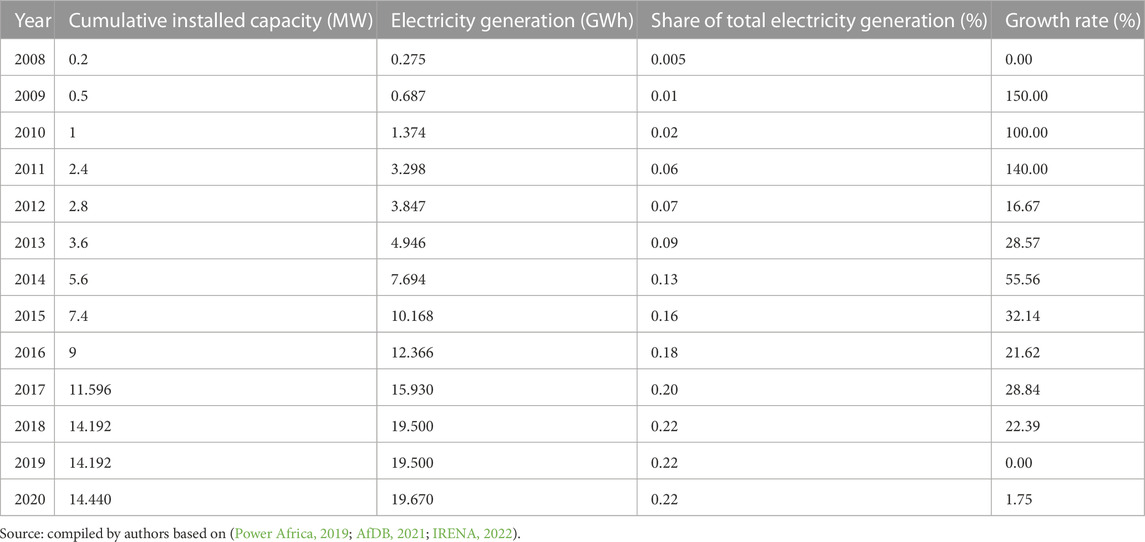
TABLE 4. Solar PV installation and generation capacity in Cameroon from 2008 to 2020.
So far, several large-scale PV power generation projects are at different stages of development. One reason for this is the failure to gather the right form of capital needed to complete each project stage including: conceptualization, appraisal, construction and PV plant operation. Hence, it is essential to create conducive conditions that minimize risk exposure for potential investors and will help attract different sources of finance and investment for PV power generation.
According to reports from APRI (2022) and Mungai et al. (2022), between 2020 and 2030 African countries will need around US$ 2.5 trillion yearly to carry out their NDC targets. On one hand, the wealthier economies have committed to double the financial support given to less developed countries for climate change mitigation and adaptation by 2025. However, current annual climate finance inflows to the continent sum up to about US$ 30 billion which is equivalent to only 12% of the global amount needed annually. Furthermore, most country-specific studies have focused on investigating the different policy instruments used for financing PV power generation, neglecting to model the annual flow and sources of finance and investment needed for specific RE technologies (Elie et al., 2021; Polzin et al., 2021).
This paper presents a classification of three primary modes of financing for PV power generation: public financing, domestic market financing, and international funding. Each of these modes employs distinct instruments to mobilize the capital resources required for various aspects of PV power generation, including research, manufacturing, and construction of PV plants. According to Li et al. (2021) depending on the: geographical location, project maturity, or size the amount of investment mobilized by each investor will be different. One critical aspect of solar PV investment is the presence of supportive policy and regulatory frameworks. Numerous studies emphasize the importance of effective mechanisms such as feed-in tariffs (FiTs), power purchase agreements (PPAs), and net metering policies (Elie et al., 2021). These policy instruments provide long-term contracts, incentivize solar PV deployment, ensure a fair return on investment, and mitigate investment risks. Access to financing is a major challenge for solar PV projects, especially in developing countries. Financial institutions may perceive solar PV investments as high-risk due to concerns about project viability and regulatory uncertainties (Zeng et al., 2017; Kabir et al., 2018). Studies suggest that innovative financing mechanisms like green bonds (Li et al., 2021) and crowdfunding (Polzin et al., 2021) would mobilize capital and attract private investment by leveraging public participation and community engagement. Solar PV investments are influenced by market dynamics, economic conditions, and the cost competitiveness of alternative energy sources. The declining costs of solar PV technology have improved its competitiveness (Okoye and Oranekwu-Okoye, 2018), while macroeconomic indicators, such as; interest rates, inflation, and exchange rates, can impact investment decisions (Kimuli et al., 2022). According to studies, analysis of the economics of PV power generation, including levelized cost of electricity (LCOE) calculations, cost reduction trends, and factors influencing PV system costs have been examined and found that the cost are falling rapidly (Polzin et al., 2019; Maka et al., 2021). That is, review of economic models and frameworks for evaluating the financial viability of PV projects, considering factors like financing options, subsidies, and return on investment (ROI) have been invested in other countries including China, the US and European countries (Dincer, 2000; Xiao et al., 2015; Kimuli et al., 2022). Moreover, to tackle environmental problems and expand the PV power generation capacity advanced economies such as: the US and China have fully utilized all the different financing instruments from each source of finance (Elie et al., 2021). Therefore, it is crucial to investigate the instruments used by different actors for financing PV power generation in Cameroon. The government mostly utilizes: government direct investments, public-private partnerships (PPP) and government loans or grants to finance early-stage PV installation projects for rural areas. For the private sector, two channels of PV financing are commonly used: direct and indirect financing for the construction of large-scale PV plants. However, international financing is obtained through foreign direct investments (FDI), climate bonds and security insurance. In the last decade, a total of about $337.86 billion was invested in the construction of small to medium-scale PV plants within the country (Wu et al., 2021). As shown in Table 5, public-private partnership (PPP) was used to mobilize almost more than 67.86% and the government grants 0.47% of total public finance and investment.
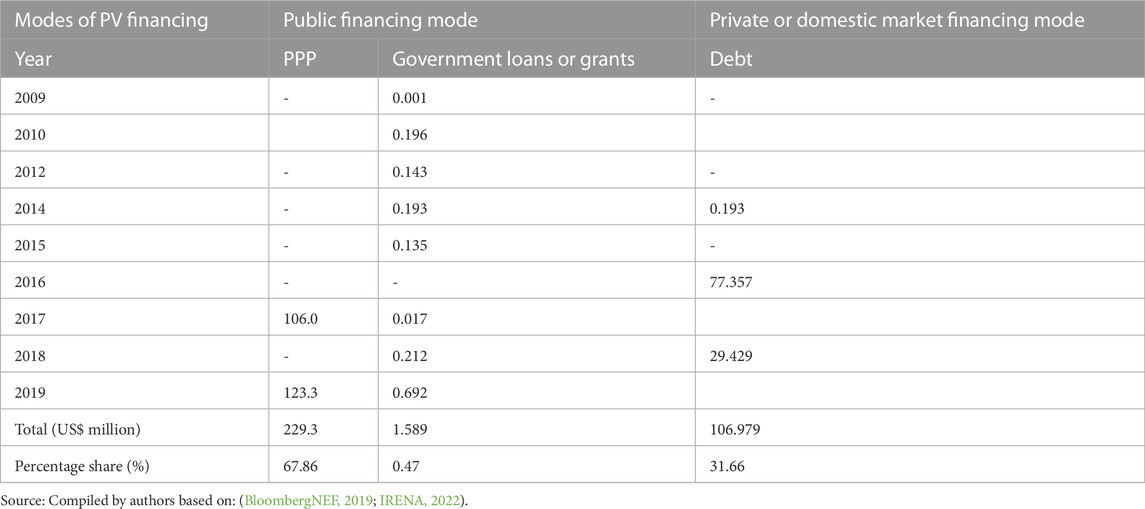
TABLE 5. Public and private investments in solar PV in Cameroon from 2009 to 2019.
Compared to other countries in Sub-Saharan Africa, only about $106.97 million was utilized as debt finance to develop large-scale solar PV projects in Cameroon. Currently, the country’s yearly GDP is predicted to be barely above $38.7 billion (World Bank, 2019). Based on these factors, a reasonable level of funding in the solar power sector in Cameroon should be at least $6.9 billion. So far, policy instruments usually used in other countries to facilitate financing and investment in solar PV are; i) Feed-in Tariffs (FiT) policies establish a guaranteed price for solar PV-generated electricity and provide long-term contracts to renewable energy producers. FiTs assure investors a stable and predictable revenue stream, reducing financial risks and attracting investment. ii) Investment incentives and tax benefits: governments can offer various incentives to encourage investment in solar PV, such as tax credits, accelerated depreciation, grants, or subsidies. iii) Net Metering and Feed-in Premiums: net metering allows solar PV system owners to sell excess electricity back to the grid, receiving credits or payments for the surplus energy produced. iv) Renewable Portfolio Standards (RPS): governments can establish RPS or set specific renewable energy targets, requiring utilities to procure a certain percentage of their electricity from renewable sources. v) Green Bonds and Financing Mechanisms: governments can establish frameworks to promote the issuance of green bonds, which are dedicated to financing environmentally friendly projects, including solar PV installations. Therefore, Cameroon needs to adopt efficient policy instruments which can cover early-stage project risks in the development of solar PV, and help generate sufficient financial flows from the private sector.
A computable general equilibrium (CGE) model is an economic modeling tool that encompasses the comprehensive network of interactions and feedback effects between different agents within an economic system. This model utilizes equations derived from economic theory to simulate a market economy, where the quantities and prices of goods, as well as other relevant parameters, dynamically adjust to achieve equilibrium between supply and demand. By capturing these complex relationships, a CGE model provides a holistic representation of an economic system and enables analysis of the impacts of various policy changes and external shocks (Burfisher, 2021). Over the years, CGE models have been commonly used by scholars to assess, the impact of different policies on the economy including: tax reforms, emission reduction and energy security targets (Fujimori et al., 2014; Xiao et al., 2015; Dai et al., 2018; Jia and Lin, 2022; Kimuli et al., 2022). In the early 1990s, CGE modeling was widely employed for the examination of environmental policy, tax reforms and natural resource management challenges (Decaluwé and Martens, 1988). The pioneer CGE model was built by Johansen (Johansen, 1960) to provide policy analysis for growth in the multiple industrial sectors of the Norwegian economy. Shoven and Whalley (Shoven and Whalley, 1972), applied a CGE model for policy concerns in the US related to: public finance, international trade and environmental policy. A CGE model is a suitable replacement for an analytical general equilibrium model whenever its size and complexity-measured in terms of the number of households and production sectors or existing taxes and other distortions make it mathematically infeasible (Kimuli et al., 2022). Recently, CGE models became more efficient tools for simulating how market economies function when countries abandoned central planning and shifted to more market-based economies with less direct government participation in production and investment decisions (Burfisher, 2021).
The main factors influencing the financial system’s evolution in Cameroon are the economic players’ strategies; differing ideas about the conduct of these individuals lead to vastly diverse development pathways for model economies (Burfisher, 2021; Kimuli et al., 2022). Therefore, the hypothesized approaches of the players should be explicitly stated in economic models as a whole and a comprehensive model of assessment in particular. As a result, the most efficient way for suggesting optimal PV financing and investment policies in Cameroon is to apply system dynamic modeling techniques which have a long-proven record in literature. Finally, scenario analysis is typically more relevant to policy assessment than prediction since decision-makers are interested in the prospective effects of the options they are considering. Scenario analysis, which focuses on monitored trials to examine the relationships between policies and effects, offers the pertinent structure to guide analysis in making decisions about policy options. For this reason, this paper uses a recursive dynamic CGE model involving multiple economic sectors to simulate the long-term impact of optimizing PV investment and finance on economic growth, emission mitigation and renewable power generation. The model is solved in the General Algebraic Modeling System (GAMS) using 2019 as the base year data. Moreover, the economic operations in this CGE model are divided into eight blocks including: the production block, income and saving block, energy-environment block, domestic output and import block, international trade block, national product, market clearing and dynamic relationships blocks. Also, aspects related to environmental constraints are introduced into the energy block to capture carbon emissions in the system. The model advances in time due to cumulative processes that are captured by dynamic equations. Figure 1 below, shows a structural framework for the application of the dynamic CGE model for Cameroon.
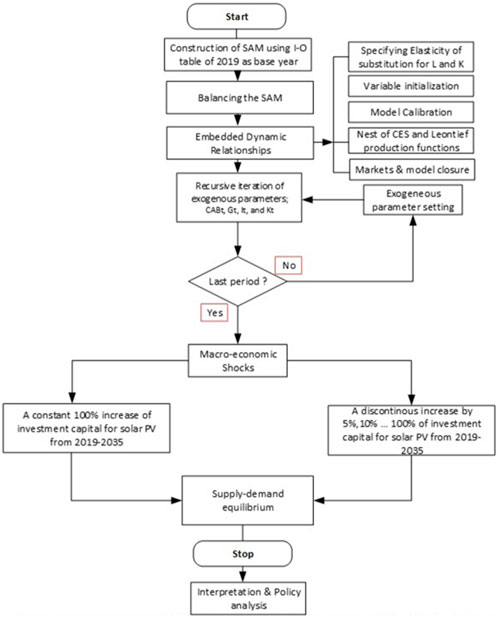
FIGURE 1. Structural framework of the dynamic CGE model.
As illustrated in Figure 1, the next section of this paper describes the step-wise procedure including; the construction of the data set (SAM), input data initialization, model calibration process, and the design of policy scenarios used in the multi-sector dynamic CGE model for Cameroon. This model mimics the impact of PV investment optimization policies on; economic growth, emission mitigation, PV supply and demand as well distinguish consumption from households and industries through the period 2019-2035.
Overall, the data used in building the Social Accounting Matrix (SAM) for the dynamic CGE model is based on Cameroon`s national accounts for the year 2019, respectively retrieved from the National Statistics Institute (INS, 2018) and the African Development Bank Statistical Yearbook (UNECA et al., 2021). Additionally, the related components for this SAM were modified based on input-output (I-O) tables of previous studies on Cameroon by Cordon et al. (1987) and Rainer and Manfred (1993). In this study, the SAM is built from 40 industrial sectors as listed in the Cameroonian I-O table, however for research purpose these sectors are aggregated into 15 major industrial sectors used to model the Cameroonian economy (see Supplementary Material S1). The aggregated SAM provides an overview of most of the data needed to operationalize the CGE model. The SAM for Cameroon is built with rows and columns respectively representing the total receipts and outlays of economic agents, industrial activities, factors of production (labor and capital), commodities, exports, investment and inventory stock. In this SAM, each agent’s expenditure corresponds to the other agent’s total receipts after taking into account savings and dissaving. It shows the circular flow of national income using these identities. One can locate the incomes paid to the factors of production by economic activities, following them to household incomes which are disaggregated into: urban poor, rural poor, urban rich and rural rich households. Additionally, the factor of production labor is disaggregated into skilled and unskilled labor.
Due to the absence of import and export tariff data for Cameroon in the national statistics table, this data was retrieved from the database of the World Trade Organization (WTO). Moreover, our SAM includes data for four export products of key interest for international trade in Cameroon which are respectively: agricultural goods (cash crops), aluminum (mining), wood and petroleum products. The percentage of labor and capital income is derived using data from the National Institute of Statistics (INS) yearbook on different sources of income for rural and urban households. The share is added to the SAM to acquire various sorts of factor revenue from firms and the government. The total savings of urban and rural households are determined using data from the INS fourth national survey for households on: income, consumption, and population (INS, 2018).
Before the calibration stage, the model parameters are initialized using the base year input data for 2019 from the balanced SAM. Moreover, we present estimated values for model parameters and variables used in simulating the dynamic equilibrium solution. During simulation, some benchmark parameters such as; the values for the constant elasticity of substitution (CES) or the elasticity of transformation (CET) functions are initially kept at unity values in the benchmark solution and constantly modified to new exogenous variables and parameters in the equilibrium solution. The model variables are set to the base-year level to serve as a beginning in the search for a solution. Accordingly, the differential equations which describe each block in the dynamic CGE model were utilized to calculate the model’s internal variables’ baseline values. As a result, there is a one-to-one mapping between the model variables and the parameters that hold the initial values (see supplementary materials). Also, other model parameters such as the; input-output coefficient, energy input-output coefficient, Frisch parameters, price elasticity of indexed transfers and parameters are specified in matrix tables (see Supplementary Material S1). Finally, the utility function is Cobb-Douglas and the objective function is defined as private and public investment. Once a set of endogenous variable values has been discovered that simultaneously solves every equation, that solution will be deemed optimal.
The goal of the model calibration step is to confirm that the input data will be produced if the model is solved using just base year data as inputs. This is accomplished by using input data from the SAM to estimate shift and share parameter values for production and utility functions that are consistent with the base year data (Fujimori et al., 2014). Therefore, this procedure is performed so that the solutions from the different equations used can reproduce the initial equilibrium as reported in the base year. The outcomes of model simulations are then compared with those of the calibrated model solution, which serves as the benchmark equilibrium. Based on previous studies from: Cordon et al. (1987), Rainer and Manfred (1993) and Njinkeu (1996), we estimate model elasticity parameters that can represent the underlying data. The CGE model database, which depicts an economy in an initial equilibrium, the model’s production or utility functions, and the assumed elasticity parameters are the inputs to the calibration procedure. Also, other model parameters such as the: input-output coefficient, energy input-output coefficient, Frisch parameters, price elasticity of indexed transfers and parameters are specified following works from: Cordon et al. (1987) and Devarajan et al. (2013). Finally, the utility function is Cobb-Douglas and the objective function is defined as private and public investment. Once a set of endogenous variable values has been discovered that simultaneously solves every equation, that solution will be deemed optimal. The method relies on a benchmark data set to determine the initial state of equilibrium of the Cameroonian economy, and it solves the model parameter values from this equilibrium state. In this study, the benchmark data set is represented in the compiled SAM. The first step entails feeding the CGE model equations with values; all parameter and variable values are obtained from the SAM meanwhile the elasticity of substitution values is estimated from previous studies. Also, the price for units of commodities in the base year is used as the unit’s convention for each variable. All the unit of prices for exogenous variables are set at unity in the base year, so that the benchmark solution represents the actual state of the economy.
Furthermore, stochastic estimation was solely employed to estimate the values of the elasticity to take into consideration all of the equilibrium limits that are highlighted throughout the calibration procedure. Therefore, to establish the mathematical expressions described in the calibration process of this dynamic CGE model, the exogenous parameters and variables for the production and utility functions are estimated using data made available in the Cameroon SAM. All symbols are expressed with the superscript “o” to represent the initial equilibrium values for the related endogenous variables.
The standard calibration problem solved in the production block is the share parameters for; CES-value added and the CES-composite capital. The value added (
From the production block, the scale parameter of composite capital for value-added per industry will be given as;
Based on Eq. 4-15, the share parameter of composite capital per industry was solved as follows;
Therefore, having known estimated the values for the exogenous parameters, the CES parameter for value-added and composite capital will be derived as;
Under this section, the initial equilibrium values for the share and scale parameter for firms and government income are estimated as follows;
By integrating the different sources of income, we solve the initial equilibrium values for government incomes from; capital (k), households (h) and firms (f) as;
Moreover, the income and savings account for the row is solved from the equilibrium solution as;
And the current account balance (CAB) at time t, will be solved as;
By re-arranging (Eq. 4-46), the scale parameter for CES composite per industry j was solved as;
From, energy-environment block the value added of the electricity generation industry and the share parameter for CES composite labor was solved as;
By exploring data from the SAM, we estimate the scale coefficients and exogenous variables used for determining the different price indices. Moreover, all the prices are initially set at unity. Firstly, we estimate the coefficients for value-added per industry and the energy composite rental rate as; Where,
The initial equilibrium values for the price of energy and electricity demand per industry are respectively derived as;
Similarly, the initial equilibrium vector values for GDP deflator, CPI and investment index as expressed in Eqs 3-19–3-21 are solved following this principle.
Even though actual share parameters may later change as a result of model simulations, the calibrated shift and share parameters employed in the model are; the production and utility functions that always remain at their initial values. Furthermore, initial values were assigned to all variables from the Cameroon SAM. Given these initial values and the exogenous parameter values, we solve and get results for all other endogenous parameters used in the dynamic CGE model (see Supplementary Material S1).
This study examines three distinct policy scenarios for PV power generation in Cameroon from 2019 to 2035. The scenarios include the Business-as-Usual (BAU) scenario, the continuous or stable investment scenario (SC1), and the discontinuous investment scenario (SC2). Through simulations, the study reveals the diverse macroeconomic implications of these policies. In the BAU scenario, the model predicts that achieving the economic, social, environmental, and PV power generation targets is possible without additional policy intervention for scaling up PV investment and finance. The SC1 scenario assumes a constant annual increase of 100% in PV investment and finance, and the model simulates its impact on various aspects such as household and industry energy consumption, economic growth, and environmental pollution in Cameroon. In the SC2 scenario, the model introduces a discontinuous increase in PV investment and finance in Cameroon, alternating between different percentages from 5%, 10%–100%. This scenario assesses the effects of such variations on all components within the model. By exploring these policy scenarios and their implications, this study contributes to better understanding of the potential outcomes and impacts of different approaches to PV investment and finance in Cameroon.
In detail this dynamic CGE model for Cameroon makes the following assumptions: solar PV is considered to be the principal source of RE electricity (excluding hydropower) in the power mix with a generation capacity share of 1%. According to studies from: Njoh et al. (2019), Njoh et al. (2019) and Wu et al. (2021), solar PV remains the most commonly adopted renewable energy technology both at the micro-grid and off-grid scale in Cameroon`s power sector. Moreover, the annual growth rate of Cameroon`s GDP was about 4.0% in 2018, in this study GDP growth rate is set at 3.5% taking into consideration the recent impacts of COVID-19 on economic growth (IMF, 2022). Over the last 2 decades, the trend of the average population growth rate in Cameroon has been fairly equal to 2.65% and has been constant at 2.6% from 2017 to 2020 (World Bank, 2019). For this study, the population growth rate in the country is set to remain at a constant rate of 2.6% over the period 2019-2035. Also based on the International Monetary Fund (IMF) projections, the country`s interest rate is set at 4%, to embody all final demand structure scenarios for goods and services.
In this section, we present the findings of the dynamic CGE model simulations and examine the implications of optimizing PV investment and finance policies on the Cameroonian economy. The analysis covers the period from 2019 to 2035, focusing on key indicators such as the annual demand for PV investment and financing, economic growth rate, total investment expenditure, carbon emissions per industry, and solar PV consumption by households and industries. By evaluating these factors, we gain insights into the potential effects and outcomes of implementing PV investment and finance optimization policies in Cameroon.
Based on the dynamic CGE model, we simulated the demand and source for solar PV financing and investment in Cameroon over the period 2019–2035. As seen in Figure 2, simulation results show that total PV investment and finance will increase tremendously in both policy scenarios: SC1 and SC2 over the years. In 2035, PV investment in the BAU scenario will reach 571.01 billion Fcfa, while the value will increase to 1142.03 billion Fcfa both in the SC1 and SC2 scenarios. Though the value of PV investment and finance will be similar in both policy scenarios by 2035, PV finance and investment increase at a faster rate in the SC2 scenario as compared to the stable growth in SC1 and BAU scenarios. Therefore, this indicates an average annual growth rate of 6.82% in the SC2 scenario and 2.60% respectively in the BAU and SC1 scenarios.
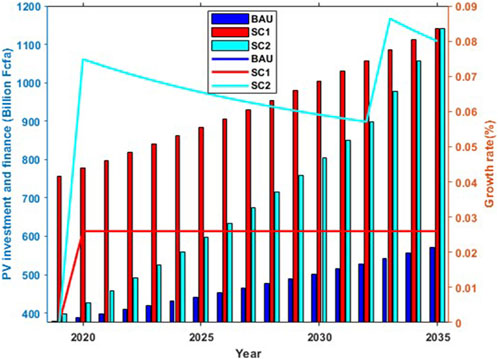
FIGURE 2. PV investment and financing scale respectively in: BAU, SC1 and SC2 policy scenarios.
Furthermore, the final investment demand from the private and public sector is deduced in each policy scenario. In SC1, the final demand for solar PV from private investors will represents 94.25% of total PV investment demand as compared to only 90.83% in the BAU scenario and 90.86% in the SC2 scenario. The final demand for public investment will be relatively lower respectively: 9.16% in BAU, 9.13% in SC1 and 9.14% in the SC2 policy scenario. Overall, private investment demand will increase over time in both optimization policy scenarios as compared to BAU situation, however the result denotes that total PV investment demand will be superior in SC1 than in SC2.
Rather than using the nominal Gross Domestic Product (GDP) formula, this study uses the CGE model to simulate changes in the country`s real GDP over the years. Real GDP has the advantage of being a more accurate indicator of economic development. The investment optimization policies for solar PV will all have different impacts on Cameroon`s economic development. As seen in Figure 3, from 2019 to 2035 real GDP will decline on average by 0.183% in the SC1 scenario and 0.013% in the SC2 scenario. Moreover, the fall in real GDP will increase through the years reaching respectively: 0.815% in SC1 and 0.484% in SC2 by 2035. Therefore, a stable increase in PV investment policy will have a sharply negative effect on the country`s GDP as compared to the implementation of an unsteady PV investment increment policy.
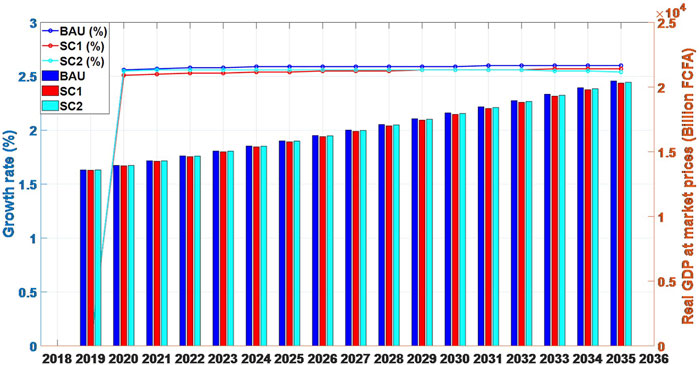
FIGURE 3. Real GDP for Cameroon in BAU, SC1 and SC2 policy scenarios.
Furthermore, comparing the average reduction rate in real GDP for both SC1 and SC2 policy scenarios relative to the BAU situation. It is observed that real GDP will decrease on average by −0.039% in SC1 as compared to only −0.028% in SC2. In the BAU scenario, the average growth rate of GDP is 2.44%, as compared to only 2.40% in the SC1 and 2.41% in the SC2 policy scenarios. As a result, a constant increase of PV finance and investment in SC1 will reduce Cameroon`s GDP growth over the period 2019–2035 by about 0.04% while the discontinuous increase of PV finance and investment in SC2 will decrease GDP growth by about 0.03%. Overall, the consequences of these two policies, particularly in the SC1 policy scenario, will be more significant at later stages of economic development than it will be at the early stages. The government will need to balance spending between maintaining economic growth and the achievement of the country`s climate change mitigation policies at the early stages of development.
Utilizing solar PV in Cameroon will mean additional costs both for the public and private sectors. As seen in Figure 4, total investment expenditure will increase in all three policy scenarios. However, the level and speed of increment will change over the years. From 2019 to 2035, the average PV investment expenditure will be 7470.25 billion Fcfa in the BAU scenario, 7461.54 billion in SC1 and 7469.53 billion Fcfa respectively in SC2 policy scenarios. The average growth rate of total investment expenditures will be 2.44% respectively in the BAU and SC2 scenarios as compared to only 2.42% in the SC1 policy scenario. By 2035, total investment expenditure in solar PV will reach 9098.89 billion Fcfa in BAU, which is respectively 0.27% and 0.06% higher than in SC1 and SC2.

FIGURE 4. Total investment expenditure for solar PV in BAU, SC1 and SC2 scenarios.
Thus, the results show that total investment expenditures will gradually decrease with time in SC1 and SC2 as compared to the BAU scenario. Over the initial 4 years of model simulation, on average total investment expenditure for solar PV will be 0.07% higher in SC1 and 0.01% in SC2 as compared to the BAU scenario. Overall, the increase of investment expenditure in both SC1 and SC2 scenarios is attributed to high initial installation cost for solar PV plants. The value will gradually reduce from 0.009% in 2023 to 0.272% in 2035 for the SC1 scenario. On the contrary, the total investment expenditure will dissipate after a longer period in SC2 from 0.006% in 2029 to 0.067% in 2035. Therefore, the government needs to simplify the permitting and regulatory processes associated with solar PV installations, which can reduce administrative burdens and costs for investors.
Using the dynamic CGE model, we simulate the effect optimal PV investment and financing scenarios will on reducing carbon emissions. The model depicts the total carbon emissions from each economic sector in Cameroon over the period 2019-2035. In the BAU scenario, total carbon emissions vary from: 0.000084 Mt of CO2 emissions in 2019 to about 0.000127989 Mt of CO2 emissions by 2035. The majority of carbon emissions will be from three industries respectively: 0.0000359 Mt from electricity generation, 0.00003106 Mt from crude oil production, and 0.0000210 Mt of CO2 for the agricultural sectors. This represents a growth rate of: 2.62%, 2.59% and 2.60% respectively in the agriculture, crude oil production and electricity generation industries. However, due to continous increase of PV investment embodied emissions from the agricultural industry will reduce on average by 0.31% in SC1 scenario and 0.06% in the SC2 scenario. As shown in Figure 5, carbon emissions will decrease by 1.12% in the transport (TRA) and 1.11% for the information & communication (INF) industries in the SC1 scenario. However, emissions will progressively increase respectively by: 0.54%, 0.22% and 0.30% in the mining, construction and manufacturing industries.
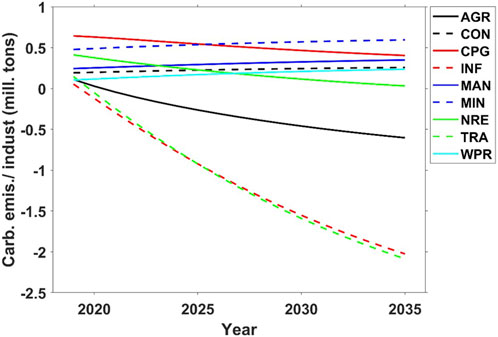
FIGURE 5. Percentage change of carbon emissions per industry in the SC1 scenario.
In the SC2 scenario, carbon emissions from the agriculture, crude oil production and electricity generation industries will have an average growth rate respectively of: 2.60%, 2.62% and 2.61%. Overall, the results show that the average percentage change of carbon emissions from the crude oil production and electricity generation industries will respectively be: 0.31% and 0.16% in the SC2 scenario as compared to: 0.51% and 0.19% in the SC1 scenario (see Figure 6). Therefore, emissions from crude oil production and heat generation could be easily dissipated in SC2 policy scenario.
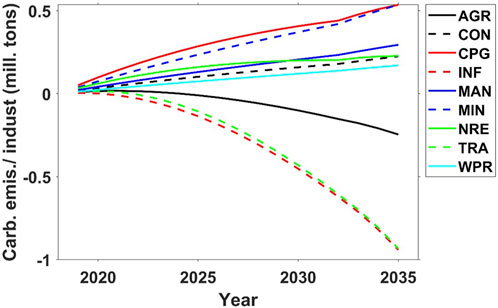
FIGURE 6. Percentage change of carbon emissions per industry in the SC2 scenario.
By 2035, heat and electricity generation industries will be the largest carbon emitters in the country contributing to 34.22% of total carbon emissions in all three policy scenarios. Therefore, the government will need to promote the issuance of green bonds as additional financing mechanism to attract investments in PV power generation. Overall, carbon emission intensity for several industries in Cameroon will respectively be curtailed after imposing PV investment optimization policies in SC1 and SC2. The economic sectors with the most appealing curtailment in carbon emissions as compared to the BAU situation will be the: transport and communication sectors. However, carbon emission abatements for heavy industries such as: mining, crude oil production, electricity generation, construction and manufacturing will be more pronounced in the SC2 scenario.
Generally, the substitution of fossil fuels for renewable energy technology notably solar PV is a slow process due to its high initial investment cost (Bergek et al., 2013; Elie et al., 2021). From 2019 to 2035, the electricity generated from solar PV will have an average growth rate respectively of: 2.60% in BAU, 2.58% in SC1 and 2.64% in SC2. The results show that increasing PV investment will trigger a positive effect on PV power generation, with a significant power supply in SC2 scenario. As shown in Figure 7, by 2035 the generation of electricity from solar PV will reach: 3,852.41 GWh in BAU, 3,873.82 GWh in SC1 and 3,879.14 in SC2 policy scenarios. Therefore, the supply of solar PV to the domestic market will increase rapidly in SC2 (0.69%) as compared to the SC1 (0.55%) scenario. By 2035, total PV power generation will make up respectively: 18.11% in SC1 and 18.10% in SC2 of the national electric power generation mix. This value is about 3 times higher than the initial 6% target, initially stated in Cameroon`s NDC.
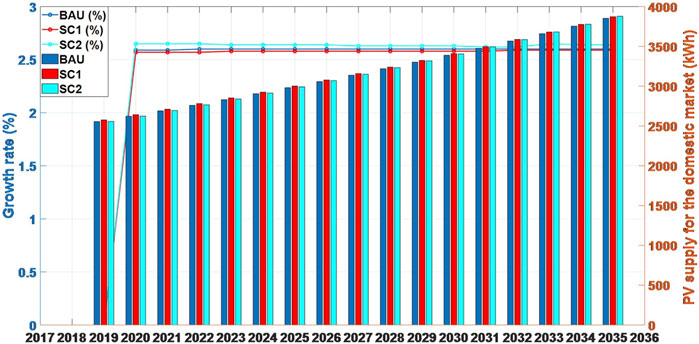
FIGURE 7. PV power supply in the BAU, SC1 and SC2 policy scenarios.
Furthermore, the consumption level of solar PV through the years by different household categories in Cameroon will differ over the years. From 2019 to 2035, the consumption of solar PV will vary greatly respectively for: urban poor (hup), urban rich (hur), rural poor (hrp) and rural rich households (hrr). As seen in Figure 8, the PV power consumption level will be more substantial in the: rural rich (hrr) and urban poor households (hur), reaching average growth rates respectively of: 2.60% in SC1 and 2.71% in SC2. This result is consistent with the works from: (Nfah and Ngundam, 2012), (Muh and Tabet, 2019) and (Njoh et al., 2019) which indicates that poor electric power generation infrastructure in the rural and remote communities makes it more plausible to utilize solar PV systems for electrification in such areas. Overall, PV consumption for households is more significant in SC2 than in SC1. Moreover, the consumption of solar PV will be extremely low for urban-rich households accounting just for: 5.39% in the SC1 and 5.54% in the SC2 scenarios. Eventually, because as compared to other areas this urban-rich households enjoys the highest electricity access rate from the national grid network.
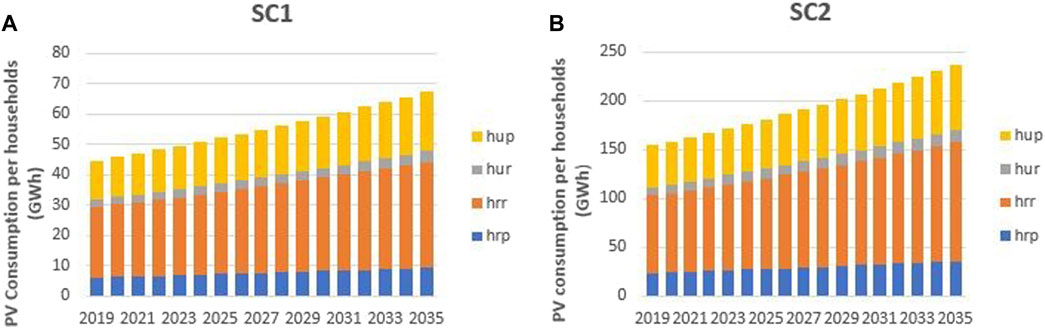
FIGURE 8. (A,B) Solar PV consumption per household in SC1 and SC2 scenarios.
Finally, an optimal policy to increase investment and finance will definitely have a positive impact on PV consumption for industries. In SC1, the renewable energy, crude oil production, mining, manufacturing and construction industries will show the greatest progress in the utilization of PV power generation. By 2035, PV consumption in SC1 scenario will increase by: 0.59% in mining, 0.40% in crude oil production, 0.34% in manufacturing, 0.25% in construction and 0.23% in wood processing industries (see Figure 9). However, PV consumption as intermediate goods will decrease to respectively: 2.08% and 0.60% in the transport and agricultural sectors.
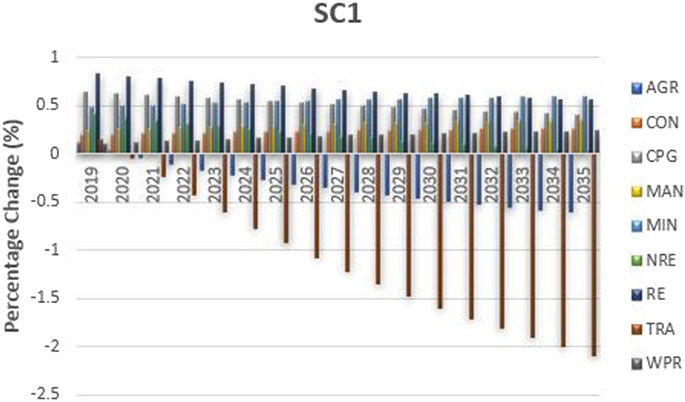
FIGURE 9. Percentage change of PV used as energy input across industries in the SC1 scenario.
In the SC2 scenario, PV consumption will have progressive growth in the following sectors: 0.69% in renewable energy, 0.53% in mining, 0.53% in construction and 0.29% in manufacturing industries. Moreover, optimizing PV investment and finance in SC2 will have a less negative impact on PV consumption for the transport and agriculture sectors. Over the period 2019–2035, PV consumption will reduce on average by: 0.30% in transport and 0.06% in the agriculture industries (see Figure 10). Therefore, the transport and agriculture industries will consume more solar PV in the SC2 than in the SC1 and BAU scenarios.

FIGURE 10. Percentage change of PV used as energy input across industries in the SC2 scenario.
In this study, a dynamic CGE model was utilized to assess the economic implications of optimizing investment and finance for PV power generation in line with Cameroon’s challenges and commitments towards achieving renewable power generation from solar PV by 2035. To evaluate the potential outcomes, three policy scenarios were simulated for the country: i) the business-as-usual (BAU) scenario, where PV power generation increases without further policy intervention, ii) the SC1 scenario, representing stable annual growth of 100% in PV investment and finance, and iii) the SC2 scenario, depicting step-wise annual increments of 5% in PV finance and investment until reaching 100%.
The results of the model simulations indicate that the SC2 policy scenario has slightly better impact on the Cameroonian economy compared to SC1 scenario. Implementing step-wise optimization policy for PV investment and finance accelerates the development of the PV power industry while minimizing its impact on economic growth. This aligns with the significant supply and consumption of PV electricity by households and industries in the SC2 scenario. Additionally, the step-wise increment policy leads to reduction in carbon emissions from energy-intensive industries. By adopting stable optimization policy for PV investment and finance, the Cameroonian government may reduce total investment expenditure costs and increase the final investment demand for PV power generation over time.
Furthermore, these findings provide valuable insights for policymakers and investors, enabling them to identify optimal mechanisms for financing and investing in PV power generation to achieve Cameroon’s long-term targets by 2035. The study highlights the significance of investment and financing in renewable energy as crucial mechanism for driving sustainable energy, fostering economic growth, and promoting climate action in Cameroon. It underscores the importance of directing resources towards renewable energy projects to achieve multiple objectives in the energy sector and beyond. Furthermore, the study recommends that future research should extend the scope by utilizing the dynamic CGE model to estimate the proportion of electricity generated from various energy sources in Cameroon’s national power mix. By considering broader energy mix, policymakers and stakeholders can make more informed decisions regarding energy planning, resource allocation, and transition to cleaner and sustainable energy systems.
The original contributions presented in the study are included in the article/Supplementary Materials, further inquiries can be directed to the corresponding author.
ML contributed to the conceptualization, data processing, simulations, analyses, writing and editing original draft. ZW provided supervision, revision and guidance all through the publication process. HA discussed the results, proofread and polished the text. All authors contributed to the article and approved the submitted version.
This work was supported by the project of the Social Sciences Foundation in Beijing (14JGB067) and the project entrusted by China Research Institute for Science Popularization (190109EZR027).
The authors declare that the research was conducted in the absence of any commercial or financial relationships that could be construed as a potential conflict of interest.
All claims expressed in this article are solely those of the authors and do not necessarily represent those of their affiliated organizations, or those of the publisher, the editors and the reviewers. Any product that may be evaluated in this article, or claim that may be made by its manufacturer, is not guaranteed or endorsed by the publisher.
The Supplementary Material for this article can be found online at: https://www.frontiersin.org/articles/10.3389/fenrg.2023.1238112/full#supplementary-material
Abanda, F. H. (2012). Renewable energy sources in Cameroon: Potentials, benefits and enabling environment. Renew. Sustain. Energy Rev. 16 (7), 4557–4562. doi:10.1016/j.rser.2012.04.011
AfDB (2021). Country priority plan and diagnostic of the electricity sector: Cameroon. Abidjan, Côte d’Ivoire: African Development Bank (AfDB) Group.
Amadu, I., and Samuel, F. (2020). Power supply and manufacturing growth: Evidence from Cameroon. Energy Policy 147, 111922. doi:10.1016/j.enpol.2020.111922
APRI (2022). Climate Finance in Sub-Saharan Africa: Needs, challenges and opportunities to deliver the financial resources required to drive low carbon and climate-resilient development. Berlin, Germany: Africa Policy Research Institute.
Belessiotis, V. G., and Papanicolaou, E. (2012). History of solar energy. Comprehensive renewable energy. Oxford: Elsevier, 85–102.
Bergek, A., Mignon, I., and Sundberg, G. (2013). Who invests in renewable electricity production? Empirical evidence and suggestions for further research. Energy Policy 56, 568–581. doi:10.1016/j.enpol.2013.01.038
BloombergNEF, (2019). Climatescope: Emerging markets cross-border clean energy investment. Avaialble at: http://global-climatescope.org/clean-energy-investments (Accessed on January 16, 2020).
Burfisher, M. E. (2021). Introduction to computable general equilibrium models. Introduction to computable general equilibrium models. Cambridge: Cambridge University Press, 9–24.
Cordon, T., Dahl, H., and Devarajan, S. (1987). Implementing a computable general equilibruim model on GAMS the Cameroon model. Washington, DC: World Bank.
Dai, H., Xie, Y., Liu, J., and Masui, T. (2018). Aligning renewable energy targets with carbon emissions trading to achieve China's INDCs: A general equilibrium assessment. Renew. Sustain. Energy Rev. 82, 4121–4131. doi:10.1016/j.rser.2017.10.061
Decaluwé, B., and Martens, A. (1988). CGE modeling and developing economies: A concise empirical survey of 73 applications to 26 countries. J. Policy Model. 10 (4), 529–568. doi:10.1016/0161-8938(88)90019-1
Devarajan, S., and Robinson, S. (2013). Chapter 5 - contribution of computable general equilibrium modeling to policy formulation in developing countries. Handb. Comput. General Equilib. Model. 1, 277–301. doi:10.1016/B978-0-444-59568-3.00005-5
Dincer, I. (2000). Renewable energy and sustainable development: A crucial review. Renew. Sustain. Energy Rev. 4 (2), 157–175. doi:10.1016/s1364-0321(99)00011-8
Egute, T. O., Albrecht, E., and Ateghang, E. W. (2017). Legal and policy framework affecting renewable energy and energy efficiency deployment in Cameroon. Renew. Energy Law Policy Rev. 7 (4), 17–30. doi:10.4337/relp.2017.04.02
Elie, L., Granier, C., and Rigot, S. (2021). The different types of renewable energy finance: A bibliometric analysis. Energy Econ. 93, 104997. doi:10.1016/j.eneco.2020.104997
Fujimori, S., Masui, T., and Matsuoka, Y. (2014). Development of a global computable general equilibrium model coupled with detailed energy end-use technology. Appl. Energy 128, 296–306. doi:10.1016/j.apenergy.2014.04.074
IEA (2022). African energy outlook 2022. Paris, France: International Energy Agency. Available at: https://iea.blob.core.windows.net/assets/27f568cc-1f9e-4c5b-9b09-b18a55fc850b/AfricaEnergyOutlook2022.pdf.
IEA (2021a). IEA world energy outlook. Available at: https://www.iea.org/reports/world-energy-outlook-2021.
IEA (2021b). Renewables 2021-analysis and forcast to 2026. Paris, France: International Energy Agency. Available at: https://www.iea.org/corrections.
IMF (2022). Country profile: Cameroon. Available at: https://www.imf.org/en/Countries/CMR#countrydata.
INS (2018). Banque des donnees economiques et financieres, exercise 2018. Tunisia: Institut Nationale de la Statistique. Available at: www.ins-cameroon.cm.
IRENA (2022). Renewable energy global trends. Available at: https://www.irena.org/Statistics/View-Data-by-Topic/Costs/Global-Trends.
IRENA (2020). Trends in renewable energy. Available at: https://public.tableau.com/views/IRENARETimeSeries/Charts?:embed=y&:showVizHome=no&publish=yes&:toolbar=no. (Accessed on June 20 2020).
Jia, Z., and Lin, B. (2022). CEEEA2.0 model: A dynamic CGE model for energy-environment-economy analysis with available data and code. Energy Econ. 112, 106117. doi:10.1016/j.eneco.2022.106117
Johansen, L. (1960). Rules of thumb for the expansion of industries in a process ofEconomic growth. Econometrica 28, 258–271. doi:10.2307/1907720
Kabir, E., Kumar, P., Kumar, S., Adelodun, A. A., and Kim, K.-H. (2018). Solar energy: Potential and future prospects. Renew. Sustain. Energy Rev. 82, 894–900. doi:10.1016/j.rser.2017.09.094
Kapica, J., Canales, F. A., and Jurasz, J. (2021). Global atlas of solar and wind resources temporal complementarity. Energy Convers. Manag. 246, 114692. doi:10.1016/j.enconman.2021.114692
KEEI (2017). A study for establishment of the Master plan of Renewable Energy in Cameroon. Ulsan, South Korea: Korea Energy Economics Institute. Available at: www.keei.re.kr.
Kenfack, J., Fogue, M., Hamandjoda, O., and Tatietse, T. T. (2011). “Promoting renewable energy and energy efficiency in central Africa: Cameroon case study,” in World renewable energy congress-Sweden (Linköping; Sweden: Linköping University Electronic Press), 8–13.
Kidmo, D. K., Deli, K., and Bogno, B. (2021). Status of renewable energy in Cameroon. Renew. Energy Environ. Sustain. 6, 2. doi:10.1051/rees/2021001
Kimuli, I., Lubwama, M., Sebbit, A., and Kirabira, J. B. (2022). Macroeconomic effects of a low carbon electrification of greater kampala metropolitan area energy policy: A computable general equilibrium analysis. Energy Strategy Rev. 43, 100909. doi:10.1016/j.esr.2022.100909
Lea, L. M., and Ndjinang, A. J. (2019). Energy sector of Cameroon. Afr. Rev. 11 (1), 34–45. doi:10.1080/09744053.2018.1538678
Li, M., Hamawandy, N. M., Wahid, F., Rjoub, H., and Bao, Z. (2021). Renewable energy resources investment and green finance: Evidence from China. Resour. Policy 74, 102402. doi:10.1016/j.resourpol.2021.102402
Maka, A. O. M., Salem, S., and Mehmood, M. (2021). Solar photovoltaic (PV) applications in Libya: Challenges, potential, opportunities and future perspectives. Clean. Eng. Technol. 5, 100267. doi:10.1016/j.clet.2021.100267
MINEE (2014). Statistical YearBook of Cameroon`s water and energy. Rafi Marg, New Delhi: Ministry of Water Resources and Energy.
MINEPAT (2009). Cameroon vision 2035. Yaoundé: Ministry of Economy, Planning and Regional Development.
MINEPAT (2020). National Development Strategy 2020-2030;; for structural transformation and inclusive development. Yaoundé: Ministry of Economy, Planning and Regional Development. Available at: www.minepat.gov.cm.
Muh, E., Amara, S., and Tabet, F. (2018). Sustainable energy policies in Cameroon: A holistic overview. Renew. Sustain. Energy Rev. 82, 3420–3429. doi:10.1016/j.rser.2017.10.049
Muh, E., and Tabet, F. (2019). Comparative analysis of hybrid renewable energy systems for off-grid applications in Southern Cameroons. Renew. energy 135, 41–54. doi:10.1016/j.renene.2018.11.105
Mungai, E. M., Ndiritu, S. W., and Da Silva, I. (2022). Unlocking climate finance potential and policy barriers—a case of renewable energy and energy efficiency in sub-saharan Africa. Resour. Environ. Sustain. 7, 100043. doi:10.1016/j.resenv.2021.100043
Nfah, E., and Ngundam, J. (2012). Identification of stakeholders for sustainable renewable energy applications in Cameroon. Renew. Sustain. Energy Rev. 16 (7), 4661–4666. doi:10.1016/j.rser.2012.05.019
Njinkeu, D. (1996). Evaluation of the incentive structure: A survey and application to Cameroon. World Dev. 24 (3), 557–568. doi:10.1016/0305-750x(95)00148-6
Njoh, A. J., Etta, S., Essia, U., Ngyah-Etchutambe, I., Enomah, L. E., Tabrey, H. T., et al. (2019a). Implications of institutional frameworks for renewable energy policy administration: Case study of the Esaghem, Cameroon community PV solar electrification project. Energy policy 128, 17–24. doi:10.1016/j.enpol.2018.12.042
Njoh, A. J., Etta, S., Ngyah-Etchutambe, I. B., Enomah, L. E., Tabrey, H. T., and Essia, U. (2019b). Opportunities and challenges to rural renewable energy projects in Africa: Lessons from the Esaghem Village, Cameroon solar electrification project. Renew. energy 131, 1013–1021. doi:10.1016/j.renene.2018.07.092
Okoye, C. O., and Oranekwu-Okoye, B. C. (2018). Economic feasibility of solar PV system for rural electrification in Sub-Sahara Africa. Renew. Sustain. Energy Rev. 82, 2537–2547. doi:10.1016/j.rser.2017.09.054
Olabi, A., and Abdelkareem, M. A. (2022). Renewable energy and climate change. Renew. Sustain. Energy Rev. 158, 112111. doi:10.1016/j.rser.2022.112111
Polzin, F., Egli, F., Steffen, B., and Schmidt, T. S. (2019). How do policies mobilize private finance for renewable energy?—a systematic review with an investor perspective. Appl. Energy 236, 1249–1268. doi:10.1016/j.apenergy.2018.11.098
Polzin, F., Sanders, M., and Serebriakova, A. (2021). Finance in global transition scenarios: Mapping investments by technology into finance needs by source. Energy Econ. 99, 105281. doi:10.1016/j.eneco.2021.105281
Rainer, T., and Manfred, W. (1993). Modeling deforestation in a computable general equilibrium model. Kiel Work. Pap. 555.
Sachs, J. D., Schmidt-Traub, G., Mazzucato, M., Messner, D., Nakicenovic, N., and Rockström, J. (2019). Six transformations to achieve the sustainable development goals. Nat. Sustain. 2 (9), 805–814. doi:10.1038/s41893-019-0352-9
Shoven, J. B., and Whalley, J. (1972). A general equilibrium calculation of the effects of differential taxation of income from capital in the U.S. J. Public Econ. 1 (3-4), 281–321. doi:10.1016/0047-2727(72)90009-6
SOLARGIS (2021). Solar resource maps. Available at: https://solargis.com/maps-and-gis-data/download/cameroon.
Tamba, J. G., Nsouandélé, J. L., Fopah Lélé, A., and Sapnken, F. E. (2017). Electricity consumption and economic growth: Evidence from Cameroon. Energy Sources, Part B Econ. Plan. Policy 12 (11), 1007–1014. doi:10.1080/15567249.2017.1349211
UNECA, AfDB, and AU, (2021). African statistical yearbook. Addis Ababa, Ethiopia: United Nations Economic Commission for Africa. Available at: http://www.afdb.org/statistics.
Wirba, A. V., Mas' ud, A. A., Muhammad-Sukki, F., Ahmad, S., Tahar, R. M., Rahim, R. A., et al. (2015). Renewable energy potentials in Cameroon: Prospects and challenges. Renew. Energy 76, 560–565. doi:10.1016/j.renene.2014.11.083
World Bank. (2019). World Bank development indicators. Available at: https://data.worldbank.org/indicator/EG.ELC.ACCS.ZS?locations=CM&view=chart.(Accessed on December 30, 2019).
Wu, Y., Chu, H., Dong, H., Xu, C., Chen, W., and Wu, G. (2022). Optimal site selection of rural wind–photovoltaic-storage station from a sustainable development perspective. Energy Rep. 8, 8381–8395. doi:10.1016/j.egyr.2022.06.050
Wu, Z., Njoke, M. L., Tian, G., and Feng, J. (2021). Challenges of investment and financing for developing photovoltaic power generation in Cameroon, and the countermeasures. J. Clean. Prod. 299, 126910. doi:10.1016/j.jclepro.2021.126910
Xiao, B., Niu, D., Guo, X., and Xu, X. (2015). The impacts of environmental tax in China: A dynamic recursive multi-sector CGE model. Energies 8 (8), 7777–7804. doi:10.3390/en8087777
Keywords: photovoltaic power generation, electricity access, project investment and financing, optimization management, policy scenarios, dynamic computable general equilibrium model, renewable energy targets
Citation: Njoke ML, Wu Z and Abudu H (2023) The effect of investment and financing optimization policies for developing photovoltaic power generation in Cameroon; a dynamic CGE model assessment. Front. Energy Res. 11:1238112. doi: 10.3389/fenrg.2023.1238112
Received: 10 June 2023; Accepted: 14 July 2023;
Published: 31 July 2023.
Edited by:
K. Sudhakar, Universiti Malaysia Pahang, MalaysiaReviewed by:
Galina Chebotareva, Ural Federal University, RussiaCopyright © 2023 Njoke, Wu and Abudu. This is an open-access article distributed under the terms of the Creative Commons Attribution License (CC BY). The use, distribution or reproduction in other forums is permitted, provided the original author(s) and the copyright owner(s) are credited and that the original publication in this journal is cited, in accordance with accepted academic practice. No use, distribution or reproduction is permitted which does not comply with these terms.
*Correspondence: Mbanda L. Njoke, bGlvbmVsbWJhbmRhQGdtYWlsLmNvbQ==
Disclaimer: All claims expressed in this article are solely those of the authors and do not necessarily represent those of their affiliated organizations, or those of the publisher, the editors and the reviewers. Any product that may be evaluated in this article or claim that may be made by its manufacturer is not guaranteed or endorsed by the publisher.
Research integrity at Frontiers
Learn more about the work of our research integrity team to safeguard the quality of each article we publish.