 Yulong Yang1
 Xinge Wu
 Ziye Zhang
95% of researchers rate our articles as excellent or good
Learn more about the work of our research integrity team to safeguard the quality of each article we publish.
Find out more
ORIGINAL RESEARCH article
Front. Energy Res. , 18 September 2023
Sec. Sustainable Energy Systems
Volume 11 - 2023 | https://doi.org/10.3389/fenrg.2023.1237781
The northern regions of China face the challenges of the mismatch of the power supply and demand, as well as serious wind curtailment issues, caused mainly by the limitation of the “with heat to determine electricity” mode for combined heat and power generation during the winter season. To further absorb the surplus wind power and alleviate restrictions, a comprehensive energy system optimization method for parks based on coordinated scheduling between sources and loads is proposed in this paper. First, the implementation of a heat-storage electric boiler on the source side further achieves the decoupling of heat and power. Second, an optimized scheduling method for electric vehicles combining incentive scheduling and orderly scheduling is proposed on the load side, which helps flatten the load curve. Finally, a tiered carbon trading mechanism is introduced and a community integrated energy system (CIES) optimization scheduling model is established with the aim of minimizing the total cost of the CIES, and the problem is solved using the CPLEX commercial solver. The simulation results indicate that the overall system efficiency is significantly improved through the coordinated scheduling of power sources and loads. Specifically, the integration rate of wind power increases by 3.91% when compared to the sole consideration of the integrated demand response. Furthermore, the peak shaving and off-peak filling effect is considerably enhanced compared to the utilization of only thermal-storage electric boilers. Additionally, the implementation of coordinated scheduling leads to a reduction in the total system cost by 2764.32 yuan and a decrease in total carbon emissions by 3515.4 kg. These findings provide compelling evidence that the coordinated scheduling of power sources and loads surpasses the limitations of thermal power units, strengthens the demand response capability of electric vehicles, and enhances the economic benefits of the CIES.
In northern China, wind power during winter exhibits the characteristic of an anti-peak load with low generation and high generation at night (Zhao et al., 2021). Additionally, the “with heat to determine electricity” model restricts many combined heat and power (CHP) units (Liu et al., 2023), leading to significant wind curtailment. To improve wind power accommodation and reduce carbon emissions, heat-storage electric boilers, as a type of electric-to-heat conversion devices with time-shifting properties, have been widely studied.
Heat-storage electric boilers are a type of clean and efficient energy conversion equipment that can effectively solve the problem of mismatch between the new energy and the load in time and space, supporting the safe, stable, and economic operation of the power grid. Therefore, many scholars have proposed the utilization of abandoned wind power for heat dispatching strategies. Li et al. (2023) proposed a coordinated economic dispatch model for primary and secondary heating systems that incorporates boiler-supplied heating. The effectiveness and optimality of the method were analyzed and verified using the P6S12 system. Fan et al. (2022) proposed a distributed thermal-storage electric boiler scheduling framework based on deep reinforcement learning and responsive user presence. The adaptability and generalization of the proposed method under different conditions were verified. Yang et al. (2018) made improvements to the heating system based on the work of Li, decoupled heat-storage electric boilers from the operation mode of thermoelectric units, reduced coal consumption by abandoning wind heating, and improved the load regulation ability of the units while enhancing the economic performance of the system. Chen et al., (2015) made improvements to the operating method and proposed a flexible operation mode for electric boilers and heat storage tanks, which significantly reduced the abandonment rate of wind. Zhang (2022) developed a wind power curtailment scheduling model that coordinates the use of heat-storage (CHP) and electric boilers for heating. This effectively expands the capacity of wind power accommodation into the grid and helps reduce scheduling costs. On this basis, Tan responded to price-type demands and the impact of rural biogas digesters on the district heating network. Tan et al. (2022) proposed a robust dispatch model for integrated electricity and heat networks based on the price-based integrated demand response to accommodate wind power integration. The model further resolved the problem of asynchrony between the electric load and the thermal load. Tan et al. (2023) introduced a cooperative operation framework for an integrated rural energy system with greenhouses. The framework utilizes a rural biogas digester to supply fuel to CHP. Additionally, it enhances biogas production by injecting hot water into the digester through a heat circulation process. This approach enables efficient management and scheduling of energy resources. The aforementioned literature only considers the effect of accommodating wind power and reducing carbon emissions on the source side. However, the energy saving and emission reduction capacity on the source side is limited, and with the large-scale integration of electric vehicles into the grid, their participation in the demand response needs to be further developed, while the load-side regulation space is significantly increased. Therefore, the joint accommodation of renewable energy and the reduction of carbon emissions by the source and load sides requires further research.
Currently, electric vehicles (EVs) serve as an important demand response on the supply side, with characteristics such as large quantity and strong dispatch ability (Li et al., 2015). Therefore, many scholars have conducted research on the following two aspects: first, the price-type demand response, which guides users and adjusts electricity consumption behavior through flexible electricity price policies (Hou et al., 2022a); second, the incentive-type demand response, which motivates users to participate in load adjustment by adopting economic compensation electricity prices based on signed contracts or agreements (Hou et al., 2022b; Liu and Wang, 2021). Yu et al. (2022) proposed a dynamic updating strategy for regional dispatch pricing that integrates the spatial and temporal information of the power grid. The results verified that the proposed strategy can effectively reduce the load deviation of each regional power grid, reduce the operating cost of the electric vehicle aggregator, and reduce the charging cost of electric vehicle users. Cui et al. (2018) described the classification basis of current EV charging and discharging pricing and analyzed the ordered charging and discharging pricing models of EVs from various perspectives. Chen et al. (2017) made improvements to the charging station based on the word of Cui, who proposed an automatic demand response strategy for photovoltaic-assisted charging stations based on real-time prices, which improves the economic viability and effectively promotes renewable energy consumption. Ginigeme and Wang (2020) conducted an extensive study on vehicle-to-grid (V2G), proposed an optimal V2G model based on real-time electricity prices, and validated the economic feasibility and universality of the proposed model.
Compared to price-based demand response, which cannot fully utilize the demand response potential of EVs, the incentive-based demand response can fully utilize the demand response potential by signing agreements with EV owners. For example, Chen and Chang. (2018) propose a cloud-based energy management service for the fair demand response of EVs. Zhou et al. (2019) developed a demand response mechanism compatible with distributed systems, privacy protection, and incentives for connected vehicles. Chen and Zhang (2019) proposed a new secure power trading and incentive contract model. Al-Ghussain et al. (2022) analyzed the influence of EV penetration percentages and charging rates on optimal system sizing and found that higher EV penetration requires an increase in the battery energy storage system capacity and the renewable energy system capacity, with an optimal charging period in the morning. However, relevant research has only analyzed the EV aggregation scheduling strategy from the perspective of a single price or incentive type, and few have considered it from the perspective of the combination of the price and incentive demand response. Therefore, how to fully tap into its demand response potential and help with peak shaving and valley filling in the CIES system has become the key to EV scheduling research.
To address the aforementioned issues, this paper proposes an optimized scheduling strategy for energy saving and emission reduction by combining heat-storage electric boilers and electric vehicles. First, the scenario reduction method is used to process the uncertainty of renewable energy and to obtain periods of abandoned wind. Then, the impact of different operation modes of the thermal-storage electric boiler, the demand response dispatching strategy, and the compensation price of electric vehicles on the comprehensive benefits of the CIES is studied, respectively; subsequently, a stepped carbon trading mechanism containing positive and negative carbon is introduced to limit the carbon emissions of the system. Finally, an optimal scheduling model for the CIES is established with the goal of minimizing the operating cost during the previous day’s dispatch cycle. The CPLEX commercial solver is used to validate the effectiveness of the proposed method.
The main contributions of this paper are as follows:
(1) Further analysis was conducted on the operation mode of the heat-storage electric boiler, with a focus on addressing the issue of wind power curtailment. A novel operational strategy was proposed, which involves tracking wind power curtailment to maximize the integration of wind energy while overcoming the constraints associated with “heat-driven electricity generation.”
(2) In order to further enhance the responsiveness of electric vehicle demand, a revised scheduling strategy combining orderly dispatch and incentive dispatch was proposed for load aggregation aggregators. The combination of these two scheduling strategies significantly reduced the charging load of EVs during peak electricity price periods and increased the load demand during off-peak periods.
(3) In order to enhance the flexibility of the system’s dispatch capabilities, an integrated energy system optimization scheduling method is proposed, which considers the source and load coordinated scheduling of thermal-storage electric boilers and electric vehicles. The introduction of thermal-storage electric boilers on the supply side promotes the decoupling of heat and electricity by utilizing excess wind power for heating. On the demand side, the introduction of the electric vehicle demand response helps in peak shaving and valley filling. The combined dispatch of the sources and loads optimizes the overall efficiency of the system.
Against the background of the green and low-carbon transformation of the energy structure, changing the development structure of traditional energy systems and striving to construct clean and efficient integrated energy systems has become an important way to achieve low-carbon emission goals. The community integrated energy system structure proposed in this paper is shown in Figure 1.
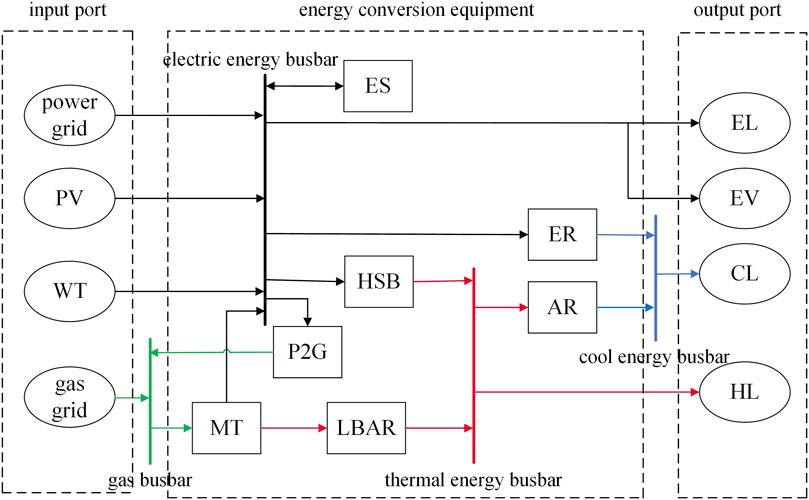
FIGURE 1. Community integrated energy system energy flow diagram.
The CIES consists of four major components: energy generation, conversion, storage equipment, and loads. The energy subsystems are planned and coordinated, with a focus on integrating renewable energy sources, while meeting user energy demands as much as possible.
Herein, wind and solar energy provide energy for the system’s wind turbines (WTs) and photovoltaic (PV) power generation and only consider the operational and maintenance costs; the heat-storage electric boiler (HSB) uses electricity for heat storage during periods of abandoned wind at night; micro-gas turbines (MTs) generate electricity using natural gas as fuel, and waste heat is recovered using a lithium bromide absorption chiller (LBAR); the power-to-gas equipment (P2G) absorbs carbon dioxide and hydrogen to form methane; electric refrigeration machines (ECs) form thermocouple pairs for refrigeration; absorption refrigeration machines (ARs) recover waste heat to meet cooling load (CL) demands; the electricity load is divided into residential electricity loads (ELs) and electric vehicle charging loads; and electric vehicles participate in the demand response by using a load aggregator (LA), considering that the role of V2G is not currently being considered.
The combined heat and power generation unit consists of a gas turbine and a bromine chiller. The bromine chiller is responsible for heat recovery. The mathematical models for the waste heat discharge of the gas turbine QMT and the thermal power of the bromine chiller QLBAR are given as follows:
where PMT(t) represents the power generation of the micro-gas turbine in time t; ηMT, ηloss, and ηret represent the power generation efficiency, heat dissipation loss coefficient, and waste heat recovery rate of the micro-gas turbine, respectively; and CLBAR denotes the thermal efficiency of the LiBr absorption chiller.
Energy storage (ES) equipment is an important component of the integrated energy system, which can alleviate the pressure of uncertain system load fluctuations to a certain extent and promote peak shaving and valley filling and wind power accommodation. Equations 3, 4 represent the constraint equations for the battery state of the charge and charge/discharge, respectively.
where SOC(t) represents the state of charge of the battery; Pes,chr(t) and Pes,dis(t) correspond to the charging and discharging power of the battery, respectively; ηes,chr and ηes,dis represent the charging and discharging efficiency of the battery, respectively; and Ues,chr(t) and Ues,dis(t) represent the status indicators of the battery’s charging and discharging operation, where 0 means inactive and 1 means active, respectively, and these two values are mutually exclusive.
where CAC(t) represents the output cooling power of the absorption refrigerator; HAC(t) represents the input thermal power of the absorption refrigerator; and ηAC represents the cooling efficiency of the absorption refrigerator.
where CEC(t) represents the output cooling power of electric refrigeration machines; HEC(t) represents the input electric power of electric refrigeration machines; and ηEC represents the cooling efficiency of electric refrigeration machines.
The heat-storage electric boiler is composed of two parts, one is the electric boiler and the other is the storage water tank, which work together to provide heat to the system. Its mathematical model is given as follows:
where Peb(t), Heb(t), Htrans(t), and Houtput(t) represent the electric power, thermal power, heat load, and power delivered to the load of the electric boiler at time t, respectively. Hin(t) and Hout(t) represent the heat-storage and release power of the storage tank at time t, respectively. Hin,max and Hout,max represent the maximum heat-storage and release power of the storage tank, respectively. ηef represents the electric–thermal conversion efficiency of the electric boiler.
Based on this, we consider the heat capacity constraint of the storage tank as shown in Eq. 8.
where Sh(t) and Smax represent the thermal storage quantity and thermal storage limit of the storage tank at time t, respectively; Sh(0) and Sh(T) represent the thermal storage quantity of the storage tank at the beginning and end, respectively; and μloss represents the heat loss of the storage tank.
Heat-storage electric boilers can be divided into two operating modes: full heat storage and semi-heat storage. In the full heat-storage mode, all the heat generated by the electric boiler at the start-up time is sent to the heat-storage tank for storage instead of being directly supplied to the system for heating, and it is released during the peak period of heat load. In the semi-heat-storage mode, part of the heat generated by the electric boiler is supplied directly to the system for heating, while the rest of the heat is stored in the heat-storage tank and released according to the real-time heat load of the system.
The operational mode of the electric boiler in this article was improved in the semi-heat-storage mode. Here, we determine the possible periods of wind power abandonment through wind power forecasting methods, and the working state variable EB_state of the heat-storage-type electric boiler is set based on the following periods:
where Wpre(t) represents the predicted wind power output at time t and Wreal(t) represents the actual wind power output at time t.
During this time period, the heat-storage electric boiler produces heat as much as possible, while remaining idle during other time periods, relying only on the heat-storage water tank to release heat, in order to cooperate with the CHP unit to meet the system’s thermal load demand.
In recent years, electric vehicles have developed rapidly as a technology industry, and their load ratio in the power grid has gradually increased. Due to the randomness of the EV charging and discharging process in space and time, the traditional statistical methods make it difficult to grasp the overall data. Therefore, this article uses the Monte Carlo method, which has strong random simulation characteristics, to extract the traffic and charging behavior of each car and then obtain the charging load of the EV.
According to the statistics from the National Highway Traffic Safety Administration of the United States (NHTS) (Luo et al., 2011), the end time of a trip follows a segmented normal distribution (Wu, 2021). Taking the travel patterns of ordinary household vehicles as the analysis material and assuming that the vehicle owner will charge their electric vehicle at the end of the trip, that is, the end time of the trip is the starting time of charging, the probability density expression is as shown in Eq. 10.
where μs and σs, respectively, represent the expected value and standard deviation of the probability density function, with values of 17.6 and 3.4 (Wu, 2021).
Therefore, the typical daily driving probability density curve for electric vehicles can be plotted as shown in Supplementary Figure SA1.
The power consumed by an electric vehicle in a day is mainly determined by the daily driving mileage of the owner. The daily driving mileage of the vehicle is the approximate logarithmic normal distribution (Wu, 2021), and its probability density function is shown as follows:
where μL and σL, respectively, represent the expected value and the standard deviation of the probability density function mentioned previously, with values of 3.2 and 0.88, respectively (Wu, 2021).
The curve of the distribution of the traveled mileage was calculated and is shown in Supplementary Figure SA2.
The charging load characteristics of EVs mainly depend on the start time and the duration of the charging process. The statistical analysis of EV travel patterns can be conducted based on historical data. Based on the historical data analysis of EV travel patterns, the start time and the initial state of charge (SOC) of each electric vehicle can be determined according to its travel characteristics. This can be used to calculate the time required to charge to the desired battery level of the vehicle owner and the EV charging load. Finally, the total EV charging load is obtained by adding up the calculated values.
Due to the close relationship between the required charging time for EVs and the vehicle’s SOC, which is positively correlated with the driving distance, the calculation formula for the SOC of an electric vehicle before and after driving is given as follows:
where St1 represents the battery level at the end of the previous charge, the initial SOC, which can generally be set to 1 assuming that the electric vehicle is charged to full each time; St2 represents the battery level after driving, which is the battery level of the vehicle at the end of the last trip by the owner; d represents the distance traveled by the owner; dm represents the maximum driving range of the electric vehicle.
The required charging time for electric vehicles refers to the time interval from the beginning of charging to the point when the battery is fully charged. It can be calculated using the following formula:
where TEV represents the required charging time for electric vehicles; SSOC,KC represent the SOC of the electric vehicle at the beginning of charging; EEV represents the battery capacity of the electric vehicle; ηEVC is the charging efficiency of the electric vehicle; and PEVC is the charging power of the electric vehicle.
Based on this, adding up the charging loads of each electric vehicle can give the total disordered charging load of the EV:
where PEV(t) represents the total disordered charging load of electric vehicles at time t and NEV represents the total number of electric vehicles. PEVC(i,t) represents the charging power of the i-th electric vehicle at time t.
Based on the aforementioned model, the charging load data of electric vehicles were subjected to the Monte Carlo simulation, and the disordered charging load of EVs was obtained as shown in Supplementary Figure SA3.
As we can see, the charging of electric vehicles mostly begins at 18:00, which is also during the peak of the after-work rush hour, and the simulation results are consistent with the user behavior.
According to the charging pattern of electric vehicles, their peak charging periods coincide with the peak electricity demand of residential areas. However, during periods of heavy wind abandonment at night, the charging load is relatively low. A single scheduling strategy cannot fully utilize the flexibility of EV resources. Therefore, this paper proposes an improved scheduling strategy for load aggregation by combining the orderly scheduling method with the incentive scheduling method.
The EV scheduling proposed in this paper mainly consists of two processes: incentive scheduling under fixed signed agreements and orderly scheduling under time-of-use pricing mechanisms. The fixed signing strategy uses an LA as the intermediary between EV users and the CIES, with the LA providing compensatory prices to EV users based on the CIES’s demand for flexibility resources. EV users participate in the integrated demand response (IDR) and upload their own dispatchable information based on compensatory prices. The LA comprehensively evaluates and formulates a load transfer agreement that includes compensatory prices, charging load transfer quantities, transfer periods, and transferred periods. Electric vehicles that have signed the agreement will receive an incentive dispatch from the LA regardless of the starting time and the leaving time period. The relationship expression between the compensatory price Db(t) and the load transfer quantity Ptev(t) is shown in Eq. 16.
Ptev(t) represents the load transfer of electric vehicles after LA scheduling, with δ being the compensation price elasticity coefficient; Dsell(t) represents the system selling price of electricity at time t.
The rest of the users who have not signed an agreement are charged in an orderly manner. The orderly charging strategy first needs to determine whether the electric vehicle is transferrable, that is, tdep-tin >Ti, where tin is the arrival time of the electric vehicle, tdep is the departure time of the electric vehicle, and Ti is the charging duration of electric vehicle i. If satisfied, we determine whether the transfer is necessary based on the arrival time of the electric vehicle.
(1) During the electricity price valley period, the electric vehicle will immediately start charging.
(2) During the electricity price flat period, we determine the next period’s electricity price. If it is a valley period, we transfer the charging to the next period. If it is a peak period, charging begins immediately.
(3) During the electricity price peak period, we determine the next period’s electricity price. If it is a valley period, we transfer the charging to the next period; if it is a flat period, we determine the electricity price for the period after the peak and flat level. If it is peak pricing, we charge during the flat period; if it is valley pricing, we transfer the charging to the valley period.
If it is not satisfied and the electric vehicle does not support scheduling, it will start charging immediately. The scheduling strategy for electric vehicles is shown in Supplementary Figure SA4.
The revenue generated from LA scheduling is divided into two parts: orderly scheduling revenue and incentive scheduling revenue. The model is shown in the following equations:
where Cord(t) and Cex(t) represent the orderly scheduling revenue and incentive scheduling revenue of the LA, respectively. FEVT(i) represents the charging power of a single electric vehicle at this time point through orderly scheduling. FLA(t) represents the total revenue of LA scheduling.
Considering both the total cost of the CIES and the scheduling revenue of the LA, a comprehensive benefit index is introduced to evaluate overall benefits, as shown in Eq. 20.
where αc and αin represent the weighting coefficients for the total cost of the CIES and the load aggregation merchant revenue, respectively, while δc and δin represent the conversion coefficients for the total cost of the CIES and the load aggregation merchant revenue.
Based on the scheduling method and historical data analyzed in this paper, with αc = 0.7, αin = 0.3, δc = 0.00775, and δin = −0.21749, the overall benefits are obtained to verify the effectiveness of the electric vehicle dispatching strategy proposed in this paper.
The technology of electricity to gas refers to the conversion of electrical energy into hydrogen gas through water electrolysis, followed by the Sabatier reaction that further combines hydrogen gas with carbon dioxide to produce natural gas. The mathematical model is represented by the following equations:
where σ represents the energy conversion factor, with a value of 3.4 MBtu/(MW.h); fHHV refers to the high heating value, with a value of 1.026 MBtu/kcf; ηP2G refers to the conversion efficiency; and ΔPmin P2G and ΔPmax P2G, respectively, indicate the uphill and downhill limits of P2G.
For the scheduling optimization problem in complex integrated energy systems for electricity, heating, and cooling, considering the large number of different state variables and control variables in the system, the resulting strategy space is huge and cannot be solved using traditional numerical methods. Drawing on the hierarchical coordinated solution method for large systems, the optimization dispatch problem is divided into upper and lower layers for solution. As the operating mode of the heat-storage electric boiler is related to the heat–electric decoupling effect of the system and the dispatch strategy for electric vehicles affects its demand response capability, therefore, the upper layer analyzes the two parts separately. Due to the limited wind power accommodation capacity and insufficient improvement in the economic level of the system on a single source side or load side, a source–load coordinated scheduling strategy is proposed in lower-level scheduling. Improving the wind power grid space by decoupling heat peak CHP operation constraints of “with heat to determine electricity,” considering electric vehicles on the load side as a dispatchable value of flexible loads, the demand response is used to guide the orderly transfer of charging loads to assist in the accommodation of wind power in the grid. The specific scheduling process is shown in Figure 2.
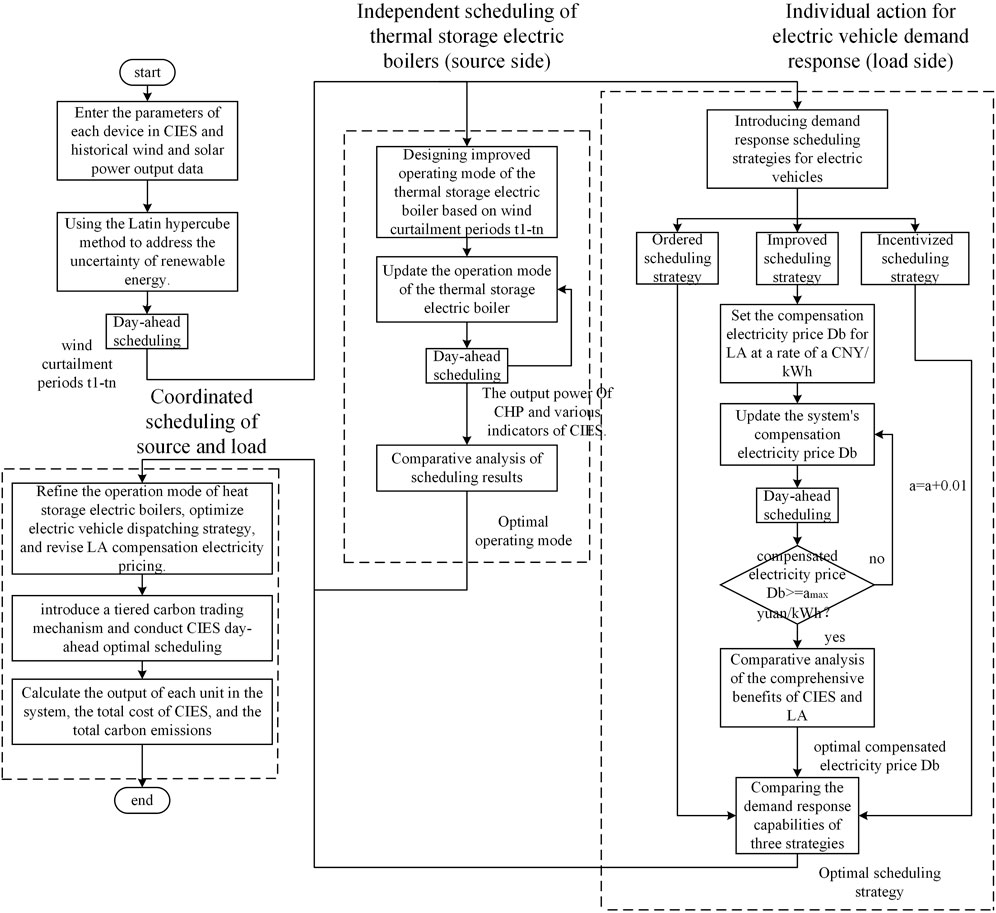
FIGURE 2. CIES overall dispatch diagram.
The solution process for the CIES coordinated scheduling between sources and loads is as follows:
(1) We use the Latin hypercube method to handle the uncertainty of renewable energy and incorporate it into day-ahead scheduling to identify periods of wind power curtailment.
(2) The heat-storage electric boiler is scheduled separately and is involved in different operating modes to solve the output power of the CHP under different operation modes of the heat-storage electric boiler.
(3) The electric vehicle is scheduled separately and involved in three scheduling strategies. Under the improved scheduling strategy for the electric vehicle, the LA compensation electricity price is cyclically changed and the cost of the CIES and the revenue of the LA are solved. A comprehensive index is introduced to analyze the optimal scheduling strategy for the EV and the optimal compensation electricity price for the LA.
(4) In lower-level scheduling, source–load devices are jointly scheduled based on the scheduling strategy provided by the upper level. First, the heat-storage electric boiler uses a portion of the abandoned wind power to generate an output power X to further decouple the power and heat. The electric vehicle uses the remaining abandoned wind power to respond to the demand and transfer the charging load Y to the abandoned wind power period. Then, by iteratively solving for X and Y, the globally optimal output power X for the heat-storage electric boiler and the optimal transfer load Y for the electric vehicle’s demand response are obtained.
(5) For introducing a tiered carbon trading mechanism, we carry out CIES day-ahead scheduling and solve the output and comprehensive data of each unit in CIES day-ahead scheduling.
Wind speed and solar irradiance exhibit characteristics such as randomness and intermittency. This makes it difficult to accurately forecast the renewable energy output, resulting in output uncertainty for wind turbines and solar panels in grid scheduling. As the difficulty in grid scheduling increases, the capacity to consume renewable energy decreases, resulting in the system generating redundant output power. In order to provide an accurate description of the random fluctuations of wind speed and light intensity in a microgrid, this paper employs the scenario analysis method to analyze and address the uncertainties of renewable energy sources in the optimization and scheduling of integrated energy systems. Based on historical data of wind speed and light intensity, the corresponding probability density functions are established. It is assumed that wind power follows a normal distribution N (μ; σ2), where μ represents the predicted expected value of wind power and σ is expressed as a percentage of the fluctuation (Wang et al., 2008). The Latin hypercube sampling method is used to sample the cumulative distribution functions of wind speed and light intensity and to generate a representative set of scenarios for wind speed and light intensity, as shown in Figure 3.
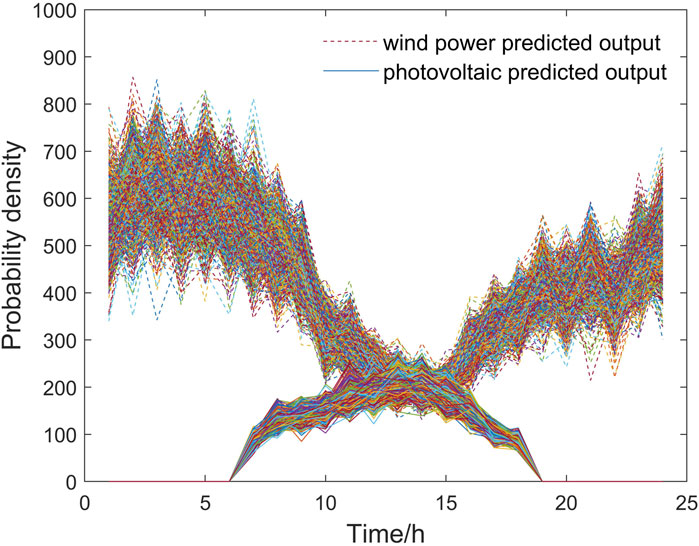
FIGURE 3. Renewable energy output curve diagram for each scenario before reduction.
Then, we utilize the fast descendant elimination algorithm based on the probability distance to achieve scenario reduction, reducing the number of sample scenarios and ultimately obtaining 10 representative scenarios of wind and solar power generation and their corresponding probabilities, Ps,s = 1,2, … ,10. The distribution diagram of the reduced scenarios is shown in Figure 4.
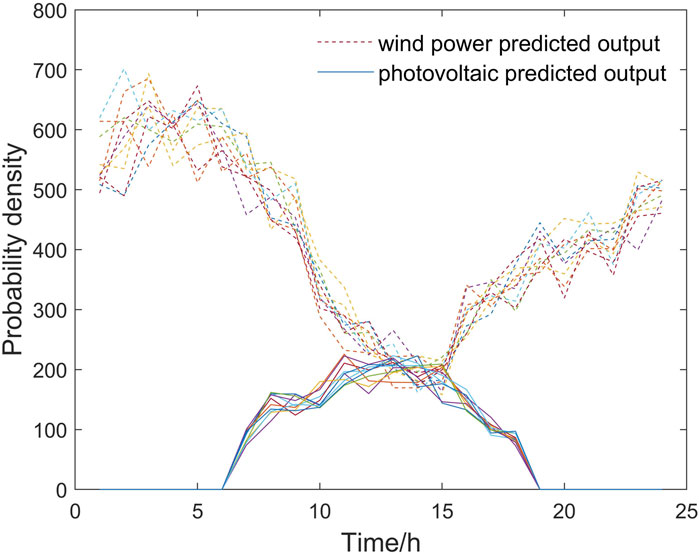
FIGURE 4. Renewable energy output curve diagram for each scenario after reduction.
The carbon trading mechanism establishes and trades carbon emission permits in a legitimate manner, allowing producers to trade carbon emission permits in the market to achieve the goal of controlling carbon emissions. Regulatory authorities use cost incentives to encourage producers to participate in the carbon emission permit market and distribute carbon trading quotas to each producer. If the actual carbon emissions of a producer exceed the carbon emission quota, they must purchase the required carbon emission permits in the carbon trading market. Conversely, they can sell the surplus carbon emission permits to the carbon trading market to earn profits. The staircase carbon trading mechanism model mainly consists of three parts: the carbon emission quota model, the actual carbon emission model, and the staircase carbon emission trading model.
Carbon emissions from sources in the CIES can be divided into emissions from gas-fired units and emissions from coal-fired units. This paper suggests that the carbon emissions generated by the CHP equipment’s energy supply come from gas-fired units, while the carbon emissions generated from purchasing electricity at the system level come from coal-fired units. The model for free carbon emission trading quotas is shown in Eq. 23.
where EIES, Ee,buy, and ECHP represent the carbon emission quota allocations for the CIES, the purchased electricity at the system level, and CHP, respectively. Ke and Kg correspond to the carbon emission quota allocations for coal-fired units per unit of electricity consumption and gas-fired units per unit of natural gas consumption, respectively. Pe,buy(t) represents the amount of electricity purchased at the system level during time period t. φe,h represents the conversion factor from the conversion coefficient from power generation to heat generation of CHP, and T represents the scheduling cycle.
The actual carbon emissions in this article refer to the net emissions after subtracting the amount of CO2 consumed by P2G equipment during the operation from the amount of CO2 generated by the system. The actual carbon emission model for the system is as follows:
where E′IES, E′e,buy, E′CHP, and E′P2G represent the actual carbon emissions (absorption) of the CIES, electricity purchased from the upper level of the system, CHP, and P2G, respectively. The calculation methods for E′e,buy and E′CHP are basically the same as those in the previous section, but with different carbon emission factors (Ke for electricity and Kg for heat). E’P2G represents the amount of CO2 captured by P2G, and KP represents the amount of CO2 required to convert one unit of electricity.
Based on the aforementioned information, after obtaining free carbon emission quotas and actual system carbon emissions, the formula for calculating the actual carbon emission rights involved in the carbon trading market is as follows:
where E″IES represents the carbon emission trading quotas of IES.
Compared to traditional carbon trading mechanisms, in order to more strictly control carbon emissions, a tiered carbon trading cost is adopted on the basis of traditional carbon emission trading by calculating carbon trading costs based on the difference between carbon emissions and carbon quotas. When the difference between carbon emissions and carbon quotas exceeds a given range, the excess amount increases the unit price of carbon trading; when carbon emissions are below the carbon quota, the surplus carbon emission quota is sold for a profit, and a compensation coefficient is introduced to increase the incentive for emission reduction. The tiered carbon trading cost calculation model is shown in formula (27).
where CCO2 represents the tiered carbon trading cost; λ represents the base carbon trading price; c represents the length of the carbon emissions interval; and β represents the rate of price growth.
where FG represents the operational cost of the system within the scheduling period T. CFC(t), CMT(t), CWA(t), and CIDR(t) represent the fuel cost, unit maintenance cost, wind power abandonment penalty cost, and purchased cost of IDR for the system at time t. CEX(t) represents the cost incurred by the system for purchasing electricity from the main grid at time t.
(1) Fuel cost.
where DCH4 and LCH4 refer to the natural gas price and its lower heating value, respectively.
(2) Equipment maintenance cost.
where ci represents the maintenance cost per unit of power for a device. Pi(t) represents the output power of unit i in time period t. ces represents the maintenance cost per unit of power for an energy storage device. Pes(t) represents the power dispatched by the energy storage device during time period t.
(3) Purchase cost of electricity.
where cbuy represents the unit purchase cost of electricity, while Pbuy(t) represents the purchased electricity power during time period t.
(4) Resource purchase cost.
where DIDR represents the cost of purchasing a unit of demand resources.
(5) The cost of the wind abandonment penalty.
where Pw,pre(t) represents the predicted wind power output for period t, PW(t) represents the actual wind power output for period t, and δW represents the wind abandonment penalty coefficient.
(1) Energy balance constraint.
where PPV(t) represents the photovoltaic output during time period t; PEC(t) represents the electrical power consumed by the electric refrigeration machine; Prev(t) represents the total charging power of electric vehicles after the demand response during time period t; Pload(t), Hload(t), and Cload(t) represent the electricity demand, heat demand, and cooling demand during time period t; HAC(t) represents the heat power absorbed by the absorption chiller; CAC(t) represents the cooling capacity of the absorption chiller; and CEC(t) represents the cooling capacity of the electric refrigeration machine.
(2) The total charging load of electric vehicles should remain unchanged after considering IDR.
(3) Power transmission constraints of the interconnection line with a superior grid.
Pline(t) is the upper limit of power transmission for the interconnection line during time period t.
This article selects a comprehensive park in a city in northern China as the research object and conducts dispatch analysis on 200 electric vehicles (Cui et al., 2020). The parameters of typical equipment are shown in Supplementary Table SA1, unit parameters are shown in Supplementary Table SA2, and the time-of-use electricity price information is shown in Supplementary Table SA3.
Due to the “with heat to determine electricity” characteristic of CHP units, the overlap between the low power consumption period at night and the peak heat load period leads to a large amount of wind abandonment in the system. Therefore, a storage electric boiler is introduced to work with CHP units for heating. However, the operation mode of the storage electric boiler is different, which affects its heating effect. Therefore, the operation mode of the storage electric boiler needs to be analyzed. The impact of the operation mode of the storage electric boiler on the operation results of the CIES and the output of CHP units are shown in Table 1; Figure 5, respectively.
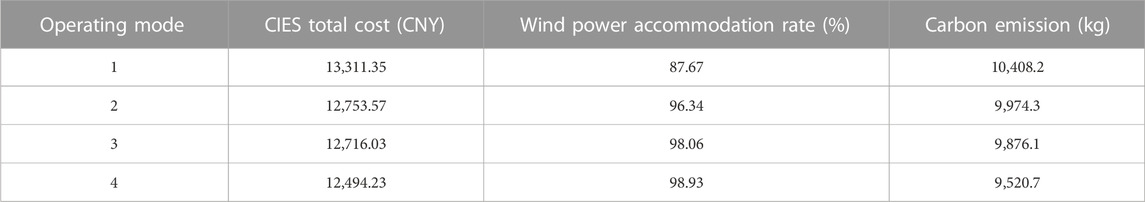
TABLE 1. CIES optimization scheduling results under various operating modes of heat-storage electric boilers.
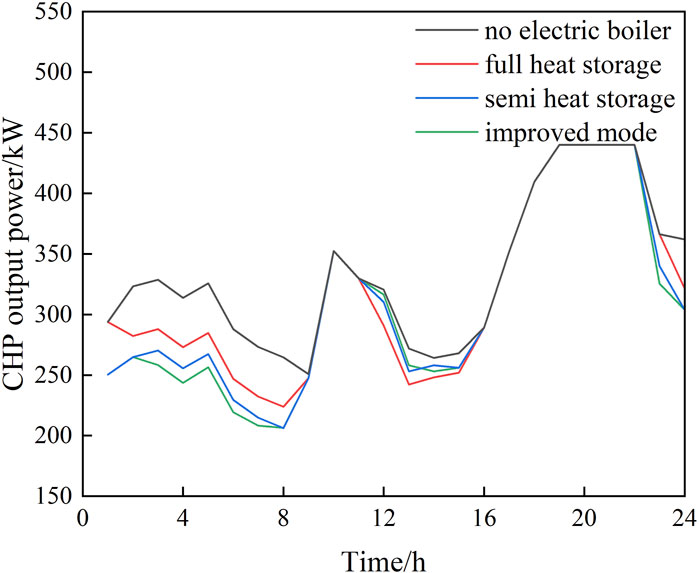
FIGURE 5. CHP output diagram of the heat-storage electric boiler under various operating modes.
As shown in Figure 5, during the electricity price valley periods (24 and 1–8), the CHP output under the full storage heating operation mode is higher than that under the half storage heating operation mode, while the CHP output under the wind abandonment control operation mode is the lowest. During the normal electricity price period (11–16), the CHP output under half storage heating and the wind abandonment control operation mode is basically the same, while the CHP output under the full storage heating operation mode is the lowest. The reason is that all the heat generated by the electric boiler operating under the full storage heating mode is not instantly supplied to the system, but is stored in the heat-storage tank and then provided to the heating system based on the comprehensive consideration of price factors and the system thermal power demand. The heat-storage electric boilers with the abandoned wind control operation mode adopt the strategy of tracking abandoned wind start–stop control. During the abandoned wind period, the output is maximized, and the system prioritizes the use of storage-type electric boilers for heating, resulting in a significant reduction in the CHP unit output, and is freed from the limitation of the “with heat to determine electricity” mode.
Based on Table 1, it can be seen that among the four operating modes, the CIES total cost and carbon emissions of the wind power curtailment control operating mode were the lowest, decreasing by 6.54% and 8.52%, respectively. The wind power absorption level also increased significantly by 11.26%. This confirms the effectiveness of the wind power curtailment control operating mode in optimizing the CIES dispatch.
According to the travel habits of car owners, this article proposes a price incentive dispatch strategy for electric vehicles that cannot participate in orderly dispatch for a long time. This strategy requires them to participate in dispatch through a fixed contract agreement, forming an improved dispatch strategy that combines incentive dispatch with orderly dispatch. Therefore, this article conducts an in-depth analysis of three dispatch strategies, and the EV load transfer volume of each dispatch strategy is shown in Figure 6.
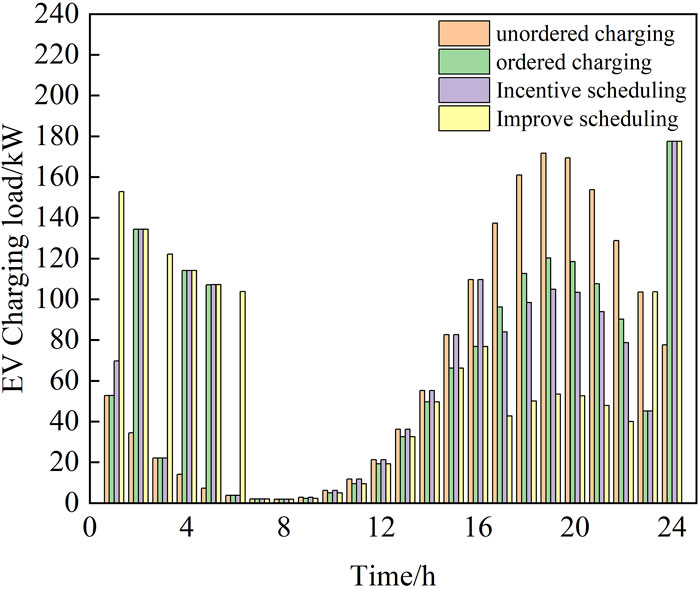
FIGURE 6. Electric vehicle load for each scheduling strategy after the demand response.
Analysis shows that the orderly dispatch strategy transfers some electric vehicles during the peak periods of electricity prices from 9 to 11 h, 17–22 h, and the flat period of 12–16 h to valley periods, which improves the EV demand response capacity. However, its ability to regulate the EV charging load during peak periods is insufficient, and the peak shaving and valley filling effect is not significant. Therefore, load transfer agreements are provided for electric vehicles that cannot participate in orderly dispatch during peak electricity price periods, forcing them to participate in dispatch, and the two are integrated together to form an improved dispatch strategy. The improved strategy significantly reduces the EV charging load, increases the load demand during valley periods, and greatly enhances the peak shaving and valley filling effect, further absorbing the abandoned wind power.
Table 2 compares the CIES total cost and LA revenue of different scheduling strategies for EVs. The comprehensive scheduling results show that the improved scheduling strategy has a lower CIES total cost and higher LA revenue, which confirms the effectiveness of the proposed scheduling strategy.
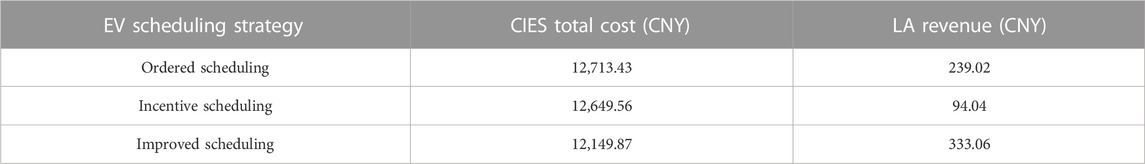
TABLE 2. Optimization scheduling results under different scheduling strategies for EVs.
The previous section systematically studied three EV scheduling strategies and found that the demand response effect for improving the scheduling strategy is optimal. The LA compensation electricity price is the core parameter of the improved scheduling strategy. It needs to be analyzed in detail. The impact of the compensation electricity price on the CIES and the load aggregator is shown in Figure 7.
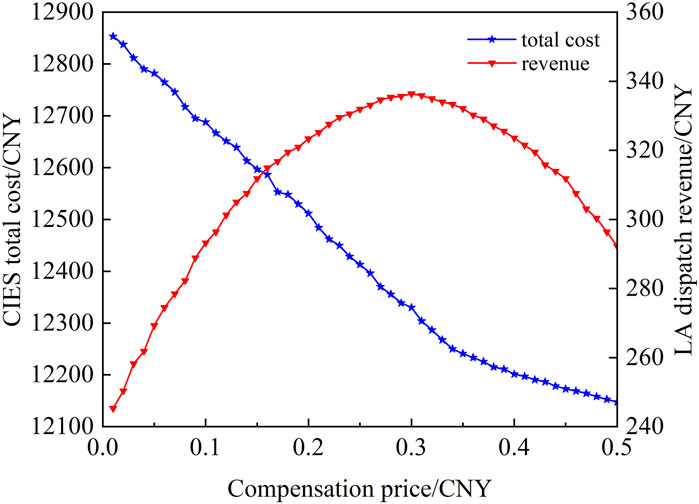
FIGURE 7. CIES total cost and LA scheduling revenue curve.
Figure 7 shows the relationship between compensation price, total system cost, and load aggregator profits. The overall trend of the CIES total cost decreases with an increase in the incentive dispatch compensation price. When the compensation price is 0.34 CNY/kWh, the curve has a turning point and the decreasing trend slows down. Meanwhile, load aggregator scheduling profits first increase and then decrease with an increase in the incentive dispatch compensation price. When the compensation price reaches 0.3 CNY/kWh, the scheduling profits no longer increase with an increase in the compensation price and the curve starts to decrease. This is because in an actual operation, as the compensation price continues to increase, it causes electric vehicles to overreact, exceeding the adjustable range of the LA.
From the aforementioned analysis, it can be seen that it is difficult to determine a value of the compensation price that maximizes the overall benefits of both the CIES and load aggregators. Therefore, a comprehensive benefit indicator is introduced to assess the overall interests, and its comprehensive benefit curve is shown in Figure 8.
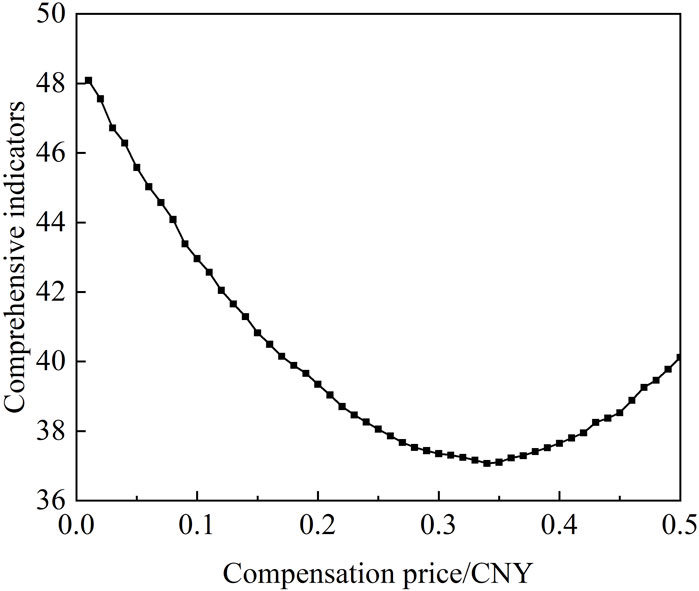
FIGURE 8. CIES and LA comprehensive benefit curve.
From Figure 8, it can be seen that the comprehensive benefit indicator first decreases and then increases with the increase of the compensation price. When the compensation price is 0.34 CNY/kWh, the comprehensive benefit reaches its minimum value. The trend of the comprehensive benefit indicator is consistent with the total cost benefit of the CIES and is opposite to the revenue trend of the load aggregator. That is, as the total cost benefit of the CIES decreases, the comprehensive benefit indicator decreases, while as the revenue of the load aggregator increases, the comprehensive benefit indicator decreases. Therefore, considering both aspects, the system achieves an optimal overall benefit when the compensation price is 0.34 CNY/kWh.
To analyze the economic benefits and wind power curtailment rate of source–load coordinated CIES scheduling, the operation mode of heat-storage electric boilers is controlled by wind power curtailment, with the compensation electricity price set as 0.34 CNY/kWh in the fixed contract strategy. This article designs five case studies for comparative analysis:
Case 1. Without considering the role of heat-storage electric boilers, electric vehicles are charged in a disorderly manner.
Case 2. Considering the role of thermal-storage electric boilers, electric vehicles are charged in a disorderly manner.
Case 3. Without considering the role of heat-storage electric boilers, electric vehicles adopt an improved scheduling strategy.
Case 4. Considering the role of heat-storage electric boilers, electric vehicles adopt an improved scheduling strategy.
Case 5. Considering the role of heat-storage electric boilers, electric vehicles adopt an improved scheduling strategy and introduce a tiered carbon trading mechanism.
Figure 9 shows the wind curtailment situation for each model. Heat-storage electric boilers make full use of the wind power for heating during 1–8 and 24 h, alleviating the heating pressure on CHP units. EVs transfer the charging load during peak electricity consumption periods to the wind power curtailment period through ordered charging and the LA contract strategy, effectively absorbing the curtailed wind power. Through the combined use of heat-storage electric heating and electric vehicles, the curtailed wind power is basically absorbed. Later, a tiered carbon trading mechanism was introduced, allowing P2G to convert CO2 into natural gas for recycling using the curtailed wind power and reducing the system’s carbon emissions and fully absorbing the wind power.
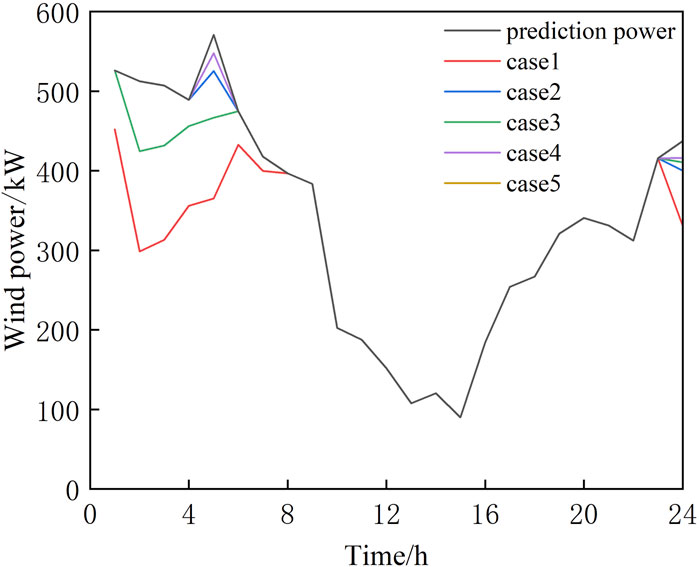
FIGURE 9. CIES wind power accommodation under different models.
Figures 10–12 are the dispatching charts for each unit in case 5. During the electricity price valley periods (24 and 1–8), wind power curtailment occurs in the system. Heat-storage electric boilers are given priority to supply heat and store thermal energy. Any remaining heat demand is met by CHP, while electric chillers are utilized to meet the cooling demand. During this period, the ES is charged and EV charging loads are shifted to this time period through the demand response. During this time, the carbon capture and conversion equipment makes full use of wind-generated electricity with excess CO2 sold to the electricity market to reduce system costs. P2G equipment makes full use of the surplus wind power with the absorbed CO2, while any excess carbon emission quotas are sold to the power market to reduce overall system costs. During the electricity price peak periods (9–11), as the electrical load and cooling load gradually increase, the output of CHP and absorption chillers continues to rise, and ES partially discharges during this stage, with any electrical load shortfalls being met by purchasing power from the main grid. During electricity price flat periods (12–16), the system purchase price is consistently higher than the unit generation cost of microturbines; during this time, the CHP maintains increased generation, with the cooling load primarily being provided by absorption chillers. During electricity price peak periods (17–22), the purchased electricity price is consistently high and the electrical load is greater. In order to reduce the need for external electricity purchases during this period, the ES is fully discharged, and the heat load is provided by CHP and the heat-storage tank. CHP continues to increase production to meet the peak heat demand, and heat-storage electric boilers and P2G equipment are shut down. Under the effect of the demand response, some of the EV charging loads are shifted to the period of low electricity prices, reducing the electricity demand during this period. When various power generation equipment fail to meet the electrical load, the shortage is supplemented by purchasing electricity from the main grid.
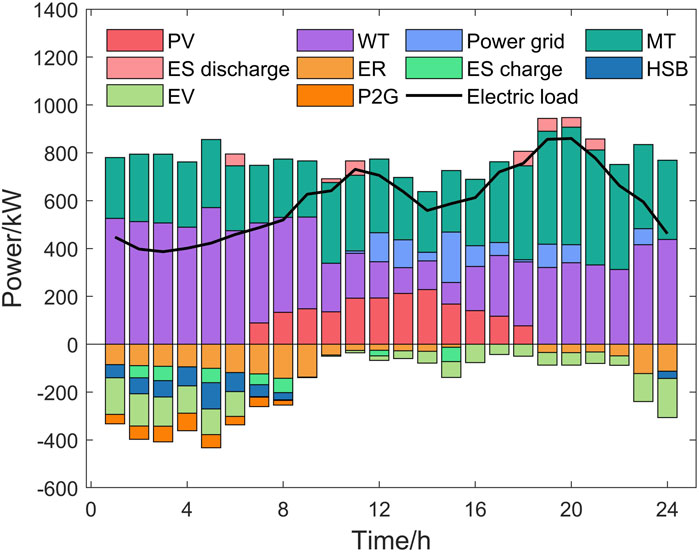
FIGURE 10. Electric load balance state diagram.

FIGURE 11. Heat load balance state diagram.
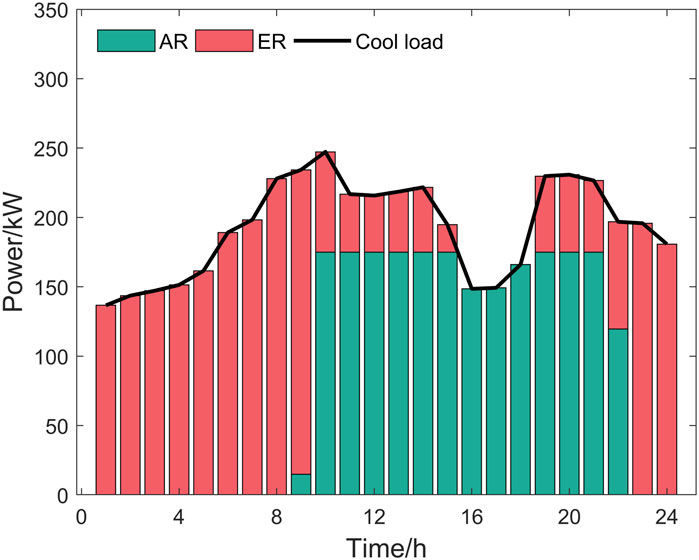
FIGURE 12. Cool load balance state diagram.
As shown in Table 3, compared with single-angle optimization, the system achieved optimal performance in all indicators under the combined effect of a tiered carbon trading mechanism and source–load coordination. The wind power was fully consumed during the dispatch cycle, and the wind power consumption rate increased by 4.07% compared with only considering IDR, which significantly improved the peak shaving effect compared to only allocating heat-storage electric boilers. The total cost decreased by 2764.32 CNY, and the total carbon emissions decreased by 3515.4 kg, thus verifying the effectiveness of the dispatch method proposed in this paper.

TABLE 3. CIES optimization scheduling results of the CIES under different models.
This article proposes a CIES optimization scheduling method for combining heat-storage electric boilers and electric vehicles, in response to the limitations of “with heat to determine electricity” in cogeneration units, large-scale wind abandonment at night, and greenhouse effect issues. The article also introduces a tiered carbon trading mechanism and draws the following conclusions:
(1) The operating mode of the heat-storage electric boiler is closely related to the CIES overall efficiency improvement. When the heat-storage electric boiler is in operating mode 4, the system has the lowest total cost, the lowest carbon emissions, and the highest wind power accommodation rate. This better reflects the advantages of the heat-storage electric heating operation.
(2) Combining the orderly scheduling method with the incentive scheduling method of electric vehicles can fully transfer the charging load. The compensation price is a key parameter that affects the comprehensive efficiency of the system. When the compensation price is 0.34 yuan, the various indicators of the system reach their optimum levels.
(3) With the introduction of a tiered carbon trading mechanism, the coordinated optimization and scheduling of sources and loads enables wind power to be fully consumed, while minimizing total economic costs and carbon emissions.
The proposed scheduling strategy in this paper advances the optimization of integrated energy system scheduling, further considering how to achieve the full integration of renewable energy and reduce carbon emissions from both the supply and demand sides. In-depth research on the thermal-storage electric boiler was conducted to determine its optimal operating mode, and a demand response strategy for electric vehicles was proposed to improve the scheduling level of electric vehicles. However, there are two limitations in this paper: it fails to consider the integration of V2G technology for electric vehicles, and the proposed method lacks verification of its effectiveness in a multi-node power system. These are the two main limitations of this paper and also the points that need to be studied in the future.
The original contributions presented in the study are included in the article/Supplementary Material; further inquiries can be directed to the corresponding author.
YY contributed to the conceptualization, methodology, and writing. XW contributed to software, validation, and reviewing. ZZ contributed to the data and curation. RJ and CZ contributed equally to the editing of the article and discussion. SL contributed to the literature analysis. PY contributed to the paper’s review and grammar revision. All authors contributed to the article and approved the submitted version.
The Science and Technology Planning Project of Xinjiang Uygur Autonomous Region (2022A01007-3).
Author CZ was employed by State Grid Tianjin Electric Power Company Binhai Power Supply Branch. Author ZZ was employed by State Grid Liaoning Marketing Service Center. Author RJ was employed by State Grid Jibei Electric Power Co., Ltd. Chengde Power Supply Company.
The remaining authors declare that the research was conducted in the absence of any commercial or financial relationships that could be construed as a potential conflict of interest.
All claims expressed in this article are solely those of the authors and do not necessarily represent those of their affiliated organizations, or those of the publisher, the editors, and the reviewers. Any product that may be evaluated in this article, or claim that may be made by its manufacturer, is not guaranteed or endorsed by the publisher.
The Supplementary Material for this article can be found online at: https://www.frontiersin.org/articles/10.3389/fenrg.2023.1237781/full#supplementary-material
Al-Ghussain, L., Ahmad, A., Abubaker, A., Mohamed, M., Hassan, M., and Akafuah, N. (2022). Optimal sizing of country-scale renewable energy systems towards green transportation sector in developing countries. Case Stud. Therm. Eng. 39, 102442. doi:10.1016/J.CSITE.2022.102442
Chen, Q., Wang, F., Hodge, B., Zhang, J., Li, Z., Shafie, K., et al. (2017). Dynamic price vector formation model-based automatic demand response strategy for PV-assisted EV charging stations. IEEE Trans. Smart Grid 8 (6), 2903–2915. doi:10.1109/tsg.2017.2693121
Chen, X., Kang, C., Mark, O., Xia, Q., Bai, J., Liu, C., et al. (2015). Increasing the flexibility of combined heat and power for wind power integration in China: modeling and implications. IEEE Trans. Power Syst. - A Publ. Power Eng. Soc. 30 (4), 1848–1857. doi:10.1109/tpwrs.2014.2356723
Chen, X., and Zhang, X. (2019). Secure electricity trading and incentive contract model for electric vehicle based on energy blockchain. IEEE Access 7, 178763–178778. doi:10.1109/access.2019.2958122
Chen, Y., and Chang, J. (2018). Fair demand response with electric vehicles for the cloud based energy management service. IEEE Trans. Smart Grid 9 (1), 458–468. doi:10.1109/tsg.2016.2609738
Cui, J., Luo, W., and Zhou, N. (2018). Research on pricing model and strategy for orderly charging and discharging of electric vehicles based on multi-perspective view. Proc. CSEE 15, 4438–4450+4644. doi:10.13334/j.0258-8013.pcsee.171958
Cui, Y., Jang, T., Zhong, W., Li, H., and Zhao, T. (2020). Source-load coordination economic dispatch method for regional integrated energy system considering wind power accommodation. Power Syst. Technol. doi:10.13335/j.1000-3673.pst.2019.2317
Fan, D., Wang, R., Qi, H., Deng, X., Chen, Y., Liu, T., et al. (2022). Edge intelligence enabled optimal scheduling with distributed price-responsive load for regenerative electric boilers. Front. Energy Res. 10. doi:10.3389/FENRG.2022.976294
Ginigeme, K., and Wang, Z. (2020). Distributed optimal vehicle-to-grid approaches with consideration of battery degradation cost under real-time pricing. IEEE Access 8, 5225–5235. doi:10.1109/access.2019.2963692
Hou, H., Tang, J., Wang, Y., Xia, X., Wang, F., and Hu, P. (2022b). Long-term scheduling of electric vehicle charging and discharging under joint demand response of price and incentives. Autom. Electr. Power Syst. 15, 46–55.
Hou, H., Wang, Y., Zhao, B., Zhang, L., Chen, Y., and Xie, C. (2022a). Electric vehicle load aggregator scheduling strategy under price and incentive demand response. Power Syst. Technol. (04), 1259–1269. doi:10.13335/j.1000-3673.pst.2021.0719
Li, J., Xue, Y., Du, Y., Pan, Z., Zhang, J., Shao, Y., et al. (2023). Coordinated economic dispatch of the primary and secondary heating systems considering the boiler’s supplemental heating. Front. Energy Res. 10. doi:10.3389/FENRG.2022.1005784
Li, J., Zheng, Y., Xiao, X., and Chan, C. (2015). Optimal scheduling for vehicle-to-grid operation with stochastic connection of plug-in electric vehicles to smart grid. Appl. Energy. 146, 150–161. doi:10.1016/j.apenergy.2015.02.030
Liu, S., Gu, X., Yang, S., and Qian, Y. (2023). Can green hydrogen and waste heat utilization improve energy conservation and emission reduction of coal-based cogeneration processes? J. Clean. Prod. 389, 136045. doi:10.1016/J.JCLEPRO.2023.136045
Liu, X., and Wang, L. (2021). The effects of subsidy policy on electric vehicles and the supporting regulatory policies: evidence from micro data of Chinese mobile manufacturers. Front. Energy Res. 9. doi:10.3389/FENRG.2021.642467
Luo, Z., Hu, Z., Song, Y., Yang, X., Zhan, K., and Wu, J. (2011). Striking a balance: modulation of host cell death pathways by legionella pneumophila. Autom. Electr. Power Syst. 2 (14), 36–42. doi:10.3389/fmicb.2011.00036
Tan, H., Li, Z., Wang, Q., and Mohamed, M. (2023). A novel forecast scenario-based robust energy management method for integrated rural energy systems with greenhouses. Appl. Energy 330, 120343. doi:10.1016/J.APENERGY.2022.120343
Tan, H., Yan, W., Ren, Z., Wang, Q., Mohamed, M., and Dai, Y. (2022). A robust dispatch model for integrated electricity and heat networks considering price-based integrated demand response. Energy 239, 121875. doi:10.1016/J.energy.2021.121875
Wang, J., Shahidehpour, M., and Li, Z. (2008). Security-constrained unit commitment with volatile wind power generation. IEEE Trans. Power Syst. - A Publ. Power Eng. Soc. 23 (3), 1319–1327. doi:10.1109/tpwrs.2008.926719
Wu, Z. (2021). Research on optimal scheduling of distribution network with distributed power generation under V2G mode. Nanchang University. doi:10.27232/d.cnki.gnchu.2021.002999
Yang, L., Zhang, X., and Gao, P. (2018). Research on heat and electricity coordinated dispatch model for better integration of wind power based on electric boiler with thermal storage. IET Gener. Transm. Distrib. 15, 3736–3743. doi:10.1049/iet-gtd.2017.2032
Yu, S., Du, Z., and Chen, L. (2022). Optimal regulation strategy of electric vehicle charging and discharging based on dynamic regional dispatching price. Front. Energy Res. 10. doi:10.3389/FENRG.2022.873262
Zhang, Y. (2022). Joint optimization method of electric boiler, heat storage device, CHP and wind power under market environment. J. Phys. Conf. Ser. 1, 012014. doi:10.1088/1742-6596/2409/1/012014
Zhao, P., Wang, P., Xu, P., Zhang, W., Wang, J., and Dai, Y. (2021). The survey of the combined heat and compressed air energy storage (CH-CAES) system with dual power levels turbomachinery configuration for wind power peak shaving based spectral analysis. Energy 215, 119167. doi:10.1016/j.energy.2020.119167
Keywords: community integrated energy system, source–load coordination, heat-storage electric boilers, electric vehicles, price-based demand response, incentive-based demand response, tiered carbon trading mechanism
Citation: Yang Y, Wu X, Zhang Z, Jin R, Zhang C, Li S and Yi P (2023) Integrated energy system optimization and scheduling method considering the source and load coordinated scheduling of thermal-storage electric boilers and electric vehicles. Front. Energy Res. 11:1237781. doi: 10.3389/fenrg.2023.1237781
Received: 10 June 2023; Accepted: 01 September 2023;
Published: 18 September 2023.
Edited by:
Yue Wang, Cummins, United StatesCopyright © 2023 Yang, Wu, Zhang, Jin, Zhang, Li and Yi. This is an open-access article distributed under the terms of the Creative Commons Attribution License (CC BY). The use, distribution or reproduction in other forums is permitted, provided the original author(s) and the copyright owner(s) are credited and that the original publication in this journal is cited, in accordance with accepted academic practice. No use, distribution or reproduction is permitted which does not comply with these terms.
*Correspondence: Xinge Wu, NTI2NDg0NTZAcXEuY29t
Disclaimer: All claims expressed in this article are solely those of the authors and do not necessarily represent those of their affiliated organizations, or those of the publisher, the editors and the reviewers. Any product that may be evaluated in this article or claim that may be made by its manufacturer is not guaranteed or endorsed by the publisher.
Research integrity at Frontiers
Learn more about the work of our research integrity team to safeguard the quality of each article we publish.