 Zili Xi
 Huanxue Pan
- School of Economics and Management, Beijing Forestry University, Beijing, China
Introduction: Carbon futures market plays an important role in energy conservation and emission reduction of energy-intensive firms, and its efficiency is largely reflected by the dynamic relationship between carbon spot and futures prices. Even though the EU carbon futures market has undergone three phases, its efficiency in Phase Ⅱ still contains much controversy.
Methods: Based on the cost-of-carry model, we apply linear and nonlinear Granger causality test, vector error correction model and threshold vector error correction model to re-examine the efficiency of the carbon futures market in the second phase of the European Union Emissions Trading System from the perspectives of price discovery and intertemporal arbitrage.
Results: i) the EU carbon futures market has the function of price discovery by virtue of the broad scope of participants and the consequent huge liquidity, suggesting that the carbon futures price can predict the carbon spot price; ii) the coefficient requirement of the cost-of-carry model is satisfied and the relationship between the European Union Allowance (EUA) futures and spot prices is consistent with the cost-of-carry model, which indicates that the former is an unbiased estimator of the latter and an equilibrium relationship exists between the two prices so that the carbon futures market is efficient in the long run; iii) however, the carbon futures market shows inefficiency in the short run since it has an error correction function only when the basis is less than −0.07 and the carbon futures price indicates a remarkably slow adjustment to the long-run equilibrium when there is deviation, which can be ascribed to the global financial crisis as well as its aftermath in 2008.
Discussion: In the context of global warming and carbon neutrality, the results of this paper are of great significance to emitters, arbitrageurs, hedgers and policymakers in emerging and young carbon markets.
1 Introduction
The Club of Rome’s “Limits to Growth” described a picture in which humankind’s constant pursuit of economic growth and higher living standards has infinitely approached or even exceeded the carrying capacity or limits of the natural environment. Nowadays, global warming is the most serious environmental problem confronting humanity. Stern (2008) points out that the greenhouse effect might be as harmful as the Great Depression and World War. In December 1997, the Kyoto Protocol was signed in Tokyo. It gave rise to such carbon trading markets as the European Union Emissions Trading System (EU-ETS), thereby promoting the development of international carbon trading and carbon finance (Calvet et al., 2022; Demiralay et al., 2022). At present, the EU-ETS has become the most representative carbon market in the world (Ahonen et al., 2022). Apart from carbon spot, carbon financial derivatives, including carbon futures and carbon options, have also been designed and traded (Ren et al., 2022), among which the trading volumes of carbon futures account for over 90% of the entire market, reflecting a strong desire of market participants for hedging and speculation (Feng and Wang, 2023).
In the EU, firms’ carbon emissions are not supposed to exceed carbon allowances they hold. Otherwise, firms have to buy extra carbon permits. In order to ensure production ongoing and avoid flux of carbon spot prices, firms have to make decisions in the carbon spot market based on the trends of carbon futures prices. Accordingly, it is of great significance whether the EU carbon futures market behaves efficiently. From Phase Ⅰ onwards, the relationship between prices of carbon futures and spot and resulting price discovery have become the focus of scholars. Wagner and Uhrig-Homburg (2009) point out that price discovery generally took place on the EU carbon futures market. Joyeux and Milunovich (2010) investigate the relationship between the prices of EUA (European Union Allowances) spot and three EUA futures contracts expiring in December 2006 December 2007 and December 2008 respectively through cointegration analysis and volatility spillover tests. The results show that only the first two futures contracts contributed to price discovery. However, Phase Ⅰ was seen as the pilot phase, intending to test price formation and gain experience by trial and error. Daskalakis and Markellos (2008) find that the EU carbon futures market was not in line with the weak-form efficiency in Phase Ⅰ by analyzing prices of futures and spot in three exchanges, which means that investors could use past information to gain excess returns. In addition, due to thin trading and the immaturity of the EU carbon market, Montagnoli and de Vries (2010) suggest that the EU-ETS was inefficient in Phase Ⅰ but efficient in the first 2 years of Phase Ⅱ through the variance ratio test. The equilibrium relationship between prices of spot and futures was also highly susceptible to policies. In the early stages, the European Commission stipulated that any unused surplus of carbon allowances in Phase Ⅰ could not be preserved and transferred to Phase Ⅱ for future compliance. In line with Daskalakis et al. (2009), the restriction on interphase banking of allowances caused difficulties for hedgers and arbitrageurs, and consequently the price as well as liquidity decreased drastically. By using a VAR model, Chevallier (2010) also finds that such restriction in Phase Ⅰ did disrupt the long-term equilibrium relationship between prices of carbon spot and futures. Meanwhile, the global financial crisis in 2007 impacted on the EU carbon market, with the relationship between the prices of carbon spot and futures broken (Bredin and Parsons, 2016).
For Phase Ⅱ, Rittler (2012) finds that the EU carbon futures market played the role of price discovery both in the short and long run by using daily data of the ICE. Based on a sample of 17 EUA contracts from March 2006 to December 2011, Tang et al. (2013) argue that the carbon futures market was highly efficient within 1 month. Daskalakis (2013) claims that the EU carbon futures market was weak-form efficient from 2010 onwards by investigating four EUA carbon futures contracts traded on the Intercontinental Exchange (ICE) from 2008 to 2011. However, after taking structural breaks into account, Charles et al. (2013) study four carbon futures contracts on three main exchanges between 2009 and 2012 and find that the EU carbon futures market was inefficient, even though carbon futures prices were cointegrated with Euribo swap rates and spot prices. Under such circumstances, investors can benefit from arbitrage activities. In addition, Krishnamurti and Hoque (2011) test the market efficiency from the perspective of options on carbon allowances between 2008 and 2010. Employing the put-call parity approach, the two authors claim that options with both short and long maturity on the European Energy Exchange (EEX) were priced efficiently, which implies that firms could manage CO2 emissions by carbon options.
Overall, the EU carbon market was found to be inefficient in Phase Ⅰ (Daskalakis and Markellos, 2008; Wagner and Uhrig-Homburg, 2009; Joyeux and Milunovich, 2010; Bredin and Parsons, 2016), and the inefficiency was consistent with scholars’ presumption since there was no country or region from which the EU could take a lesson. At the end of Phase Ⅰ, the EU Committee realized the problem facing the EU carbon market, making Phase Ⅱ the first time when the method for acquiring carbon allowances changed from free allocation to auctioning. In addition, many of the world’s emerging carbon markets such as China are just getting started and are experiencing what the EU carbon market was experiencing in Phase Ⅱ (Chen et al., 2021; Wu and Qin, 2021), and their governments are considering whether they should increase the proportion of carbon auctioning. Given this, the efficiency of the EU carbon futures market is of great significance to emitters, arbitrageurs, hedgers and policymakers in these countries, and it deserves being further analyzed.
However, in terms of current research, there still exists controversy over its efficiency in Phase Ⅱ as it is mentioned above. Even though the EU carbon market has undergone three phases, some scholars (Charles et al., 2013; Krishnamurti and Hoque, 2011; Crossland et al., 2013) still believe that if the market was proved to be efficient in Phase Ⅱ, it would still be efficient all the way, and there is no need to further test the market efficiency in Phase Ⅲ or Phase Ⅳ. Meanwhile, the aforementioned researches still show some limitations. The primary function of futures is to forecast or discover prices in the spot market. Accordingly, a point of departure for testing the market efficiency should be the relationship between carbon spot and futures prices. Although some researches on Phase Ⅰ indeed follow this point (Daskalakis and Markellos, 2008; Chevallier, 2010; Joyeux and Milunovic, 2010), it is omitted by those on Phase Ⅱ and Ⅲ (Rittler, 2012; Charles et al., 2013; Tang et al., 2013; Stefan and Wellenreuther, 2020; Ghazani and Jafari, 2021). The latter mainly focus on the performance of certain carbon futures contracts but pay no attention to the two price series, thus severing the inherent link between the two prices and disregarding the original intention of establishing the EU carbon futures market. Furthermore, previous studies assume that the prices of carbon spot and futures are ideally linearly correlated (Daskalakis and Markellos, 2008; Chevallier, 2010; Joyeux and Milunovic, 2010). Nevertheless, there is convincing evidence of significant nonlinearities in the relationship between spot and futures prices in the EU carbon market (Arouri et al., 2012; Chen et al., 2020; Liu et al., 2020). As a consequence, linear econometric approaches might become invalid. The role of arbitrageurs, an important driver of carbon futures prices, are also not considered. This paper aims to re-examine the efficiency of the EU carbon futures market in Phase Ⅱ and it extends the existing literature mainly in four ways. First, to the best of our knowledge, it is the first paper that tests the efficiency of the EU carbon futures market in Phase Ⅱ by linking carbon spot and futures prices. Second, based on the cost-of-carry model, in addition to price discovery, it highlights the important role of arbitrageurs who are neglected by scholars in the EU carbon market and analyzes the efficiency of intertemporal arbitrage between carbon spot and futures markets which has not been studied yet to the best of our knowledge. Third, given the existent nonlinear relationship between carbon spot and futures prices, the nonlinear Granger causality test and the threshold vector error correction model are specified to test the market efficiency under nonlinearities in order to render the results more reliable, bridging the gap of current studies only assuming an ideal linear relationship between the two prices in the EU carbon market. Fourth, our paper provides meaningful policy implications for emerging carbon markets and their governments across the globe.
The remainder of this paper is structured as follows: Section 2 provides the theoretical model, linear and nonlinear econometric approaches; Section 3 describes the data and implements preliminary statistical tests; Section 4 reports the results of empirical analysis and discusses the results; Section 5 concludes.
2 Theoretical model and econometric approaches
2.1 The cost-of-carry model
In an efficient market, prices immediately and fully reflect all available information in the market and investors are unable to gain excess returns (Fama, 1970). In the Efficient Market Hypothesis (EMH), the weak form, where investors cannot profit from historical prices, is the most widely studied (Fama, 1991; Wu and Qin, 2021). In terms of futures markets, the efficiency largely depends on the extent to which futures prices predict spot prices (Cagli et al., 2019). If a futures market is efficient, the futures prices are able to provide unbiased forecast of the forward spot prices, i.e., the futures market has a price discovery function. In an efficient futures market, a long-run equilibrium relationship between the prices of the futures and spot is supposed to exist, with the both moving in tandem and responding to information in the market immediately. Under such circumstances, there are no arbitrage opportunities in the market. When the two prices deviate from the equilibrium, arbitrageurs who attempt to obtain risk-free profits by virtue of the substitutability between spot and futures emerge as a consequence (Schwarz and Szakmary, 1994). The increasing arbitrage activities actually reduce the arbitrage opportunities in the market by affecting the supply and demand. Therefore, arbitrage opportunities are not everlasting. In this paper, the cost-of-carry model, which postulates that there is no arbitrage in the market and investors are risk-neutral, is specified to examine the equilibrium relationship between the prices of carbon futures and spot. The model is defined as follows:
Ft and St are the prices of futures and spot respectively; r is the risk-free interest rate; c denotes the storage costs; y represents the convenience yield, namely, the benefits of holding physical commodities; t and T are the starting and expiration date of the futures contracts respectively. However, owing to the fact that c and y are not directly observable, Eq. 1 is hard to test in empirical studies (Arouri et al., 2013). At the same time, unlike commodity futures, carbon allowances do not have storage costs and holding them does not provide convenience yields (Daskalakis et al., 2009; Bredin and Parsons, 2016). Therefore, as Wang and Ke (2005), Arouri et al. (2013) and Nick (2016) suggest, Eq. 2 is used for the test of Fama (1991), Fama (1970) weak-form efficiency hypothesis.
where
2.2 Econometric approaches
2.2.1 Linear and nonlinear Granger causality test
The long-run equilibrium relationship between futures and spot prices is only a necessary rather than sufficient condition for market efficiency (Wang and Ke, 2005; Cagli et al., 2019). Meanwhile, even though the cost-of-carry model can well describe the relationship between futures and spot prices, it fails to identify the lead-lag relationship between the two (Cagli et al., 2019). In other words, it cannot identify the price discovery function of futures. Granger causality representation indicates that if variables are cointegrated, a unidirectional or bidirectional causality should exist. Accordingly, this paper utilizes the Granger causality test to examine price discovery and the efficiency of the EU carbon futures market.
The Granger causality test is based on a vector autoregressive model, but it is only applicable to the case where series are linearly related (Granger, 1969). Thus, it is also known as the linear Granger causality test. The bivariate expression is shown below:
However, with the progress of nonlinear studies, there is convincing evidence of significant nonlinearities in the relationship between spot and futures prices. In terms of the EU carbon market, such nonlinear relationship between the two prices has been confirmed (Chevallier, 2011; Arouri et al., 2012; Chen et al., 2020; Liu et al., 2020), which can be ascribed to economic cycles, policy uncertainties and market microstructure including transaction costs, asymmetric information as well as heterogeneity of market participants (Bekiros and Diks, 2008; Frino et al., 2010; Mizrach and Otsubo, 2014; Ye et al., 2021; Dou et al., 2022). The linear Granger causality test is incapable of identifying the nonlinear interaction between carbon futures and spot markets, and as a consequence the results could be biased. In order to examine the price discovery of the EU carbon futures comprehensively and accurately, the nonlinearities should be taken into account. In this paper, we adopt the nonlinear Granger causality test of Diks and Panchenko (2006), which modifies the over-rejection problem of the test of Hiemstra and Jones (1994). The method of Diks and Panchenko (2006) examines whether the current conditional distribution of one variable is predictive of the future conditional distribution of the other variable. From an economic viewpoint, their method allows for an empirical analysis of the nonlinear relationship between two markets caused by transaction costs and asymmetric information.
Suppose that Xt and Yt are two scalar-valued strictly stationary time series. In a nonparametric setting, the null hypothesis of absent Granger causality can be stated as Yt+1 is conditionally independent on Xt, Xt-1, … , Xt-lX, which can be expressed as:
where
Diks and Panchenko (2006) also imply that the null hypothesis can be rewritten as:
Let
where εn is the bandwidth that depends on the sample size n, and
For lX = lY = 1, when
where Sn is an estimator of the asymptotic variance of Tn(·) and
2.2.2 VECM and TVECM
As it is discussed above, the cost-of-carry model defines a long-run equilibrium relationship between futures and spot prices. Nevertheless, even if the futures market appears to be efficient in the long run, it might still exhibit short-run inefficiencies marked by transient deviations from the long-run equilibrium that are not instantaneously eliminated by arbitrageurs (Arouri et al., 2013). The following vector error correction model (VECM) is usually used to test the short-run efficiency of the futures and spot market.
where α is the adjustment or error correction coefficient reflecting and measuring the speed of prices reverting to the long-run equilibrium after transitory deviations. The larger the value of α in absolute terms, the faster the market corrects its deviation from equilibrium so that the faster arbitrage opportunities disappear in the market (Wang and Ke, 2005). Thus, it is of great interest of the analysis and can be used to evaluate the efficiency of intertemporal arbitrage.
The above VECM is still based on the assumption that variables are linearly correlated in the process of error correction, which means that arbitrage arises immediately in the market as soon as there are deviations from the long-run equilibrium no matter how small they are (Nick, 2016). The VECM hence actually ignores the existence of market frictions and imperfections in any form. However, the elimination of arbitrage opportunities can be subject to substantial transaction costs and market imperfections (MacKinlay and Ramaswamy, 1988). Accordingly, intertemporal arbitrage activity only arises when the benefits of arbitrage outnumber transaction costs or when deviations from the long-run equilibrium exceed a specific threshold (Li, 2010), consequently giving rise to a band of no arbitrage. It is obvious that there is a nonlinear relationship between the variables in this case.
Since transaction costs cannot be directly observed, the measurement needs to be implemented by means of econometric models. The threshold vector error correction model (TVECM) proposed by Hansen and Seo (2002) is specified to investigate the intertemporal arbitrage between the EU carbon futures and spot markets in the context of the nonlinearity. The TVECM has been proved to be highly effective in detecting the arbitrage dynamics between financial futures and spot markets (Li, 2010). A two-regime TVECM with one threshold is given below:
Where
3 Data description and preliminary analysis
3.1 Data description
The EU-ETS is the largest emission trading scheme worldwide both in terms of allowances traded and the number of installations covered (Krishnamurti and Hoque, 2011). Given the restrictions on the use of CERs by the European Commission and the dominance of EUA futures in the market, the daily closing prices of EUA futures and spot from the ICE and Bloomberg are sampled. The price series span from January 2009 to December 2012 with a size of 997 observations after excluding those with inconsistent trading days and are expressed in Euros1. The trends of the EUA futures and spot prices are shown in Figure 1. It is noticeable that the two series almost move consistently during the period, suggesting a potential cointegration relationship between them. The returns of EUA carbon futures and spot are defined as RS = 100*[ln (St)—ln (St-1)] and RF = 100*[ln (Ft)—ln (Ft-1)], respectively.
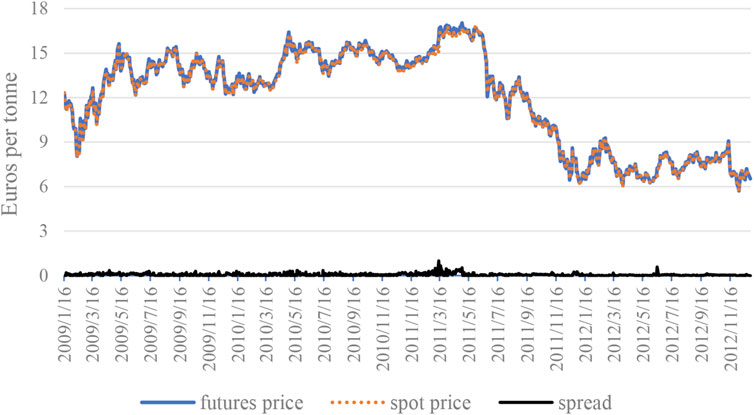
FIGURE 1. The trends of EUA futures and spot prices.
The descriptive statistics are shown in Table 1. Carbon futures and spot prices range between 5.7 and 17 euros per metric ton, and the mean value of the two price series is 12 and 11 euros per metric ton, respectively. The returns of carbon futures and spot vary between −0.11% and 0.2% and the average returns approximately equal −0.0006%. Additionally, the skewness and kurtosis coefficients show an asymmetric and leptokurtic distribution of returns, which is confirmed by the highly statistically significant Jarque-Bera results and indicates the typical feature of financial assets alike.
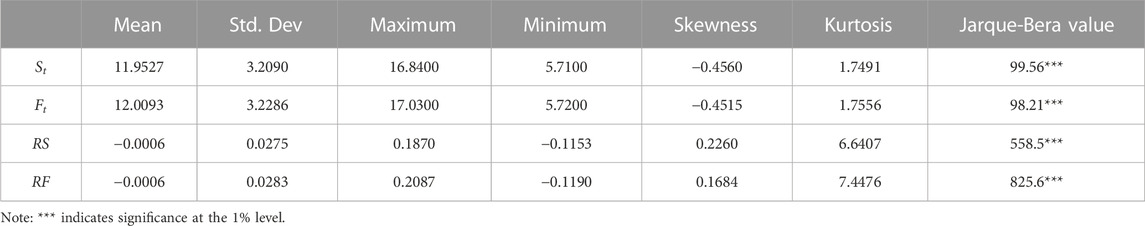
TABLE 1. Descriptive statistics.
3.2 Preliminary data analysis
Given that the analysis of time series should be based on the premise of stationarity, and price discovery as well as intertemporal arbitrage should be based on the cointegration relationship between price series, this section conducts the unit root tests and Johansen cointegration test on EUA futures and spot prices.
As can be seen from Table 2, we apply three methods to test the unit root, namely, the Augmented Dicky-Fuller (ADF), Kwiatkowski-Phillips-Schmidt-Shin (KPSS) and Phillips-Perron (PP) tests. It shows that both spot and futures prices are non-stationary in levels, but they are stationary in the first difference. Thus, both prices are first-order integrated. Table 3 shows that there exists a cointegration relationship between the two prices, which is consonant with the cost-of-carry model.

TABLE 2. Results of the unit root tests.

TABLE 3. Results of the Johansen test.
4 Empirical results and discussion
4.1 Empirical results
4.1.1 Price discovery
The cointegration relationship between EUA futures and spot prices is only a necessary condition for market efficiency, and it cannot indicate the existence of economic causality between the variables (Wang and Ke, 2005; Cagli et al., 2019). According to Eqs 3, 4, the results of the linear Granger causality test are presented in Table 4. There only exists a unidirectional causality from the futures price to the spot price, i.e., price discovery takes place on the EUA futures market, which is also consistent with the cost-of-carry model. In view of the potential nonlinear relationship between the prices of EUA futures and spot, the BDS test is applied to examine the nonlinearity for robustness, and the results evidence its existence. The test of Diks and Panchenko (2006) is a two-step process: first, the original price series are tested to determine whether there is nonlinear causality; second, if the nonlinear causality exists between the variables, the filtered VECM-residuals also need to be tested to check whether such nonlinear causality is strict in nature. Table 5 presents the results of the statistic Tn with a bandwidth value of 1 and lag lengths of 4. As can be seen, the null hypothesis of no nonlinear causality can be rejected in both directions for both original price series and filtered VECM-residuals.
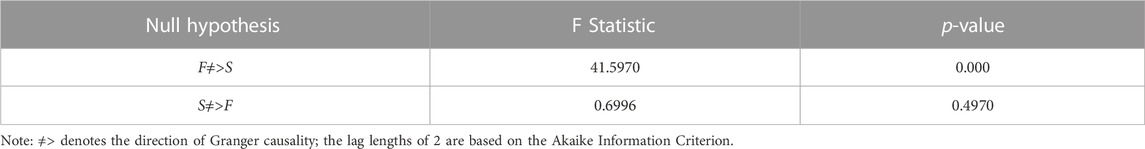
TABLE 4. Results of the Granger causality test.
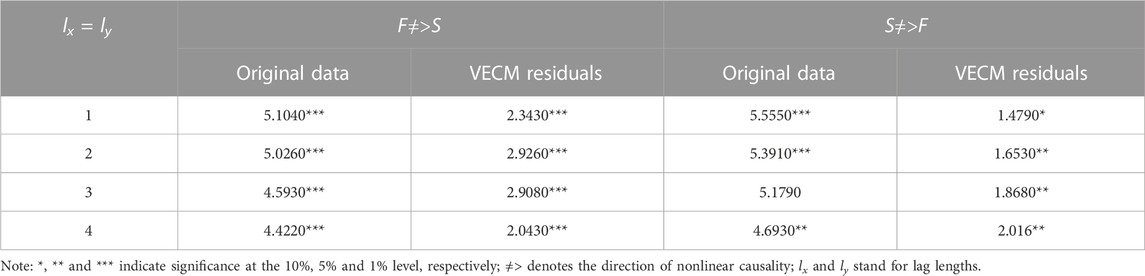
TABLE 5. Results of nonlinear Granger causality test.
4.1.2 Intertemporal arbitrage
In the presence of the cointegration relationship between the prices of EUA carbon futures and spot, the efficiency of the carbon futures market also needs to satisfy the coefficient requirement in Eq. 2. The linear VECM shown in Eqs 11, 12 is applied to investigate the intertemporal arbitrage and the short-run efficiency of the carbon futures market. Table 6 reports the linear cointegrating vector and the error correction coefficients. First, as can be seen, coefficient a is statistically insignificant, but b is statistically significant and close to unity. Second, the error correction coefficient in Eq. 12 is statistically significant and negative. However, the error correction coefficient in Eq. 11 is not statistically significant.

TABLE 6. Cointegrating vector and error correction coefficients.
Given the nonlinear relationship between the price series, the Sup-LM test proposed by Hansen and Seo (2002) is conducted to check whether there is threshold cointegration between the two series. As it is shown in Table 7, the Sup-LM statistic is statistically significant at the 10% level, showing the presence of threshold cointegration and the corresponding cointegrating vector, (1, −1.0057). Since the cointegration coefficient −1.0057 is practically identical to unity, the error correction term can be expressed as
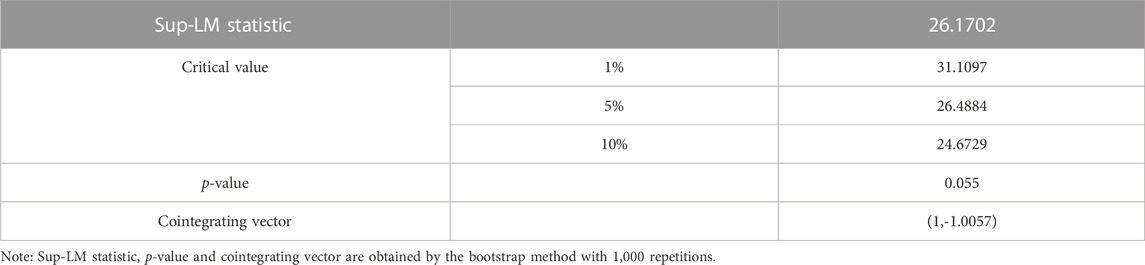
TABLE 7. Threshold cointegration test.
As shown in Figure 2, the optimal threshold value determined by using a grid search is −0.07, which minimizes the OLS sum of squared residuals (SSR) and divides the TVECM into two regimes. The low regime that includes 12.6% observations occurs when the basis is less than −0.07 and the high regime that includes 87.4% observations occurs when the basis is greater than −0.07. The results of the two-regime TVECM with the optimal lag lengths of 2 selected by the Akaike Information Criterion (AIC) are presented in Table 8. The error correction coefficient of carbon futures is statistically significant in the low regime, while only the error correction coefficient of carbon spot is statistically significant in the high regime.

FIGURE 2. Optimal threshold value.
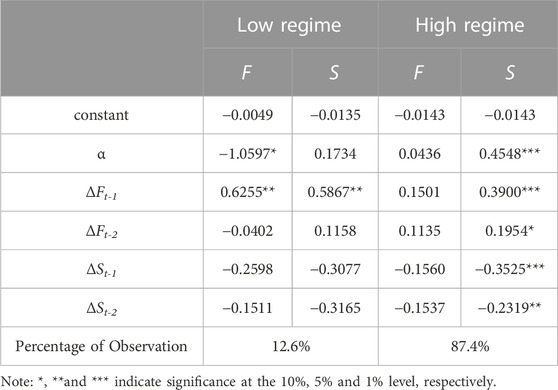
TABLE 8. Results of the two-regime TVECM.
4.2 Discussion
The efficiency of carbon futures market is largely reflected by the dynamic relationship between prices of carbon spot and futures. Based on the cost-of-carry model, linear and nonlinear, vector error correction model and threshold error correction model are specified to test the efficiency of the EU carbon futures market in Phase Ⅱ from the perspective of price discovery and intertemporal arbitrage.
The linear Granger causality test shows that a unidirectional causality from the futures price to the spot price exists. Even though the nonlinear Granger causality test suggests a bilateral causality between the two prices, the nonlinear causal effect from futures to spot is more significant than that from spot to futures. Accordingly, it can be inferred that carbon futures outperform carbon spot in terms of price discovery. This finding also supports the hypothesis proposed by Silvapulle and Moosa (1999) that futures markets are more efficient in processing information than spot markets. In fact, information cannot be simultaneously reflected in both futures and spot markets. It is often reflected in the futures market first and then transmitted to the spot market. It should be noted that changes in the prices of fossil fuels such as coal, crude oil and natural gas can directly affect the carbon spot market, but such impact is limited and carbon futures prices remain highly predictive of future carbon spot prices (Yu et al., 2015; Ahonen et al., 2022; Gong et al., 2023). The price discovery function of the EU carbon futures can be considerably ascribed to the characteristics of futures trading itself and the wide range of market participants. Carbon futures trading is open and centralized in exchanges, and it is characterized by transparency, efficiency and authority with the prices reflecting market forces of demand and supply as well as their expectations. Such attributes enable futures prices to transmit to the spot market swiftly, thereby providing a benchmark for the formation of spot prices. Meanwhile, the margin system allows traders to leverage and close out positions before maturity. As a consequence, futures can be used for speculation and risk hedging and are suitable for those who have no interest in physical delivery. On top of energy-intensive firms, the market participants also consist of financial institutions in large and medium scale, whose trading activities out of arbitrage, hedging or speculation inject enormous liquidity into the EU futures market and thus conduce to the processing of price information (Chordia et al., 2008; Ibikunle et al., 2016; Zhong et al., 2023).
In Eq. 2, Coefficient a is statistically insignificant but b is significant and close to unity. Hence, it can be concluded that the carbon futures price is an unbiased predictor of the future carbon spot price and the carbon futures market is efficient in the long run. The statistically significant and negative error correction coefficient in Eq. 12 is consonant with the mechanism of VECM and indicates the error correction function of the carbon spot market in the short term, i.e., the EUA carbon spot price tends to correct transient deviations from the long-run equilibrium. However, the statistically insignificant error correction coefficient in Eq. 11 implies the EUA carbon futures market does not dynamically adjust to the deviations, and the price does not restore to the long-run equilibrium as a consequence of the shortage of arbitrage activities (Duan et al., 2021). Therefore, the EUA carbon futures market shows inefficiency in the short term. In the meantime, the absolute value of the error correction coefficient of carbon futures is remarkably smaller than the counterpart of carbon spot, which also suggests the low efficiency of intertemporal arbitrage in the carbon futures market. In view of the nonlinear relationship between the price series, the statistically significant coefficient of carbon futures in the low regime indicates that arbitrage activities occur in futures or spot markets when the basis is less or more than −0.07 so that prices can dynamically adjust to the deviation from long-term equilibrium at once. Additionally, the significantly larger error correction coefficients of the carbon spot price in both regimes suggest that the spot market reacts to short-run deviations at a higher rate than the futures market. Overall, the carbon spot market shows high efficiency of intertemporal arbitrage compared to the carbon futures market. Therefore, the basis is supposed to be controlled within a certain range in order that a band of arbitrage exists and two price series maintain the equilibrium relationship in the long run.
One possible explanation for the short-run inefficiency of the EU futures market could be the global financial crisis in 2008 and its resulting aftermath (Bredin and Parsons, 2016). Although the rules of the EU-ETS have remained relatively consistent after Phase Ⅰ (2005–2007), there have been debates over possible changes to the EU carbon system and investors did need to keep abreast of these debates to make optimal decisions. At the beginning of the Phase Ⅱ, global negotiations on controlling carbon emissions collapsed in the wake of the global financial crisis. Global major financial markets, including the EU carbon futures market, were gloomy. A great many financial institutions in Europe which had opened carbon futures trading realized this new line of business yielding disappointing results. Additionally, industries and plants were forced to terminate their production due to financial predicament. As a result, arbitrageurs, who highly value short-run gains, had a pessimistic attitude towards the prospect of carbon futures trading and escaped the EU carbon futures market alike.
5 Conclusion
Global warming has posed an enormous challenge to the human society and economic development. Carbon futures can help energy-intensive enterprises achieve energy conservation and emission reduction. Our paper aims to re-examine the efficiency of the EU carbon futures market in Phase Ⅱ and it extends current literature mainly in four ways. First, it is the first paper that tests the efficiency of the EU carbon futures market in Phase Ⅱ by linking carbon spot and futures prices. Second, in addition to price discovery, it analyzes the efficiency of intertemporal arbitrage between carbon spot and futures markets which has not been studied to the best of our knowledge. Third, we take nonlinearities of the EU carbon market into account and consequently specify nonlinear Granger causality test and threshold vector error correction model, bridging the gap of existing research assuming linear relationship between the two price series. Fourth, our paper provides meaningful policy implications for emerging carbon markets and their governments across the globe. The results of our study are summarized as follows. First, the EU carbon futures market can process information more efficiently than spot market, i.e., price discovery generally takes place on the EU carbon futures market. This can be ascribed to the characteristics of futures trading itself and the wide range of participants in the EU carbon futures market to some extent. Second, the relationship between the prices of EU carbon futures and spot is in line with the cost-of-carry model and the former is an unbiased estimator of the latter, suggesting that there is a long-term equilibrium relationship between the two prices and the EU carbon futures market shows weak-form efficiency in the long run. Third, in view of the nonlinearity, the EU carbon futures market has an error correction function only when the basis is less than −0.07, and the carbon futures price indicates a remarkably slower adjustment to the long-run equilibrium than the spot price, thereby the EU carbon futures market showing low efficiency of intertemporal arbitrage in the short run.
Nowadays, emerging carbon markets are mushrooming across the globe to counteract global warming. However, dependence on the ECX, along with its American counterpart Chicago Climate Exchange (CCX) which has also been tested efficient (Sabbaghi and Sabbaghi, 2017), might not suffice to mitigate global greenhouse effect and combat climate change. Hence, our findings offer the following valuable policy implications for them. First, more industrial sectors including oil refineries, aviation and financial institutions should be incorporated into the carbon trading system in order to diversify the market participants, raise market liquidity and effect price discovery. Second, the governments of emerging carbon markets are supposed to taper off the amount of free carbon allowances and gradually establish the dominance of the allocation method of auctioning, which intends to compel large emitters to realize the incremental value of carbon permits and highlight the scarcity of carbon allowances as well as the role of market. Third, young carbon exchanges should interact and strengthen linkage with such advanced carbon exchanges as the ECX to keep track of the latest dynamics. Fourth, carbon futures trading in these emerging markets should be sufficiently transparent. As the European Commission did in Phase Ⅱ, the governments should demand the exchange to publish trading volumes, transaction amount and historical supply as well as demand of the whole market monthly, so that traders can keep abreast of market information. Also, the governments should limit price fluctuation especially at the early stage of carbon futures trading in order to cushion the impact of potential external shocks or uncertainty on economy. At the same time, the independent Community Independent Trading Log(CITL) should be established to record, check and supervise transactions into and out of accounts, which can effectively decrease risks caused by human error and market manipulation by large institutions.
The data in our study are in level form. However, conditional heteroskedasticity of return series or time-varying volatilities can influence the result of nonlinear Granger causality test. Scholars should take the GARCH effects and time-varying econometric models into account, and analyze the evolution of arbitrage efficiency over time. Meanwhile, scholars should also pay close attention to the impact of exogenous events on the prices or returns of carbon spot and futures, and apply the Event Study Methodology to better identify the lead-lag relationship under a certain contingency.
Data availability statement
The raw data supporting the conclusion of this article will be made available by the authors, without undue reservation.
Author contributions
ZX collected data and wrote the draft of this article. HP and TQ contributed to the conceptualization and draft revision. All authors contributed to the article and approved the submitted version.
Funding
This work is supported by grants from the National Social Science Foundation of China Post-grant Program (Grant No. 20FGLB022), Ministry of Education Humanities and Social Sciences Research Planning Fund Project (Grant No. 20YJA790059) and Social Science Foundation of Beijing (Grant No. 18YJB011).
Conflict of interest
The authors declare that the research was conducted in the absence of any commercial or financial relationships that could be construed as a potential conflict of interest.
Publisher’s note
All claims expressed in this article are solely those of the authors and do not necessarily represent those of their affiliated organizations, or those of the publisher, the editors and the reviewers. Any product that may be evaluated in this article, or claim that may be made by its manufacturer, is not guaranteed or endorsed by the publisher.
Footnotes
1It is noteworthy that the prices of futures and spot are not transformed into logarithm since the transformation depends on the economic theory. The coefficient b in Eq. 2 would denote price elasticity in the logarithmic form, which is not consonant with the cost-of-carry model (Garaffa et al., 2019).
References
Ahonen, E., Corbet, S., Goodell, J. W., Günay, S., and Larkin, C. (2022). Are carbon futures prices stable? New evidence during negative oil. Finance Res. Lett. 47, 102723. doi:10.1016/j.frl.2022.102723
Arouri, M. E. H., Hammoudeh, S., Lahiani, A., and Nguyen, D. K. (2013). On the short- and long-run efficiency of energy and precious metal markets. Energy Econ. 40, 832–844. doi:10.1016/j.eneco.2013.10.004
Arouri, M. E. H., Jawadi, F., and Nguyen, D. K. (2012). Nonlinearities in carbon spot-futures price relationships during Phase II of the EU ETS. Econ. Model. 29, 884–892. doi:10.1016/j.econmod.2011.11.003
Bredin, D., and Parsons, J. (2016). Why is spot carbon so cheap and future carbon so dear? The term structure of carbon prices. Energy J. 37, 83–107. doi:10.5547/01956574.37.3.dbre
Bekiros, S. D., and Diks, C. G. H. (2008). The relationship between crude oil spot and futures prices: cointegration, linear and nonlinear causality. Energy Econ. 30, 2673–2685. doi:10.1016/j.eneco.2008.03.006
Cagli, E. C., Taskin, D., and Evrim Mandaci, P. (2019). The short- and long-run efficiency of energy, precious metals, and base metals markets: evidence from the exponential smooth transition autoregressive models. Energy Econ. 84, 104540. doi:10.1016/j.eneco.2019.104540
Calvet, L., Gianfrate, G., and Uppal, R. (2022). The finance of climate change. J. Corp. Financ. 73, 102162. doi:10.1016/j.jcorpfin.2022.102162
Charles, A., Darné, O., and Fouilloux, J. (2013). Market efficiency in the European carbon markets. Energy Policy 60, 785–792. doi:10.1016/j.enpol.2013.05.036
Chen, H., Liu, Z., Zhang, Y., and Wu, Y. (2020). The linkages of carbon spot-futures: evidence from EU-ETS in the third phase. Sustainability 12, 2517. doi:10.3390/su12062517
Chen, Y., Ba, S., Yang, Q., Yuan, T., Zhao, H., Zhou, M., et al. (2021). Efficiency of China’s carbon market: A case study of hubei pilot market. Energy 222, 119946. doi:10.1016/j.energy.2021.119946
Chevallier, J. (2010). A note on cointegrating and vector autoregressive relationships between CO2 allowances spot and futures prices. Econ. Bull. 30, 1564–1584.
Chevallier, J. (2011). The impact of nonlinearities for carbon markets analyses. Int. Econ. 126–127, 131–150. doi:10.1016/S2110-7017(13)60040-2
Chordia, T., Roll, R., and Subrahmanyam, A. (2008). Liquidity and market efficiency. J. Financ. Econ. 87, 249–268. doi:10.1016/j.jfineco.2007.03.005
Crossland, J., Li, B., and Roca, E. (2013). Is the European union emissions trading scheme (EU ETS)informationally efficient? Evidence from momentum-based trading strategies. Appl. Energy 109, 10–23. doi:10.1016/j.apenergy.2013.03.079
Daskalakis, G., and Markellos, R. N. (2008). Are the European carbon markets efficient. Rev. Futur. Mark. 17, 103–128.
Daskalakis, G. (2013). On the efficiency of the European carbon market: new evidence from phase II. Energy Policy 54, 369–375. doi:10.1016/j.enpol.2012.11.055
Daskalakis, G., Psychoyios, D., and Markellos, R. N. (2009). Modeling CO2 emission allowance prices and derivatives: evidence from the European trading scheme. J. Bank. Financ. 33, 1230–1241. doi:10.1016/j.jbankfin.2009.01.001
Demiralay, S., Gencer, H. G., and Bayraci, S. (2022). Carbon credit futures as an emerging asset: hedging, diversification and downside risks. Energy Econ. 113, 106196. doi:10.1016/j.eneco.2022.106196
Diks, C., and Panchenko, V. (2006). A new statistic and practical guidelines for nonparametric Granger causality testing. J. Econ. Dyn. Control 30, 1647–1669. doi:10.1016/j.jedc.2005.08.008
Dou, Y., Li, Y., Dong, K., and Ren, X. (2022). Dynamic linkages between economic policy uncertainty and the carbon futures market: does covid-19 pandemic matter? Resour. Policy 75, 102455. doi:10.1016/j.resourpol.2021.102455
Duan, K., Ren, X., Shi, Y., Mishra, T., and Yan, C. (2021). The marginal impacts of energy prices on carbon price variations: evidence from a quantile-on-quantile approach. Energy Econ. 95, 105131. doi:10.1016/j.eneco.2021.105131
Fama, E. F. (1970). Efficient capital markets: A review of theory and empirical work. J. Finance 25, 383–417. doi:10.2307/2325486
Fama, E. F. (1991). Efficient capital markets: II. J. Finance 46, 1575–1617. doi:10.1111/j.1540-6261.1991.tb04636.x
Feng, L., and Wang, J. (2023). Random sources correlations and carbon futures pricing. Int. Rev. Financ. Anal. 86, 102529. doi:10.1016/j.irfa.2023.102529
Frino, A., Kruk, J., and Lepone, A. (2010). Liquidity and transaction costs in the European carbon futures market. J. Deriv. Hedge Funds 16, 100–115. doi:10.1057/jdhf.2010.8
Garaffa, R., Szklo, A., Lucena, A. F. P., and Gustavo Ferés, J. (2019). Price adjustments and transaction costs in the European natural gas market. Energy J. 40. doi:10.5547/01956574.40.1.rgar
Ghazani, M., and Jafari, M. (2021). The efficiency of CO2 market in the phase III EU ETS: analyzing in the context of a dynamic approach. Environ. Sci. Pollut. Res. 28, 61080–61095. doi:10.1007/s11356-021-15044-5
Gong, X., Li, M., Guan, K., and Sun, C. (2023). Climate change attention and carbon futures return prediction. J. Futur. Mark. 43, 1261–1288. doi:10.1002/fut.22443
Granger, C. W. J. (1969). Investigating causal relations by econometric models and cross-spectral methods. Econometrica 37, 424–438. doi:10.2307/1912791
Hansen, B. E., and Seo, B. (2002). Testing for two-regime threshold cointegration in vector error-correction models. J. Econ. 110, 293–318. doi:10.1016/S0304-4076(02)00097-0
Hiemstra, C., and Jones, J. D. (1994). Testing for linear and nonlinear granger causality in the stock price-volume relation. J. Finance 49, 1639–1664. doi:10.1111/j.1540-6261.1994.tb04776.x
Ibikunle, G., Gregoriou, A., Hoepner, A. G. F., and Rhodes, M. (2016). Liquidity and market efficiency in the world’s largest carbon market. Br. Acc. Rev. 48, 431–447. doi:10.1016/j.bar.2015.11.001
Joyeux, R., and Milunovich, G. (2010). Testing market efficiency in the EU carbon futures market. Appl. Financ. Econ. 20, 803–809. doi:10.1080/09603101003636220
Krishnamurti, C., and Hoque, A. (2011). Efficiency of European emissions markets: lessons and implications. Energy Policy 39, 6575–6582. doi:10.1016/j.enpol.2011.07.062
Li, M.-Y. L. (2010). Dynamic hedge ratio for stock index futures: application of threshold VECM. Appl. Econ. 42, 1403–1417. doi:10.1080/00036840701721380
Liu, J., Liao, S. F., Huang, Y. Y., and Yan, L. Z. (2020). Research on the dependence of spot and futures prices of EUA based on SV-Copula model. Syst. Eng. - Theory Pract. 40, 1694–1706. doi:10.12011/1000-6788-2019-2742-13
MacKinlay, A. C., and Ramaswamy, K. (1988). Index-futures arbitrage and the behavior of stock index futures prices. Rev. Financ. Stud. 1, 137–158. doi:10.1093/rfs/1.2.137
Mizrach, B., and Otsubo, Y. (2014). The market microstructure of the European climate exchange. J. Bank. Financ. 39, 107–116. doi:10.1016/j.jbankfin.2013.11.001
Montagnoli, A., and de Vries, F. P. (2010). Carbon trading thickness and market efficiency. Energy Econ. 32, 1331–1336. doi:10.1016/j.eneco.2010.04.001
Nick, S. (2016). The informational efficiency of European natural gas hubs: price formation and intertemporal arbitrage. Energy J. 37. doi:10.5547/01956574.37.2.snic
Ren, X., Li, Y., Yan, C., Wen, F., and Lu, Z. (2022). The interrelationship between the carbon market and the green bonds market: evidence from wavelet quantile-on-quantile method. Technol. Forecast. Soc. Chang. 179, 121611. doi:10.1016/j.techfore.2022.121611
Rittler, D. (2012). Price discovery and volatility spillovers in the European union emissions trading scheme: A high-frequency analysis. J. Bank. Financ. 36, 774–785. doi:10.1016/j.jbankfin.2011.09.009
Sabbaghi, O., and Sabbaghi, N. (2017). The Chicago Climate exchange and market efficiency: an empirical analysis. Environ. Econ. Policy Stud. 19, 711–734. doi:10.1007/s10018-016-0171-4
Schwarz, T. V., and Szakmary, A. C. (1994). Price discovery in petroleum markets: arbitrage, cointegration, and the time interval of analysis. J. Futur. Mark. 14, 147–167. doi:10.1002/fut.3990140204
Silvapulle, P., and Moosa, I. A. (1999). The relationship between spot and futures prices: evidence from the crude oil market. J. Futur. Mark. 19, 175–193.
Stefan, M., and Wellenreuther, C. (2020). London vs. Leipzig: price discovery of carbon futures during phase III of the ETS. Econ. Lett. 188, 108990. doi:10.1016/j.econlet.2020.108990
Tang, B., Shen, C., and Gao, C. (2013). The efficiency analysis of the European CO2 futures market. Appl. Energy 112, 1544–1547. doi:10.1016/j.apenergy.2013.02.017
Wagner, M. W., and Uhrig-Homburg, M. (2009). Futures price dynamics of CO2 emission allowances: an empirical Analysis of the trial period. J. Deriv. 17, 73–88. doi:10.3905/jod.2009.17.2.073
Wang, H. H., and Ke, B. (2005). Efficiency tests of agricultural commodity futures markets in China. Aust. J. Agric. Res. Econ. 49, 125–141. doi:10.1111/j.1467-8489.2005.00283.x
Wu, R., and Qin, Z. (2021). Assessing market efficiency and liquidity: evidence from China’s emissions trading scheme pilots. Sci. Total Environ. 769, 144707. doi:10.1016/j.scitotenv.2020.144707
Ye, S., Dai, P.-F., Nguyen, H. T., and Huynh, N. Q. A. (2021). Is the cross-correlation of EU carbon market price with policy uncertainty really being? A multiscale multifractal perspective. J. Environ. Manag. 298, 113490. doi:10.1016/j.jenvman.2021.113490
Yu, L., Li, J., Tang, L., and Wang, S. (2015). Linear and nonlinear granger causality investigation between carbon market and crude oil market: A multi-scale approach. Energy Econ. 51, 300–311. doi:10.1016/j.eneco.2015.07.005
Keywords: carbon futures, market efficiency, nonlinear econometric methods, price discovery, intertemporal arbitrage
Citation: Xi Z, Pan H and Qin T (2023) Re-examining the efficiency of the EU carbon futures market in phase Ⅱ: price discovery and intertemporal arbitrage. Front. Energy Res. 11:1236488. doi: 10.3389/fenrg.2023.1236488
Received: 07 June 2023; Accepted: 28 August 2023;
Published: 12 September 2023.
Edited by:
Monjur Mourshed, Cardiff University, United KingdomReviewed by:
Jie Cao, Changsha University of Science and Technology, ChinaWeibo Xing, University of International Business and Economics, China
Chao Zhang, Beijing Normal University, China
Wu You, Beijing Technology and Business University, China
Copyright © 2023 Xi, Pan and Qin. This is an open-access article distributed under the terms of the Creative Commons Attribution License (CC BY). The use, distribution or reproduction in other forums is permitted, provided the original author(s) and the copyright owner(s) are credited and that the original publication in this journal is cited, in accordance with accepted academic practice. No use, distribution or reproduction is permitted which does not comply with these terms.
*Correspondence: Huanxue Pan, cHJvZmVzc29ycGFuYmpmdUAxMjYuY29t