
94% of researchers rate our articles as excellent or good
Learn more about the work of our research integrity team to safeguard the quality of each article we publish.
Find out more
ORIGINAL RESEARCH article
Front. Energy Res. , 07 August 2023
Sec. Energy Storage
Volume 11 - 2023 | https://doi.org/10.3389/fenrg.2023.1230429
 Ningning Wei
 Minghai Li*
Lithium-ion batteries (LIBs) are plagued by risks of combustion and explosion during thermal runaway (TR), which hinder their broader applications. Currently, there is limited research on thermal runaway experiments for batteries with a capacity exceeding 200 Ah. In this study, a non-commercial 256 Ah prismatic battery was utilized, featuring Li (Ni0.8Mn0.1Co0.1)O2 as the cathode material and silicon-doped graphite as the anode material. The investigation focused on the thermal runaway characteristics of the battery under 100% state of charge (SOC) conditions. Three repetitive thermal runaway experiments were conducted within a 1000L lithium battery constant volume test chamber (AEC) under a nitrogen environment. Temperatures at various points within the battery were recorded during the experiments, and high-speed cameras were employed to capture moments of thermal runaway. The research findings are as follows: 1) The ejection velocity of smoke at the instant of safety valve opening was measured at approximately 140 m/s, while the velocity of the ejected flame was approximately 55 m/s. 2) Within an extremely short time range after safety valve opening, the temperature at the safety valve nozzle reached a peak value of 701.8°C ± 42 C. 3) The average duration of ultra-high-speed ejections was measured at 5.0 ± 1.6 s, high-speed ejections lasted for 11.9 ± 2.7 s, and slow-speed ejections exhibited an average duration of 21.6 ± 3.7 s, resulting in a total ejection duration of 36.2 ± 4.7 s. This study provides valuable insights into the original state of the jetting process during thermal runaway in high-capacity LIBs and offers certain guidance for BTMS design.
In recent years, the utilization of lithium-ion batteries (LIBs) has witnessed an exponential growth rate, attributable to their multifunctional design, which enables their extensive applications across various domains. Lithium-ion batteries are commonly acknowledged for their high energy and power density, lightweight nature, and prolonged lifespan, rendering them increasingly prevalent in portable consumer electronics, electric vehicles, and grid energy storage systems, among others. Consequently, the surge in their utilization has correspondingly amplified the scientific research endeavors focused on lithium-ion batteries (Huang et al., 2023).
As one of the primary energy storage device failures, battery thermal runaway is a potential occurrence in batteries with diverse chemical characteristics (Quintiere, 2021; Wang et al., 2021; Gungor et al., 2022; Rappsilber et al., 2023), leading to severe consequences such as fires and explosions. To address this issue, Battery Thermal Management Systems (BTMS) have emerged as effective solutions for monitoring and controlling battery temperature (Joshi et al., 2023; Kumar Thakur et al., 2023). By real-time monitoring of battery temperature and implementing timely measures to mitigate excessive heat, BTMS ensures that battery temperature remains within an appropriate range, effectively reducing the risk of thermal runaway (Choudhari et al., 2022; Talele et al., 2023). BTMS enables dynamic adjustment of charging and discharging strategies, such as charging current and voltage, based on the battery’s energy density and temperature, thus maintaining safe operating temperatures for the battery (Fan et al., 2023; Feng et al., 2023).
When thermal runaway transpires in lithium-ion batteries, an increasing amount of gas is generated within the battery. Upon reaching a certain pressure threshold, the safety valve of the battery ruptures, leading to ejection phenomena (Finegan et al., 2015). The ejection event in lithium-ion batteries entails the release of thermal runaway byproducts, encompassing not only the jetting flow of emitted gases but also the discharge of liquids and solids from within the battery, forming liquid and solid emissions. The ejected gases constitute a primary combustible material contributing to the formation of fires, while the ejection of high-temperature particles also serves as a potential ignition source for the fires (Li et al., 2019b; Zhang et al., 2019b; Li et al., 2022)。
The assessment of flame temperature in lithium-ion batteries (LIBs) under ambient air conditions represents a commonly employed approach for investigating jetting temperatures (Quintiere, 2022). In a study (Zhang et al., 2020) the behavior of LIB fires was examined, wherein temperature sensors were positioned above a commercially available 50 A h lithium iron phosphate/graphite battery composed of five 10 A h individual cells connected in series. The results indicated the occurrence of several temperature peaks in the vicinity of the fire as it erupted. At 100%, 50%, and 0% state of charge (SOC) of the battery, the highest temperatures above the battery reached 1500°C, 1020°C, and 1091°C, respectively.
In a custom-designed stainless steel cylindrical test chamber, Vijay Somandepalli et al. (Li et al., 2019a) conducted thermal runaway experiments under a nitrogen environment to investigate the quantity and composition of gases released by lithium-ion batteries. The study utilized commercially available 2.1 A h (7.7 Wh nominal) lithium-ion batteries, consisting of a negative electrode with graphite as the active material and a positive electrode with lithium cobalt oxide (LCO) as the active material. The experiments revealed that at 100% state of charge (SOC), the maximum temperature of the enclosed container’s gas was approximately 150°C, significantly lower than the peak temperature on the battery surface (700°C). Similar experiments were performed in reference (Zhang et al., 2020), where the ejection process of thermal runaway products from batteries was studied within a nitrogen-filled enclosed container, and the temperature in the LIB ejection zone was measured. The batteries used in that study were lithium-ion power batteries for electric vehicles with a square housing and a capacity of 50 A h. The results demonstrated that during moderate charging states, two intense ejections occurred, resulting in a sudden temperature drop followed by a rapid increase in the ejection zone’s temperature. The temperature in the ejection zone near the battery safety valve was higher than that away from the valve, with the maximum temperature of the jet reaching around 400°C, yet still lower than the highest temperature on the battery surface (approximately 550°C) (Wang et al., 2022).
After comprehensive analysis, the following conclusions can be drawn: In an open atmospheric environment, due to the combustion of ejected battery materials, the temperature of the ejected materials is relatively high (above 1000°C). Therefore, the main purpose of using this method is to study the fire characteristics of the battery rather than investigating the temperature of the ejected materials before their interaction with the surrounding air. In other words, this method cannot directly provide the original temperature of the ejected materials. The original temperature of the battery ejecta can be obtained in a closed space with an inert atmosphere (Li et al., 2019a; Zhang et al., 2019b).
The objective of this study was to investigate the temperature distribution across the surface of high-capacity nickel-rich batteries and explore the variations in jetting temperatures under inert conditions. A 256 A h non-commercial prismatic cell was employed, with its cathode composed of Li(Ni0.8Co0.1Mn0.1)O2 (the experimental cell being a fresh battery with zero cycles). Within a 1000 L test chamber filled with nitrogen, we initiated thermal runaway in the battery through external heating. The recorded parameters during the experiment included the battery surface temperature (TS), positive electrode column temperature (TP), negative electrode column temperature (TN), safety valve nozzle temperature (TE), chamber pressure (P), and chamber temperature (TA). Furthermore, we utilized the LIB jetting index theory (Zhang et al., 2020) to analyze the heat flow characteristics during ejection, aiming to assess the fire risks associated with high-capacity LIBs. Additionally, the velocity of ejected materials at the moment of safety valve opening was calculated based on high-speed camera footage capturing the jetting flames. The findings of this study contribute to a deeper understanding of the thermal runaway effects in high-capacity LIBs and provide guidance for the storage and transportation of LIBs.
A non-commercial battery with a cathode material of Li(Ni0.8Co0.1Mn0.1)O2 was employed in this study. According to the manufacturer’s specifications, the battery has a rated capacity of 256 Ah and operates at a voltage of 3.65 V. For further detailed information, please refer to Table 1.
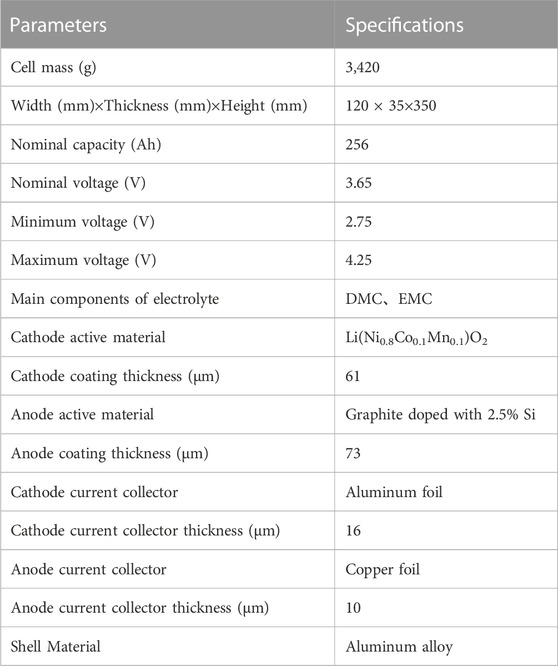
TABLE 1. Detailed technical specifications of the test cell.
The experimental setup employed in this study consists of four main components: the experimental chamber, the heating system, the signal acquisition system, and the inert gas displacement system.
The experimental chamber used in this study is a 1000 L constant-volume adiabatic chamber capable of withstanding a maximum pressure of 2 MPa. It has a maximum axial dimension of 1000 mm with a length-to-diameter ratio of 1:1. The chamber’s door is hydraulically driven, allowing for complete internal sealing.
The heating system comprises a constant power heating plate with a power output of 550W, which is of the same size as the battery, to induce lateral heating for triggering battery thermal runaway. A quartz plate is employed as a thermal insulation pad. Additionally, a battery fixture is utilized to provide preloading force and support.
The signal acquisition system consists of several components. Within the experimental chamber, a pressure sensor (HM90) with an accuracy of ±0.25%FS continuously monitors the pressure (P). A voltage sensor is employed to real-time detect the battery voltage. For temperature monitoring, eight K-type thermocouples (WRNK191) with an accuracy of ±2.5°C or ±0.75% Tabs are strategically placed to measure the temperature at various points within the battery and the ambient environment. Specifically, one thermocouple is positioned at the center of the battery’s large surface to measure the surface temperature (TS), while another thermocouple measures the positive electrode column temperature (TP) and a separate one measures the negative electrode column temperature (TN). Additionally, a thermocouple is positioned 4 cm directly above the battery safety valve to measure the temperature of the jetting region (TE). Three thermocouples are placed at a distance of 40 cm from the battery, at three different locations within the experimental chamber, to measure the ambient temperature (TA1, TA2, and TA3). The average value of the data collected from these three thermocouples provides the ambient average temperature (TA). The sensors operate at a sampling frequency of 10 Hz. Furthermore, the lithium-ion battery’s thermal runaway and jetting process were recorded using a high-speed camera (model: ACS-3) from nac, Japan, at a frame rate of 5,000 frames per second.
The inert gas displacement system operates as follows: Nitrogen gas (N2) is introduced into the experimental chamber through an intake pipeline, while the chamber’s gas is expelled through an exhaust pipeline. A vacuum pump is employed to facilitate the replacement of gases within the chamber. For a comprehensive depiction of the experimental setup, including the detailed configuration (excluding the positions of TN and TP), please refer to Figure 1 and the corresponding references (Zhang et al., 2019a; Yang et al., 2022).
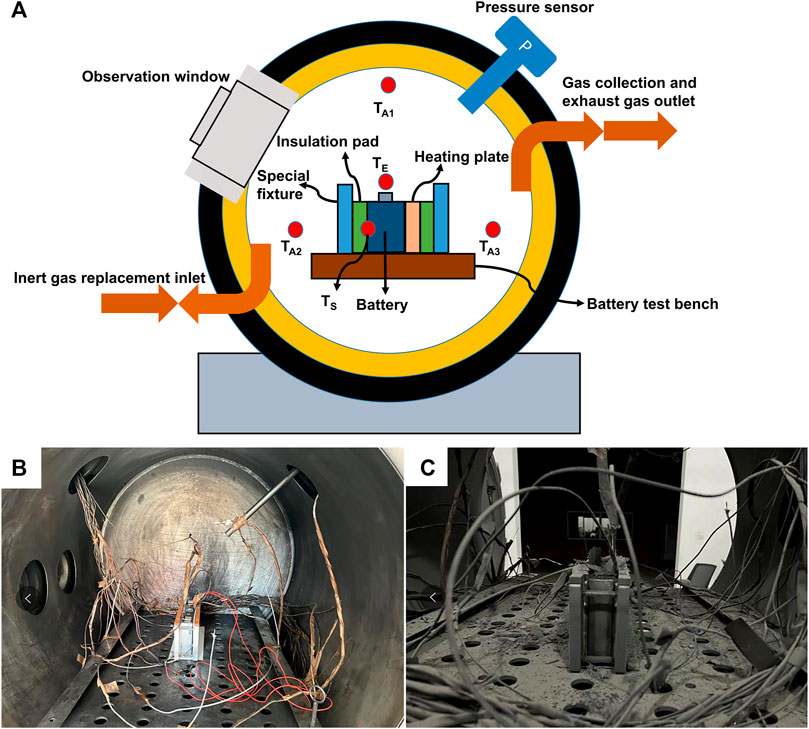
FIGURE 1. (A) Structure diagram of the sealed chamber; (B) Experimental chamber before thermal runaway; (C) Experimental chamber after thermal runaway.
Prior to the commencement of experiments, the battery testing system (NEWARE CT-4008, 5V/6A) was employed to charge the battery under a constant current-constant voltage (CC-CV) mode at 1/3 C rate until reaching 4.25 V. Subsequently, a resting period of 3 h was observed before discharging the battery at a constant current (CC) of 1/3 C rate until reaching 2.75 V. Another resting period of 3 h was then implemented. The same discharge and charge testing procedure was repeated three times. Following this, the battery was charged to 100% state of charge (SOC) using the CCCV mode. Subsequently, a 24-h resting period was allocated for the battery, and its weight was measured to account for any internal heating effects between charging and discharging cycles. Mechanical constraints were applied to the front and rear walls of the battery casing using mica mechanical fixtures. This was done to ensure consistent and controlled conditions during the subsequent experiments.
Experimental Setup: The battery was positioned within the AEC center, and thermocouples were strategically placed and inserted into the heating plates. Simultaneously, the fixture’s preloading force was adjusted accordingly. The experimental fixture structure followed a sequence of metal fixture - thermal insulation pad - heating plate - battery cell - thermal insulation pad-metal fixture, with a thermal insulation pad placed at the bottom of the battery, as illustrated in Figure 1.
Instrumentation Inspection: The heating plate circuitry was examined to ensure proper functionality. The temperature and pressure acquisition systems were also inspected for accurate operation. The AEC chamber door was securely closed, and the vacuuming process was repeated three times, achieving a pressure of 15 kPa, followed by nitrogen injection to reach a residual pressure of 106 kPa, ensuring an oxygen content below 1% within the test environment (confirmed through sampling tests). A 5-min stabilization period was observed after each vacuuming and nitrogen injection cycle to allow the temperature and pressure inside the AEC chamber to reach a stable state.
Thermal Runaway Triggering: The heating device was activated, maintaining a heating rate of 2 °C/min for the heating plate. The occurrence of thermal runaway was determined by the point at which the battery voltage dropped to zero (considered as the onset of thermal runaway in this study). Once thermal runaway was initiated, the heating process was halted, and the moment of thermal runaway was captured using a high-speed camera.
After the completion of the experiment, the remaining portion of the battery (solely the core) was photographed and weighed. Subsequently, it was securely sealed in a sample bag for preservation. Additionally, the ejected materials (including powders, particles, aluminum foils, electrode sheets, etc.) dispersed from the battery were collected and weighed.
During thermal runaway (TR), a substantial amount of combustible substances and gases are generated within the battery. The internal chemical reactions of the battery lead to a gradual increase in temperature and pressure. As the excessive internal pressure accumulates, surpassing the structural stress of the safety valve and the external pressure, valve rupture occurs. Subsequently, a significant quantity of gases and combustible materials is ejected from the battery, resulting in fires and explosions (Fu et al., 2018; Fang et al., 2021).
According to the literature (Wang et al., 2019), The ejection of lithium-ion batteries exhibits four distinct phenomena: (a) smoke emission, (b) spark ejection, (c) flame ejection, and (d) transition from stable combustion to extinguishment. These four phenomena of battery ejection are illustrated in Figure 2 of this study. High-speed cameras were employed to capture photographs and videos of the thermal runaway ejection process of lithium-ion batteries. The total recording time for each experiment using the high-speed cameras was 2.745 s, resulting in a total of 27,449 captured images.
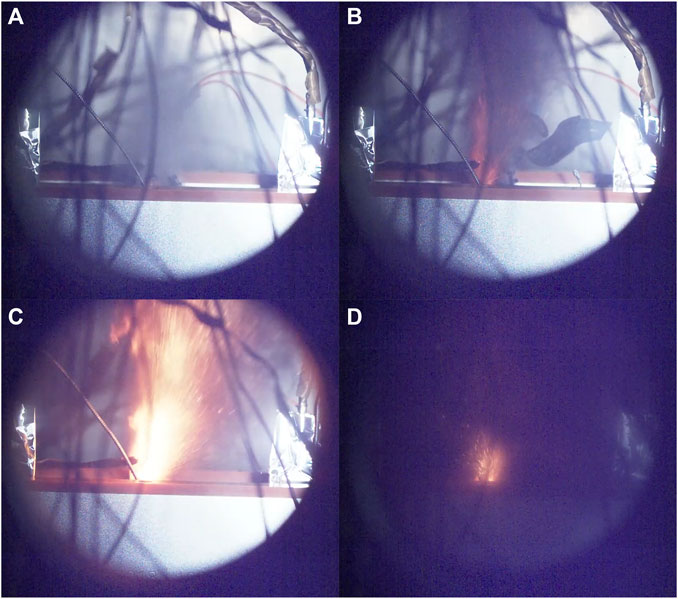
FIGURE 2. TR phenomenon (A) smoke emission, (B) spark ejection, (C) jet flame, (D) transition from stable combustion to extinguishment.
Since the jet flow is ejected vertically upward from the safety release valve, the velocity in the jet region above the battery safety release valve can to some extent reflect the velocity of the jet flow. The photographs captured by the high-speed camera enable the calculation of the ejection velocity of the smoke at the instant when the safety valve opens, as shown in Figure 2A (average velocity within a range of 0.15 m directly above the safety valve), which is approximately 140 m/s. The velocity of the flame ejection in Figure 2C (average velocity within a range of 0.15 m directly above the safety valve) is estimated to be around 55 m/s. These findings indicate that the ejection velocity of the ejected material is significantly higher during the opening of the safety valve compared to subsequent ejections, providing valuable guidance for fire hazard warnings.
The experimental results presented in Figure 3 illustrate the temporal variations of temperature and voltage. In this study, the point at which the voltage drops to zero is considered as the reference point (t = 0) for analysis.
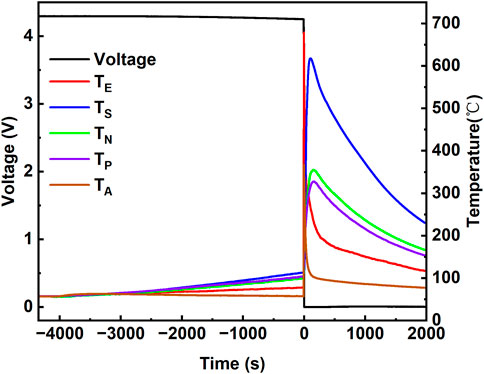
FIGURE 3. Varieties in TE, TS, TP, TN, TA and Battery Voltage vs. time.
Taking the first experiment as an example, the temperature in the jet region above the battery safety release valve can to some extent represent the temperature of the jet. As depicted by the curves in Figure 3, with the progression of time, the temperature TE at the vicinity of the battery safety release valve initially exhibits a steady upward trend under the influence of the heater (approximately 3.5 °C/min). However, at −8.8s, the temperature at the safety valve outlet sharply increases, reaching a maximum value of 679.2°C at −3.1s. The maximum surface temperature of the battery is observed to be 618.1°C at 99.7s. From −6.8s to 25.5s, TE > TS, indicating that the internal temperature of the battery exceeds the melting point temperature of aluminum (660 °C) during thermal runaway. Therefore, the maximum temperature at the safety valve outlet, reaching 679.2°C, signifies that the internal temperature of the battery during thermal runaway exceeds the melting point temperature of aluminum. The disparity in these characteristic temperatures, as indicated in references (Fu et al., 2018; Mao et al., 2020), could be influenced by factors such as ambient pressure, ambient temperature, heating method, battery quantity, and battery type.
Figure 4 presents photographs depicting the battery before and after thermal runaway, clearly showing the melting of aluminum on the battery surface. The measured maximum temperature TE values consistently exceed 660 °C (the melting point temperature of aluminum). In contrast, Figure 3 illustrates that the maximum temperature TS remains below 660 °C. This disparity highlights that the surface temperature of the battery alone cannot fully evaluate the thermal load imposed on the battery pack; the temperature of the jet expelled by the battery should also be taken into consideration.
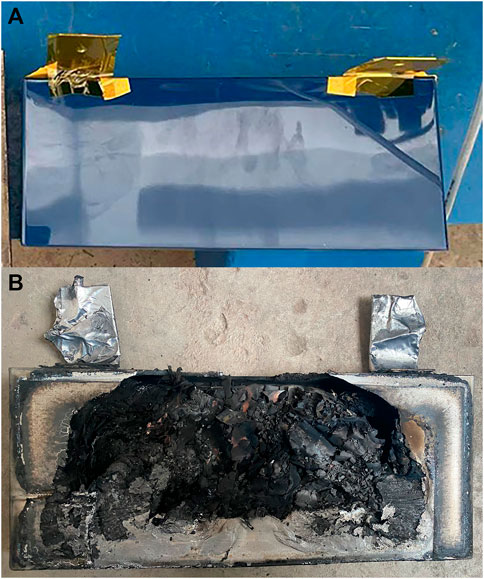
FIGURE 4. Battery photos (A) before thermal runaway (B) after thermal runaway.
The general pattern of pressure increase inside the experimental chamber is presented in literature (Koch et al., 2018). Over time, the chamber pressure initially exhibits a slow and steady rise, attributed to the increase in temperature. Subsequently, there is a rapid surge in chamber pressure, followed by a sharp decline, eventually reaching a nearly constant value. The rate of pressure increase caused by battery venting is closely related to the volume of the experimental chamber. Therefore, it is necessary to normalize the pressure increase rate, which can be achieved through the use of the explosion index (Kg), as expressed in Eq. 1 (Zhang et al., 2020).
(dP/dt)max represents the maximum rate of change of pressure with respect to time during the explosion process within the volume V.
This equation is derived based on an idealized treatment of gas explosions, assuming that the explosion index (Kg) is independent of the laboratory volume. It has found wide application in measuring the severity of gas or dust explosions and has been incorporated into standards by the International Organization for Standardization (ISO) and the British Standards Institution (BSI) (Fang et al., 2021).
The temperature TE above the battery safety release valve, being perpendicular to the jet flow, can serve as an indicator of the original temperature of the expelled materials. The thermal runaway jet primarily occurs within an extremely short time range after the opening of the safety valve. Figure 5 depicts the variations in pressure (P) and TE upon the opening of the safety valve. From Figure 5, the following maximum TE values can be obtained: TE,max (first) = 669.9°C, TE,max (second) = 679.2°C, and TE,max (third) = 733.3°C.
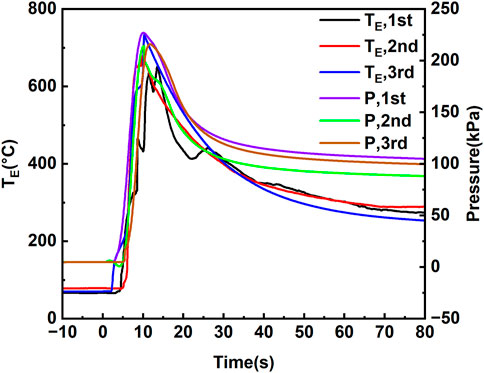
FIGURE 5. Varieties in P and TE vs. time.
To obtain a standardized pressure rise rate curve for LIB (Lithium-Ion Battery) venting, this study adopts the concept of LIB venting index (KLIB) proposed in reference (Wang et al., 2022). Formula (2) is utilized to calculate KLIB, resulting in time-varying curves and pressure profiles presented in Figure 6. In the calculation process, the maximum value of KLIB is determined using Equation 3.
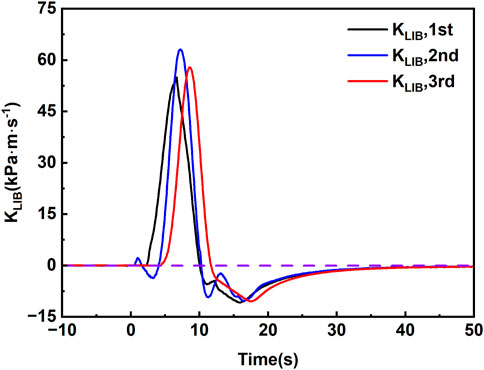
FIGURE 6. Varieties in KLIB vs. time.
Here, dP/dt represents the rate of increase in chamber pressure over time during the LIB eruption process, while V refers to the volume of the sealed chamber.
where KLIB,max refers to the maximum value of KLIB and (dP/dt)max refers to the maximum rate of rise of pressure in the chamber.
In order to quantitatively analyze the ejection process of lithium-ion batteries, this study adopts the following defined time points (Yang et al., 2022): the initiation time of ejection (te) is defined as the time corresponding to the rapid rise of KLIB. The termination time of ultra-high-speed ejection (tu) is defined as the time corresponding to the peak value of KLIB. The termination time of fast ejection (tf) is defined as the time when KLIB transitions from positive to negative. The termination time of slow ejection (ts) is defined as the time when KLIB returns to the initial fluctuating state before ejection. Based on the data presented in Figure 6, this study considers the points where KLIB is greater than 1 as valid data points.
According to the aforementioned definitions, the ejection process of LIB can be categorized into three stages: the ultra-high-speed ejection stage, the fast ejection stage, and the slow ejection stage (Wang et al., 2022). A summary of the various typical time points has been compiled and presented in Table 2.
1) The duration of the ultra-high-speed venting stage (Du) is the time interval from venting initiation (te) to the end of ultra-high-speed venting (tu).
2) The duration of the fast venting stage (Df) is the time interval from the end of ultra-high-speed venting (tu) to the end of fast venting (tf).
3) The duration of the slow venting stage (Ds) is the time interval from the end of fast venting (tf) to the end of slow venting (ts).
4) The total venting duration (De) is the time interval from venting initiation (te) to the end of slow venting (ts).
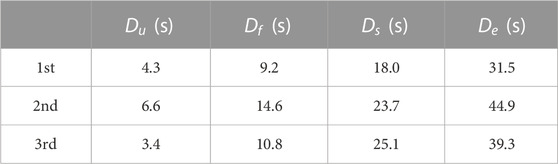
TABLE 2. Timing of the eruption.
In general, for fire studies, the combustion rate of lithium-ion batteries is primarily influenced by the heat release rate from the TR reactions within the battery and the mass ejection rate into the environment. The combustion process is highly complex, as even slight variations in oxygen mass concentration and combustion reaction rate can result in different combustion rates, subsequently affecting the mass loss rate and gas generation (Ding et al., 2022).
Due to the instability of temperature and pressure within the experimental chamber, precise measurement of gas volume can only be achieved under stable conditions. In this study, the gas generation was calculated under stable environmental conditions. During the thermal runaway process, once the gas pressure reaches the release pressure of the safety valve, it opens and releases the internal gases, electrolytes, and active materials, resulting in battery mass loss. The residual mass of the battery was weighed in this study, and the mass loss rate was calculated using Equation 4 (Yang et al., 2022), while the gas generation was determined using Equations 5, 6. The mass loss rate and steady-state gas production are presented in Table 3.
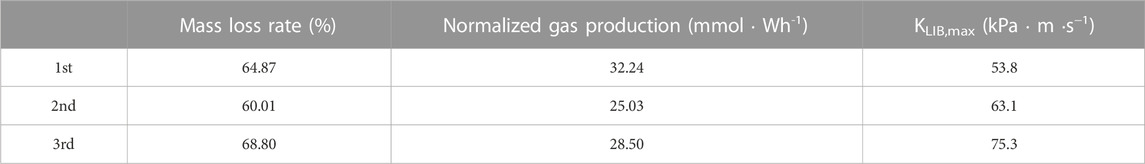
TABLE 3. Presents the results of the thermal runaway analysis.
Within this context, K represents the mass loss rate,
In the context of the aforementioned variables, where n represents gas production, P2 denotes the real-time chamber pressure after TR, V2 represents the volume of the experimental chamber, R represents the ideal gas constant, T2 signifies the stable post-venting chamber temperature, and
The literature (Rappsilber et al., 2023) review encompassed a total of 76 experimental research papers on thermal runaway in lithium-ion batteries published between 2000 and 2021, two papers shared the same cathode material and shape as the batteries used in our study. The referenced papers reported a normalized gas evolution rate of 30.09 mmol Wh-1 (Essl et al., 2020) and 28.16 mmol Wh-1 (Huang et al., 2021), respectively. Interestingly, our study yielded similar results with regards to the normalized gas evolution rate, indicating that the maximum capacity of the battery has minimal impact on this parameter.
This study employed an in situ venting experiment method in an inert environment to investigate the thermal runaway characteristics of a 256Ah lithium-ion battery at 100% state of charge (SOC). The following findings were obtained.
(1) During the thermal runaway event, a significant amount of smoke is rapidly emitted, with the smoke ejection velocity upon the opening of the safety valve estimated at approximately 140 m/s. The velocity of the jet flame is approximately 55 m/s. The pressure curve indicates a single intense ejection event from the battery. The peak values of the temperature in the ejection zone and the velocity of the ejected materials occur at the moment the safety valve opens, providing valuable guidance for thermal hazard warnings.
(2) Within an extremely short time range upon the opening of the safety valve, the temperature at the ejection zone (TE) reaches its maximum value (TE,max = 701.8°C ± 42 °C), while the pressure inside the experimental chamber rapidly increases (KLIB,max = 64.6 ± 10.8 (kPa
(3) The duration of the ultra-high-speed ejection phase was measured to be 5.0 ± 1.6 s, while the high-speed ejection phase lasted for 11.9 ± 2.7 s. The slow-speed ejection phase, on the other hand, extended to 21.6 ± 3.7 s. Overall, the complete ejection process spanned a duration of 36.2 ± 4.7 s, with ejection occurring within a 5-s time frame after a voltage drop of 0. These findings provide valuable insights for the quantitative analysis of the primary jetting process in high-capacity lithium-ion batteries.
The conclusions drawn from this study provide guidance for thermal hazard warning systems, encompassing factors such as battery surface temperature, safety valve nozzle temperature, chamber pressure, chamber temperature, and gas production rate. The findings of this research will serve as a valuable reference for the development and implementation of Battery Thermal Management Systems (BTMS).
The raw data supporting the conclusion of this article will be made available by the authors, without undue reservation.
NW: Conceptualization, Methodology, Software. NW: Data curation, Writing–Original draft preparation. NW: Visualization, Investigation. ML: Supervision. NW: Software, Validation. ML: Writing–Reviewing and Editing. All authors contributed to the article and approved the submitted version.
The authors declare that the research was conducted in the absence of any commercial or financial relationships that could be construed as a potential conflict of interest.
All claims expressed in this article are solely those of the authors and do not necessarily represent those of their affiliated organizations, or those of the publisher, the editors and the reviewers. Any product that may be evaluated in this article, or claim that may be made by its manufacturer, is not guaranteed or endorsed by the publisher.
TS, Cell side surface center temperature, °C; TE, Cell jet zone temperatures near the cell safety valve, °C; TA, Experimental chamber ambient temperature, °C; TR, Thermal runaway; D, Eruption duration; Du, Eruption duration; Df, Fast eruption duration; Ds, Slow eruption duration; tu, End of ultrafast eruption; tf, End of fast eruption; ts, End of slow eruption; te, Start of eruption; DMC, Dimethyl carbonate, C3H6O3; ISO, International Organization for Standardization; HEV, Hybrid electric vehicle; EV, Electric vehicle; AEC, Constant volume adiabatic experimental chamber; PCM, Phase Change Material; t, time; OCV, Open circuit voltage; Kg, Gas explosion index; KLIB, Battery eruption index; LIB, Lithium-ion battery; BMS, Battery management system; BTMS, Battery thermal management system; SOC, State of charge; P, Pressure, kPa; EMC, Methyl ethyl carbonate, C4H8O3; C-rate, The charge and discharge current with respect to its nominal capacity.
Choudhari, V., Dhoble, A. S., and Panchal, S. (2022). Experimental and numerical investigation on thermal characteristics of 2×3 designed battery module. SSRN Electron. J. doi:10.2139/ssrn.4220937
Ding, C., Zhu, N., Yu, J., Li, Y., Sun, X., Liu, C., et al. (2022). Experimental investigation of environmental pressure effects on thermal runaway properties of 21700 lithium-ion batteries with high energy density. Case Stud. Therm. Eng. 38, 102349. doi:10.1016/j.csite.2022.102349
Essl, C., Golubkov, A. W., and Fuchs, A. (2020). Comparing different thermal runaway triggers for two automotive lithium-ion battery cell types. J. Electrochem. Soc. 167, 130542. doi:10.1149/1945-7111/abbe5a
Fan, Y., Wang, Z., Xiong, X., Panchal, S., Fraser, R., and Fowler, M. (2023). Multi-objective optimization design and experimental investigation for a prismatic lithium-ion battery integrated with a multi-stage tesla valve-based cold plate. Processes 11, 1618. doi:10.3390/pr11061618
Fang, J., Cai, J., and He, X. (2021). Experimental study on the vertical thermal runaway propagation in cylindrical Lithium-ion batteries: Effects of spacing and state of charge. Appl. Therm. Eng. 197, 117399. doi:10.1016/j.applthermaleng.2021.117399
Feng, Z., Zhao, J., Guo, C., Panchal, S., Xu, Y., Yuan, J., et al. (2023). Optimization of the cooling performance of symmetric battery thermal management systems at high discharge rates. Energy fuels. 37, 7990–8004. doi:10.1021/acs.energyfuels.3c00690
Finegan, D. P., Scheel, M., Robinson, J. B., Tjaden, B., Hunt, I., Mason, T. J., et al. (2015). In-operando high-speed tomography of lithium-ion batteries during thermal runaway. Nat. Commun. 6, 6924. doi:10.1038/ncomms7924
Fu, Y., Lu, S., Shi, L., Cheng, X., and Zhang, H. (2018). Ignition and combustion characteristics of lithium ion batteries under low atmospheric pressure. Energy 161, 38–45. doi:10.1016/j.energy.2018.06.129
Gungor, S., Cetkin, E., and Lorente, S. (2022). Thermal and electrical characterization of an electric vehicle battery cell, an experimental investigation. Appl. Therm. Eng. 212, 118530. doi:10.1016/j.applthermaleng.2022.118530
Huang, W., Feng, X., Pan, Y., Jin, C., Sun, J., Yao, J., et al. (2023). Early warning of battery failure based on venting signal. J. Energy Storage 59, 106536. doi:10.1016/j.est.2022.106536
Huang, Z., Li, X., Wang, Q., Duan, Q., Li, Y., Li, L., et al. (2021). Experimental investigation on thermal runaway propagation of large format lithium ion battery modules with two cathodes. Int. J. Heat. Mass Transf. 172, 121077. doi:10.1016/j.ijheatmasstransfer.2021.121077
Joshi, A. K., Dandotiya, D., Ramesh, C. S., and Panchal, S. (2023). in Numerical analysis of battery thermal management system using passive cooling technique (Fort Worth, Texas, United States. doi:10.4271/2023-01-0990
Koch, S., Birke, K., and Kuhn, R. (2018). Fast thermal runaway detection for lithium-ion cells in large scale traction batteries. Batteries 4, 16. doi:10.3390/batteries4020016
Kumar Thakur, A., Sathyamurthy, R., Velraj, R., Saidur, R., Pandey, A. K., Ma, Z., et al. (2023). A state-of-the art review on advancing battery thermal management systems for fast-charging. Appl. Therm. Eng. 226, 120303. doi:10.1016/j.applthermaleng.2023.120303
Li, W., Wang, H., Ouyang, M., Xu, C., Lu, L., and Feng, X. (2019a). Theoretical and experimental analysis of the lithium-ion battery thermal runaway process based on the internal combustion engine combustion theory. Energy Convers. Manag. 185, 211–222. doi:10.1016/j.enconman.2019.02.008
Li, W., Wang, H., Zhang, Y., and Ouyang, M. (2019b). Flammability characteristics of the battery vent gas: A case of nca and lfp lithium-ion batteries during external heating abuse. J. Energy Storage 24, 100775. doi:10.1016/j.est.2019.100775
Li, Z., Guo, Y., and Zhang, P. (2022). Effects of the battery enclosure on the thermal behaviors of lithium-ion battery module during thermal runaway propagation by external-heating. J. Energy Storage 48, 104002. doi:10.1016/j.est.2022.104002
Mao, B., Huang, P., Chen, H., Wang, Q., and Sun, J. (2020). Self-heating reaction and thermal runaway criticality of the lithium ion battery. Int. J. Heat. Mass Transf. 149, 119178. doi:10.1016/j.ijheatmasstransfer.2019.119178
Quintiere, J. G. (2021). More on methods to measure the energetics of lithium ion batteries in thermal runaway. Fire Saf. J. 124, 103382. doi:10.1016/j.firesaf.2021.103382
Quintiere, J. G. (2022). On a method to mitigate thermal runaway and propagation in packages of lithium ion batteries. Fire Saf. J. 130, 103573. doi:10.1016/j.firesaf.2022.103573
Rappsilber, T., Yusfi, N., Krüger, S., Hahn, S.-K., Fellinger, T.-P., Krug von Nidda, J., et al. (2023). Meta-analysis of heat release and smoke gas emission during thermal runaway of lithium-ion batteries. J. Energy Storage 60, 106579. doi:10.1016/j.est.2022.106579
Talele, V., Moralı, U., Patil, M. S., Panchal, S., and Mathew, K. (2023). Optimal battery preheating in critical subzero ambient condition using different preheating arrangement and advance pyro linear thermal insulation. Therm. Sci. Eng. Prog. 42, 101908. doi:10.1016/j.tsep.2023.101908
Wang, H., Zhang, Y., Li, W., Gao, Z., Zhang, B., and Ouyang, M. (2022). Experimental study on the cell-jet temperatures of abused prismatic Ni-rich automotive batteries under medium and high states of charge. Appl. Therm. Eng. 202, 117859. doi:10.1016/j.applthermaleng.2021.117859
Wang, Q., Mao, B., Stoliarov, S. I., and Sun, J. (2019). A review of lithium ion battery failure mechanisms and fire prevention strategies. Prog. Energy Combust. Sci. 73, 95–131. doi:10.1016/j.pecs.2019.03.002
Wang, Z., Yuan, J., Zhu, X., Wang, H., Huang, L., Wang, Y., et al. (2021). Overcharge-to-thermal-runaway behavior and safety assessment of commercial lithium-ion cells with different cathode materials: A comparison study. J. Energy Chem. 55, 484–498. doi:10.1016/j.jechem.2020.07.028
Yang, X., Wang, H., Li, M., Li, Y., Li, C., Zhang, Y., et al. (2022). Experimental study on thermal runaway behavior of lithium-ion battery and analysis of combustible limit of gas production. Batter. (Basel). 19, 250. doi:10.3390/batteries8110250
Zhang, Y., Wang, H., Li, W., Li, C., and Ouyang, M. (2020). Quantitative analysis of eruption process of abused prismatic Ni-rich automotive batteries based on in-chamber pressure. J. Energy Storage 31, 101617. doi:10.1016/j.est.2020.101617
Zhang, Y., Wang, H., Li, W., Li, C., and Ouyang, M. (2019b). Size distribution and elemental composition of vent particles from abused prismatic Ni-rich automotive lithium-ion batteries. J. Energy Storage 26, 100991. doi:10.1016/j.est.2019.100991
Keywords: lithium-ion battery, thermal runaway, gas generation analysis, jet, temperature
Citation: Wei N and Li M (2023) Experimental study of thermal runaway process of 256Ah prismatic nickel-rich battery. Front. Energy Res. 11:1230429. doi: 10.3389/fenrg.2023.1230429
Received: 28 May 2023; Accepted: 28 July 2023;
Published: 07 August 2023.
Edited by:
Sandip K. Saha, Indian Institute of Technology Bombay, IndiaReviewed by:
Yuxun Ren, The University of Texas at Austin, United StatesCopyright © 2023 Wei and Li. This is an open-access article distributed under the terms of the Creative Commons Attribution License (CC BY). The use, distribution or reproduction in other forums is permitted, provided the original author(s) and the copyright owner(s) are credited and that the original publication in this journal is cited, in accordance with accepted academic practice. No use, distribution or reproduction is permitted which does not comply with these terms.
*Correspondence: Minghai Li, ZGxtaW5naGFpODgxM0BkanR1LmVkdS5jbg==
Disclaimer: All claims expressed in this article are solely those of the authors and do not necessarily represent those of their affiliated organizations, or those of the publisher, the editors and the reviewers. Any product that may be evaluated in this article or claim that may be made by its manufacturer is not guaranteed or endorsed by the publisher.
Research integrity at Frontiers
Learn more about the work of our research integrity team to safeguard the quality of each article we publish.